On the complex disc–corona interactions in the soft spectral states of Soft X-ray Transients
Abstract
Accreting black holes show a complex and diverse behaviour in their soft spectral states. Although these spectra are dominated by a soft, thermal component which almost certainly arises from an accretion disc, there is also a hard X–ray tail indicating that some fraction of the accretion power is instead dissipated in hot, optically thin coronal material. During such states, best observed in the early outburst of Soft X–ray Transients, the ratio of power dissipated in the hot corona to that in the disc can vary from (pure disc accretion) to (equal power in each). Here we present results of spectral analyses of a number of sources, demonstrating the presence of complex features in their energy spectra. Our main findings are: (1) the soft components are not properly described by a thermal emission from accretion discs: they are appreciably broader than can be described by disc blackbody models even including relativistic effects, and (2) the spectral features near 5–9 keV commonly seen in such spectra can be well described by reprocessing of hard X–rays by optically thick, highly ionized, relativistically moving plasma.
keywords:
accretion, accretion disc – black hole physics – stars: individual: GS 2000+25 – stars: individual: GS 1124-68 stars: individual: XTE J1550-564 – X-ray: stars1 Introduction
Black Hole Soft X-ray Transient (SXT) sources are a sub-class of Low Mass X-ray Binaries occasionally undergoing dramatic outbursts. From a dim quiescent state they brighten (in the opt/UV/X/-ray bands) by several orders of magnitude in the course of a few days, and then decline, with roughly exponential dependence of X-ray flux on time (see Tanaka & Lewin 1995; Tanaka & Shibazaki 1996; Chen, Shrader & Livio 1997 for reviews). The outbursts are thought to be caused by a sudden increase of mass accretion rate onto the central object as a result of the disc instability due to hydrogen ionization. The basic mechanism is thus the same as in dwarf novae (e.g. Osaki 1996), but with important differences due to larger and more massive accretion discs and the intense X-ray irradiation in SXT (Cannizzo 1993; King & Ritter 1998).
Black Hole SXT are perfect laboratories to study the accretion process. Black holes are simpler accretors than neutron stars or white dwarfs thanks to the lack of global magnetic field and a hard surface. During an outburst and following decline the mass accretion rate changes by several orders of magnitude, giving data on how the accretion processes change as a function of . Results from SXT studies can then be applied to other systems with accretion onto black holes, e.g. active galactic nuclei (AGN). If similar outbursts take place in AGN, they cannot be observed in progress due to much longer (factor of –) time scales (Burderi, King, & Szuszkiewicz 1998; Siemiginowska, Czerny, & Kostyunin 1996).
Previous investigations of both black hole and neutron star SXT led to identification of a number of distinct spectral/temporal states (see e.g. Tanaka & Lewin 1995; van der Klis 1995 for reviews): (1) quiescence state, when the sources are very dim (), with (poorly constrained) power law spectra, (2) low/hard state, (LS) characterized by a hard, roughly power law spectrum (photon index ) and a strong X-ray variability (r.m.s. 20–30 per cent), with power spectral density (PSD) peaking at Hz; (3) intermediate state (IS), when the power law component is somewhat softer () and a weak soft, thermal component appears in the spectrum; (4) high/soft (HS) state with X-ray spectra dominated by a thermal component of temperature keV and PSD of rather low amplitude (a few per cent) and a power law shape; (5) very high state (VHS) when both the soft, thermal ( keV) and the hard power law components () are present in the spectrum, and similarly the PSD is a mixture of PSDs characteristic to LS and HS. Additionally, quasi-periodic oscillations of various frequency (1–10 Hz) and strength appear in PSD in this state. For the purpose of this work the IS, HS and VHS are referred to as soft states, since it is in these states that a strong soft, thermal component is present in the spectra. Both the directly observed fluxes and temporal sequence of occurrence of these states during SXT’s decline leave little doubt that the accretion rate is lowest in quiescence and increasing through LS, IS, HS to VHS.
A general scenario for the evolution of accretion flow in SXT as a function of accretion rate was presented by Esin, McClintock & Narayan (1997). They suggested that the most characteristic feature of the evolution during the decline – the high to low state transition – involves a major change of the flow geometry. An optically thick, thermally emitting accretion disc dominant in soft states is replaced by a hot, optically thin(ish) flow able to produce the strong, hard X-ray emission seen in the low state by thermal Comptonization (e.g. Gierlinski et al. 1997). The transition presumably involves evaporation of the optically thick disc (e.g. Meyer & Meyer-Hofmeister 1994; Różańska & Czerny 2000), whose inner radius increases from the last stable orbit at in the high state to in the low state ( is the gravitational radius).
One way to track the optically thick accretion disc is through reflection of the hard X–ray spectrum by the accretion disc. The reflected component consists of the Compton reflected continuum with spectral features due to iron K shell absorption and fluorescence imprinted on it (Lightman & White 1988; George & Fabian 1991; Matt, Perola & Piro 1991). When the reprocessing matter forms a disc rotating in a deep potential well, the spectral features are broadened and smeared by Doppler effects and gravitational redshift (Fabian et al. 1989; Ross, Fabian & Brandt 1996). The observed spectral features between 6–9 keV can be fit by such models and the derived amount of reflection and relativistic smearing is consistent with the disc inner edge moving inwards as the LS makes a transition to the IS/HS/VHS (Życki, Done & Smith 1998; Gilfanov, Churazov & Revnivtsev 2000). However, the amount of reflection and smearing seen in the LS generally precludes the disc being as far away as as in the simplest versions of the truncated disc models (Esin et al., 1997), and instead requires that the optically thick material extends down to (Życki, Done & Smith 1997; 1998; 1999a; Miller et al. 2001). While a (somewhat modified) truncated disc model can then fit the LS data, this is not a unique interpretation: the disc could extend down to the last stable orbit if there is complex ionization structure in the disc and/or relativistic outflow of the hard X–ray emitting plasma (see Done 2001 for review and the discussion in Di Salvo et al. 2001).
At higher luminosities, in the IS/HS/VHS the spectrum is dominated by the soft component from the accretion disc (e.g. Ebisawa et al. 1994) as expected in the Esin et al. (1997) model, but this co–exists (especially in the VHS) with a hard X–ray tail. This tail is probably produced by non–thermal Comptonization (Coppi 1999; Gierliński et al. 1999) as it can extend without a break to a few hundred keV (Grove et al. 1998). The ratio of luminosities in the hard and soft components can assume a broad range of values, from where the spectrum is pure disc emission to with equal luminosities in the disc and X–ray hot phase (Ebisawa et al. 1994; Homan et al. 2001; Rutledge et al. 1999; Sobczak et al. 2000). As well as the continuum, iron spectral features at 5–10 keV are again usually observed in the spectra (Ebisawa et al. 1994). They are interpreted as indicating reprocessing of hard X–ray radiation by an optically thick accretion disc, but detailed reflection models are not often fit to the data. A common spectral model is of a disc blackbody (Mitsuda et al. 1984) and power law continuum with a broad iron line and smeared edge to phenomenologically model the reflected spectrum from the disc. While this model gives a rough idea of the ratio of soft to hard luminosity, it has some obvious drawbacks. Firstly, the disc spectrum presumably provides the seed photons for the Compton upscattering, so the hard spectrum cannot extend as an unbroken power law into the disc blackbody spectrum. A power law continuum overestimates the contribution of the hard continuum at soft energies, and so this suppresses and distorts the derived soft component. Also, a true reflected spectrum contains a continuum as well as spectral features. Neglecting the continuum distorts the derived power law spectral index. The few papers which have modelled the reflected spectrum show unambiguously that the reprocessing medium in SXT in the IS/HS and VHS is highly ionized (Życki et al. 1998; Miller et al. 2001; Wilson & Done 2001), unlike the LS where it is mainly neutral. Smearing of the reflected spectral features is observed in all spectral states (Życki et al. 1997, 1998, 1999a; Miller et al. 2001; Wilson & Done 2001).
If the physics of the accretion flow really is controlled predominantly by , then the SXT spectra should be the same as those in the persistent X–ray sources at similar accretion rates. The most thoroughly studied soft state so far – in Cyg X–1 (Gierliński et al. 1999) – shows all the above listed features: non-thermal Comptonization as the origin of the hard X–rays, and the ionized and smeared reprocessed component. Additionally, it conclusively shows that the continuum is not well modelled by a single disc blackbody spectrum which is Comptonized by a non–thermal electron distribution. Additional low temperature Comptonization of the disc spectrum is required by the data (Gierliński et al. 1999; Coppi 1999).
In this paper we re-analyse some of the archival Ginga and RXTE data of SXTs in the soft states. We show that in most cases the spectra cannot be described by a physically motivated model of a simple (disc)blackbody emission, with a Comptonized power law tail which is reflected by the accretion disc. Similarly to the HS Cyg X–1 spectrum described above, the soft component requires a broader spectral form than that of a disc blackbody (even including relativistic corrections). This could be due to additional thermal Comptonization in the disc, or to a separate blackbody component from X–ray heated hot spots on the disc. The poor fit of the disc blackbody model is contrary to most results derived from phenomenological models of the hard component and spectral features (power law plus broad line and/or smeared edge) which generally give adequate fits to the data, and on the few occasions where they did not (e.g. Ebisawa et al. 1994), then the evident problems in the modeling made any inference about the soft component shape unconvincing. The phenomenological models for the spectral features have more free parameters than the physically motivated reflected spectral models, and so can compensate for difficulties in the continuum model. We demonstrate that when the spectral features at 6–9 keV are modelled as X–ray reprocessing, the reprocessor is strongly ionized, as expected for a disc at temperature keV.
2 Data and Models
We analyse Ginga Large Area Counter (LAC) data of GS 1124-68 (Nova Muscae 1991) and GS 2000+25. Ginga data are still some of the best to study spectra with strong soft components, thanks to its broad band energy coverage from keV. The data were re-extracted from LEDAS public archive at Leicester University. The background was subtracted according to the ’universal’ procedure based on blank sky observations (Hayashida et al. 1989). Whenever the source counts contaminated the Surplus above the Upper Discriminator (SUD) monitor, we first recovered the original SUD values using procedure described in Życki et al. (1999a), and then applied the ’universal’ background subtraction. We assume 0.5 per cent systematic errors in the data. This is motivated by the uncertainty in LAC response from fits to the Crab spectrum (Turner et al. 1989), as well as the residual uncertainty in the determination of the LAC background (Hayashida et al. 1989).
We note that for data from instruments like Ginga/LAC or RXTE/PCA the systematic error is often the dominant error up to about 10 keV. Its value then has a direct influence on the values obtained. While this makes the absolute value of and the confidence contours on fit parameters lose their usual statistical meaning, the values do preserve the ranking of models. Since some of our best fits have substantially less than 1, it suggests that the assumed systematic error may be somewhat overestimated.
The RXTE data (PCA top layer only, detectors 0, 1 and 2 only) were extracted from public archive at HEASARC/GSFC, and reduced with FTOOLS ver. 4.2 software. The background was estimated employing the latest background models appropriate for bright sources (the ’sky-VLE’ model for Epoch 3 of RXTE observations). Systematic errors of 1 per cent were assumed in each data channel.
The Ginga data we model here were previously analysed by Ebisawa (1991) and Ebisawa et al. (1994). They used the phenomenological model of a disc blackbody (Mitsuda et al. 1984) plus a power law with smeared edge and broad gaussian line near 6-8 keV. Here we model the spectral features using the rel-repr model (Życki et al. 1999a). The model uses the angle-dependent Green’s functions for the problem of Compton reflection as computed by Magdziarz & Zdziarski (1995; as implemented in XSPEC models pexrav/pexriv), to find the reflected continuum for a given primary continuum. The Fe Kα line is computed as in Życki & Czerny (1994), with photo-ionization computations as in Done et al. (1992), and is then added to the reflected continuum, so that the properties of the reflected continuum and the line are computed consistently for a given ionization state, inclination and elemental abundances. Relativistic and kinematic corrections are then applied by convolving the spectrum with the the appropriate Green’s function for Schwarzschild metric, using the prescription of Fabian et al. (1989). The final model thus have three main parameters: (1) the ionization parameter, , where is the irradiating flux in 5 eV – 19 keV band and is the hydrogen number density, (2) the overall amplitude (normalized to the underlying continuum), which is equivalent to the solid angle of the reprocessor as visible from the X–ray source normalized to , and (3) the inner disc radius, determining the relativistic smearing of the spectral features (the irradiation emissivity is assumed , Życki et al. 1999a). All radii are given in units of the gravitational radius ().
We note that pexriv and rel-repr are based on computations of irradiated discs with constant density. In more advanced computations with hydrostatic equilibrium, the thermal instability of X–ray irradiated plasma plays a role, and leads to a more complex vertical structure, with important observational consequences (Różańska & Czerny 1996; Nayakshin, Kazanas & Kallman 2000). However, the thermal instability is probably unimportant for the soft state spectra in SXT’s as the thermal equilibrium curve (the ionization parameter – temperature, – diagram) degenerates since its lower stable branch is at high disc temperature keV. The soft spectrum dominates the spectrum, so the Compton temperature is not much higher than and the instability is suppressed.
We use two analytical models approximating the inverse-Compton spectra: thComp, based on solution of the Kompaneets equation (Zdziarski, Johnson & Magdziarz 1996) and comptt (Titarchuk 1994). We check whether our conclusions may be affected by the approximate character of the Comptonization models, using the compPS Comptonization model (Poutanen & Svensson 1996), which finds a numerical solution of the Comptonization problem for optically thin () plasma explicitly considering successive scattering orders. This code can be used with a variety of electron energy distributions, including a purely thermal distribution, a purely non-thermal one or a hybrid electron distribution, i.e. a Maxwellian distribution with a power law tail above certain Lorenz factor, (Coppi 1999). Such a hybrid electron distribution can provide a good description of X–ray/-ray spectra of Cyg X–1 in the soft state (Gierliński et al. 1999) as Compton scattering of the disc blackbody by the thermal part of the electron distribution provides an additional, broad soft component while the X–ray power law is produced by Compton scattering of the disc photons by the non–thermal electron tail.
The soft component will be modelled by the diskbb model (Mitsuda et al. 1984). We will also use a general relativistic disc spectrum model grad, which integrates black body spectra over disc radius, taking into account: the colour temperature correction (constant with radius) at (Shimura & Takahara 1995), fully relativistic radial dependence of disc temperature in Schwarzschild metric (Kato, Fukue & Mineshige 1998) and kinematic/relativistic effects on photons propagation, using the method of Fabian et al. (1989). A similar model for the Kerr metric, with the black hole spin will be also used. Here we employ the radial effective temperature prescription from Kato et al. (1998), the colour temperature correction constant with radius, while the photon propagation is done by convolving the local spectra with the transfer function of Laor (1991), as implemented in XSPEC. We note that the colour temperature correction to a blackbody spectrum is appropriate when the escaping photons undergo saturated Comptonization.
We use XSPEC ver. 10 for all spectral fits (Arnaud 1996), with the above non–standard models implemented as local models. Photoelectric absorption is modelled using wabs (Morrison & McCammon 1983), and parameter errors are given as .
3 Intermediate State data
First, we analyse a number of datasets of various sources obtained when the sources were about to make a transition from high state to low state. We refer to them as Intermediate State data.
3.1 GS 2000+25
| parameter | units | A | B | C | D |
| 6.0(f) | 6.0(f) | ||||
| keV | |||||
| keV | – | 10(f) | – | 10(f) | |
| – | – | ||||
| keV | – | – | |||
| – | – | ||||
| – | – | ||||
| erg cm s-1 | – | – | |||
| – | – | ||||
| 38/23 | 17.9/23 | 30.0/23 | 10.6/23 |
Model A: absorption(diskbb + smedge(powerlaw))
Model B: absorption(thComp + smedge(powerlaw))
Model C: absorption(diskbb + thComp + rel-repr)
Model D: absorption(thComp + thComp + rel-repr)
| dataset | model A | model B | model C | model D | model 0 | model E | model F | model G |
|---|---|---|---|---|---|---|---|---|
| Sep 8th | 28.9/24 | 11.0/23 | 90.0/24N | 14.2/24f | 199/26 | 15.6/25f | 18.7/23f | 66.7/24 |
| Oct 18th | 43.9/24 | 14.5/23 | 159/24 | 17.2/23 | 314/26 | 21.0/24 | 12.5/22 | 80.7/24 |
| Nov 5th | 28.5/24 | 14.5/23 | 113/24 | 14.4/23 | 404/26 | 19.2/24 | 12.1/22 | 60.6/24 |
| Dec 8th | 38.0/23N | 17.8/22 | 30.0/23N | 10.6/23f | 46.3/25N | 15.1/25f | 9.0/22f | 32/23N |
Model A: absorption(diskbb + smedge(powerlaw))
Model B: absorption(thComp + smedge(powerlaw))
Model C: absorption(diskbb + thComp + rel-repr)
Model D: absorption(thComp + thComp + rel-repr)
Model 0: absorption(thComp + thComp), i.e. model D without the reprocessed component
Model E: absorption(compPS + rel-repr), hybrid Comptonization
Model F: absorption(diskbb + bbody + thComp + rel-repr)
Model G: absorption(grad + thComp + rel-repr)
N – best fit significantly lower than the interstellar value
f – fixed at the interstellar value
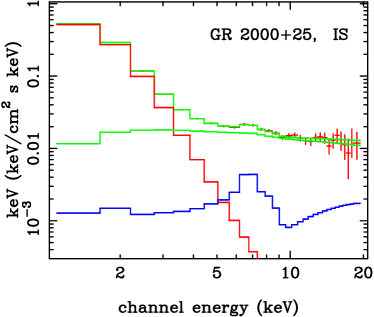
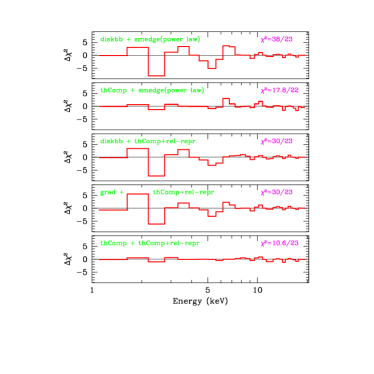
We first analyse the Ginga 1–20 keV spectra of GS 2000+25, beginning with the Dec 8, 1988 dataset (day 224 after the peak on April 28, the last observation in the HS; see Ebisawa 1991, Tanaka & Lewin 1995, fig. 3.11). Repeating the analysis of Ebisawa (1991), we use the diskbb model and a power law tail with the smeared edge applied only to the latter component, wabs*(diskbb + smedge*(powerlaw)) (model A in Table 1). This phenomenological description gives a rather poor fit, , with best fit , i.e. lower than the likely interstellar value of . Adding a Gaussian line to the model does not improve the fit irrespectively of whether the line is narrow or broad, and its energy fixed at 6.4 keV or free. Replacing the disc blackbody model by the Comptonized blackbody (thComp) results in significant improvement, (with fixed at the interstellar value; model B in Table 1). The fit is even better when the hard power law with smeared edge is replaced by Comptonization model thComp (so that the full model contains two thComp components) with its corresponding reprocessed component, rel-repr: the fit has (model D). As a test, we return to the diskbb model for the soft component, but we keep the thComp+rel-repr model for the hard component (model C in Table 1). We obtain a significantly worse fit, with , even though was free in this fit ( increases to 99.7 when is fixed at the interstellar value). Thus the best fit is obtained with the proper physical description of the Fe spectral features and a Comptonized blackbody model for the soft component (model D in Figure 1).
A very similar sequence of results is obtained for the earlier observations of GS 2000+25 (Nov 5th, Oct 18th, Sep 8th, see Table 2), when the source luminosity was higher by up to a factor of than on Dec 8th. In all cases better fits are obtained with the soft component modelled as Comptonized blackbody than a disc blackbody, irrespective of the model used for the hard component (a power law with smeared edge or thComp with rel-repr, although the latter is a more physical description of the source and gives a better fit). Since the power law slope of the soft component is rather high (steep spectrum), the Comptonization temperature, , is not well constrained by thComp. Thus the soft component can be well fit by either low temperature, high optical depth plasma or by high temperature, low optical depth plasma. However, for the latter case when , the approximations on which thComp is based become invalid. Accurate Comptonized spectra are not a power law as the individual scattering orders can be seen, as can the initial seed photons. Using the compPS model (which gives accurate Comptonized spectra including the seed photons for ) for the soft component gives an upper limit on the temperature of keV, corresponding to for spherical geometry for the Sep 8th spectrum. Thus these data favour a low temperature, optically thick(ish), unsaturated () Comptonization of the soft component.
The compPS model can also be used with a hybrid electron distribution (both thermal and non–thermal electrons). This hybrid Comptonization model provides a good description of all the datasets (Model E: Table 2). The thermal part of the hybrid electron distribution Comptonizes the disc blackbody photons into a broader soft component, while the non–thermal electrons Comptonize the disc photons to make the harder spectrum which is reflected from the disc. The parameters of the thermal Comptonizing plasma are similar in all cases: keV, (for a spherical geometry). They are consistent with the parameters derived above for a purely thermal origin for the soft excess (compPS or thComp), but are rather different from the parameters derived from fitting the high state spectrum of Cyg X–1, where keV was required (Gierliński et al. 1999).
| parameter | Nov 5 | Oct 18 | Sep 8 |
|---|---|---|---|
Another possibility to describe the complex soft component in these spectra is to assume a sum of a disc blackbody and an additional single blackbody. The resulting fits are good (model F: Table 2), with the disc blackbody temperature at keV, with a higher temperature for the additional blackbody at keV.
The broadness of the soft component cannot be simply attributed to relativistic effects: the grad model, which includes these effects, does not provide a good description of our data. The values shown in Table 2 are usually even worse for the grad model (model G) than for the simple disc blackbody (model C). In these fits the inner disc radius has been fixed at the marginally stable orbit at . The fits can be improved if is a free parameters, in which case usually increases to . The relativistic effects are not important then, and the model is equivalent to diskbb.
The data clearly require a presence of the reprocessed component. To illustrate its significance we removed this component from the double Comptonization model (model D), and fit parameters of the two continua, including for the first component and . This resulted in bad fits, as given as model 0 in Table 2. The derived parameters for the reprocessed component are similar to those previously inferred for soft states of black hole systems (Życki et al. 1998; Gierliński et al. 1999): the main features are that the reprocessor is highly ionized and it requires further smearing/broadening compared to predictions of the simple model. This is demonstrated in Table 3, where we show parameters of the reprocessed component, as obtained from fitting model D to the Nov 5, Oct 18 and Sep 8 datasets. We model the smearing as due to relativistic and kinematic effects, but spectral features can be additionally significantly broadened by Compton down- and upscattering, as the photons diffuse through the ionized disc layers (e.g. Ross, Fabian & Young 1999). Therefore, as determined from our fits is likely to represent the lower limit on the inner radius of the reflecting disc.
The bolometric luminosity of GS 2000+25 is rather low, if the distance to the source kpc (Callahan et al. 1996) is adopted. Even for the earliest dataset analysed, Sep 8th, the bolometric luminosity, corresponds to less than 2 per cent of the Eddington luminosity. The luminosity on Dec 8th is , while one week later, during the first observation in the LS the luminosity is . It is rather unclear whether this source was showing the same spectral characteristics as other sources (both transient and persistent), despite the low , or the distance is severely underestimated.
3.2 GS 1124-68
Ginga spectral data of GS 1124-68 (Nova Muscae 1991) have been analysed by a number of authors (Ebisawa 1991; Ebisawa et al. 1994; Esin et al. 1997). We have already analysed a number of datasets in Życki et al. (1998). In particular, on 18-May-1991 ( days after the peak of the outburst) the source was observed in a soft state for the last time. Fitting the wabs(diskbb + thComp + rel-repr) model to the 1–20 keV data we obtain a very bad fit, , with overall absorption column . Replacing the diskbb model by Comptonized blackbody, modelled by a second thComp component, yields dramatic improvement, , with fixed at the interstellar value (note that in Życki et al. 1998 we used a power law to approximate the Comptonized hard component). Again the Comptonized soft component is rather steep, so although its slope is well constrained (), and cannot be separately determined in the approximate thComp models. Using CompPS for the soft component again demonstrates that the data require that the Comptonizing medium has low temperature and high optical depth.
The results are robust with respect to the model for the hard component: the wabs(diskbb + compPS + rel-refl model gives , i.e. clearly an unacceptable fit. Replacing the diskbb component with thComp we again obtain a very good fit, . Thus the presence of the additional Comptonization on the soft component does not seem to be an artifact of the approximate character of the Comptonization models.
The hybrid Comptonization model gives a good fit to the data, with . The Maxwellian temperature is keV, the cloud optical depth is , similar to those derived for GS 2000+25. The model comprising a disc blackbody with an additional blackbody gives . The model with the grad component for the soft emission does not give a good fit, .
3.3 XTE J1550-564
The outburst of XTE J1550-564 in September 1998 and subsequent evolution were very well covered by pointed RXTE observations. Basic spectral analyses of the large collected dataset were performed by Sobczak et al. (2000 and references therein), while correlations between timing and spectral properties were studied by Homan et al. (2001). Wilson & Done (2001) studied in the source spectral evolution on the rising phase of the outburst, as the source made a transition from the low state to the very high state. However, here we are interested in Intermediate State. We identify this as occurring during the long minimum after the peak and before the source flux recovered again (see ASM lightcurve in fig. 1 in Homan et al. 2001), and we analyse a spectrum taken in the middle of this interval, on 22 Nov 1998 (MJD=51139).
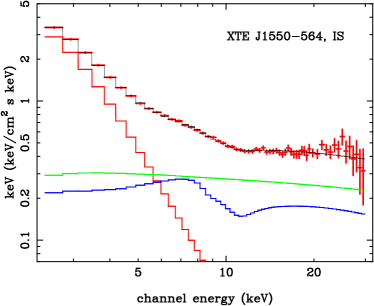
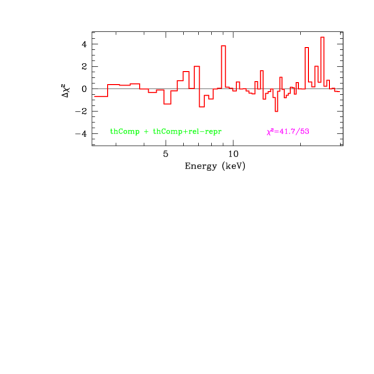
We fit the 2.5–30 keV data with the wabs*(diskbb + thComp + rel-repr) model, i.e. the hard component is modelled as a Comptonized emission with a corresponding reprocessed component. When is fixed at the likely interstellar value of (Wilson & Done 2001), the fit is poor, , with the strongest residuals between 5 and 9 keV. Allowing for free improves the fit somewhat; the best fit has for . Substituting now a second thComp component in place of the diskbb, yields a significant improvement, the best fit has with fixed at (Fig. 2). The hard component has a slope of and its reprocessed spectrum is detected with amplitude from highly ionized material which is strongly smeared, corresponding to (assuming the disc inclination of ). Removing the reprocessed component altogether gives a very poor fit with .
The parameters of the thComp model for the soft component are similar to those derived for GS 2000+25 and GS 1124-68 in that they give a steep power law tail to the disc blackbody (). This broadening of the soft component can be equally well matched by hybrid Comptonization models () or as the sum of disc blackbody with an additional (hotter) blackbody (). The fit with the grad model is rather worse,
Adding HEXTE data to the fit does not change our conclusion about the Comptonization of the soft component. With two compPS components we obtain a good fit, , with the parameters of the soft component very similar to the previous case of PCA data alone.
The distance to the source is rather uncertain, as is the mass estimate of the compact object and indeed its very nature. Estimates of the ratio are therefore very uncertain. The 2–30 keV flux in these data is which is times lower than that on 19th Sept (MJD = 51075), during the bright flare. However, our spectral analysis indicates that significant flux was emitted below 2 keV. The bolometric correction is rather uncertain, depending primarily on whether the seed photons are assumed to be simple blackbody or disc blackbody. We derive the bolometric (unabsorbed), 0.1–1000 keV flux to be . On the other hand, the bolometric correction for the flare spectrum seems to be , so the ratio , possibly less.
Adopting the distance kpc, based on optical observations during the 1998 outburst (Sánchez-Fernández et al. 1999), we obtain rather low peak luminosity, , hence . The latter corresponds to (where ), similar to the soft–hard transition luminosity for Cyg X–1 (Gierliński et al. 1999; Di Salvo et al. 2001).
4 The High and Very High State data
A number of SXTs showed spectral/timing states classified as a VHS. Nova Muscae 1991 showed such a behaviour during the first month around the peak of the outburst (16th Jan 19991) (Ebisawa et al. 1994; Takizawa et al. 1997; Belloni et al. 1997; Rutledge et al. 1999). GRO J1655-40 went through VHS during its outburst in March – September 1997 (Méndez, Belloni & van der Kils 1997). XTE J1550-564 displayed a variety of spectral/timing states including the VHS (Homan et al. 2001; Wilson & Done 2001). A peculiar spectrum was shown by GS 2023+338 at the peak of its 1989 outburst: the spectrum was very hard, with high energy cutoff at the low value of keV (Życki, Done & Smith 1999b).
4.1 GS 1124-68
4.1.1 VHS – Jan 11th data
During this observation the source was still on the rising phase of the outburst, but its bolometric luminosity (with the best model described below) was fairly high, (). Similarly to the case of the IS spectra, we find here that the soft component cannot be described by the disc blackbody model. More specifically, the best fit of the wabs (diskbb + thComp + rel-repr) model has . Replacing the disc blackbody component by the Comptonized blackbody model thComp, gives us a good fit, . This confirms our earlier result (Życki et al. 1999b, see caption to fig. 5), that the soft component in that spectrum is Comptonized, in addition to the obvious Comptonization of the hard component (note that our previous result was obtained with a power law model for the hard component, while here we use a Comptonized spectrum for it). The spectrum is plotted in Fig. 3. Reflection of the hard component is significantly present in the spectrum, its amplitude is , it is strongly ionized and additionally smeared. The smearing corresponds to inner disc radius of . The model with no reprocessed component gives . The spectral slope of the soft Comptonized component is , rather flatter than seen in the IS spectra above. With thComp or comptt, we can only give the lower limit to the plasma temperature, keV. The soft component can also be well described by the sum of disc blackbody ( keV) and and additional, hotter ( keV) blackbody, giving the overall . We were not able to find a good fit with the hybrid Comptonization model (). Similarly, the grad model used for the soft component gives the overall poor fit with .
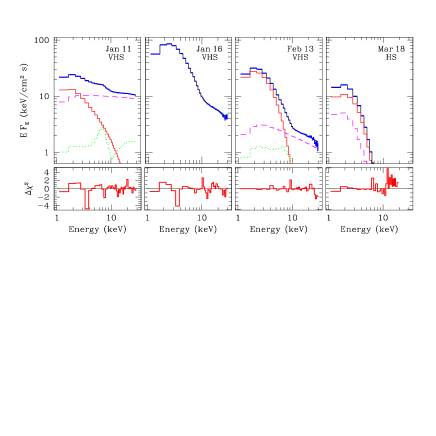
Note that the overall spectrum is rather hard () and it lacks a dominant soft component, making it rather similar to typical low state spectra. This led Miyamoto et al. (1995) to suggest that the transition from spectral hard to soft state occurs at much higher luminosity on the rising phase of the outburst than on the declining phase, i.e. the source shows a kind of hysteresis. However, with more detailed spectral fitting it is evident that the VHS spectrum is rather different from typical low/hard state spectra: the soft component is not a pure disc blackbody emission and the reprocessed features correspond to highly ionized plasma. On the other hand, during the decline, spectra at similar luminosity level were totaly dominated by the soft component (see discussion below and Fig. 6 and 3, the Jan 11. vs. Feb 13. spectrum). Thus indeed the developement/destruction of the optically thick disc spectra does not seem to be symmetric in , in a time-dependent situation.
4.1.2 VHS – Jan 16th data
On Jan 16th the source’s flux reached maximum. The spectrum is dominated by a soft thermal component with a weak, steep power law tail (Ebisawa et al. 1994).
Fitting the wabs (diskbb + thComp + rel-repr) model to 1–30 keV data we obtain a poor fit, , for fixed at the interstellar value . Allowing to be free does not improve the fit. The strongest residuals are below keV, again indicating a more complicated shape of the soft component. Replacing the disc blackbody with a Comptonized component gives an extremely good fit: wabs (thComp + thComp + rel-repr) (with blackbody seed photons) has (with fixed). However, as opposed to the Intermediate State spectra, here the curvature of the soft component is clearly seen and, consequently, the electron temperature is very tightly constrained at keV. The Thomson depth of the Comptonizing plasma is large, with for slab geometry.
Again, an acceptable fit can also be obtained by a hybrid electron distribution: diskbb+ compPS + rel-repr gives assuming that the seed photons for the compPS are the disc blackbody, although this requires larger than the interstellar value, . The thermal part of the hybrid electron distribution is then again a rather cool, keV, optically thick plasma, . Alternatively the soft component can be modelled as a sum of a simple blackbody and a disc blackbody. This gives and parameters: keV and keV, thus the blackbody seems to have a lower temperature than the disc blackbody component, opposite to what was observed for IS spectra. Energetically, the blackbody component contributes per cent of the total flux of the soft component. The grad model for the soft component does not provide a good fit, giving the overall .
The dominance of the soft component in these spectra give perhaps the best view of its shape. Hence we have also fit the data a model of multi-temperature blackbody emission with the radial dependence of the temperature different from the standard formula, . Our motivation for such a model comes from recent work by Watarai et al. (2000), who draw attention to the fact that in luminous accretion discs, , the dependence is flatter than the standard one due to a fraction of energy being advected radially. We have tried both a simple model, with ( and free parameters), and a more complex one, where was actually computed from the radial structure of a vertically averaged Shakura–Sunyaev (1973) disc, with the radial advection included. However, neither of the two models (together with thComp + rel-repr for the hard component) provides a good description of the data. The broadening detected in the soft component is much more evident that can be produced by such models. While it is to be expected that the simple disc blackbody approximation breaks down when the source luminosity reaches (see, e.g., Beloborodov 1998), simple ’first order’ corrections to the disc blackbody models are not sufficient.
Note that in Życki et al. (1999b) we have analysed this dataset and concluded that it is compatible with pure disc blackbody emission with a hard tail. i.e. no additional Comptonization of the soft component was required to make the fit statistically acceptable. That conclusion resulted, however, from our using larger systematic errors of 1 per cent. More specifically, assuming the 1 per cent systematic error, the model diskbb+ thComp + rel-repr gives . However, the model thComp + thComp + rel-repr gives when fit to the same data. The conclusion that the Comptonized blackbody model gives a better fit than the disc blackbody is obviously independent of the assumed value of systematic errors.
4.1.3 VHS – Feb 13th data
This is also a Very High state spectrum, at a luminosity lower by a factor of than the peak luminosity. Here we also find evidence for a Comptonized soft component.
The model wabs(diskbb + thComp + rel-repr) gives for fixed . Letting free gives and , clearly less than the interstellar value. Replacing diskbb with the relativistic model grad improves the fit somewhat, giving .
The Comptonized blackbody model with a hard tail gives a very good fit, , using the thComp model for the soft component, or using the comptt model. Again the data require the additional Comptonizing medium to be at fairly low temperature keV, and optically thick (for slab geometry). Reprocessed emission from the hard component is required in the spectrum, with amplitude and ionization parameter . The relativistic smearing is not required by the data, but they are consistent with smearing with . Setting the reflection amplitude and fitting all the other parameters of the continuum gives a bad fit with .
Again, an alternative description of the soft spectral broadening can be found using diskbb with an additional blackbody (). However, the hybrid Comptonization does not provide a good fit.
4.1.4 High State – March 18th data
Approximately two months after the peak of the outburst Nova Muscae 1991 made a transition to the High State, where its spectrum showed a strong soft component with only very weak hard tail, if at all present (Ebisawa et al. 1994; Esin et al. 1997; see Fig. 3). Ebisawa et al. (1994) noticed that the disc blackbody description failed completely for these data (). We have modelled the spectrum obtained on 18th March. Applying the diskbb + thComp model gives . The fit is bad, since the Comptonized component is steep, , so it makes a significant contribution to the soft component and, as a consequence, misses the points at keV. Thus again the soft component has to be described by a model broader than the multi-colour disc blackbody.
This can also be demonstrated by ignoring data above 10 keV, thus leaving only the soft component (contribution from the hard component to keV is negligible) and attempting to model it by a disc blackbody spectrum. The fit is very bad, , even if is allowed to vary. The grad models gives a better fit, , but this is still far from satisfactory. These data can be well fit by a Comptonized disc blackbody, giving .
The overall spectrum can be well fit using the compPS model with a hybrid electron energy distribution, . The low energy, thermal ( keV) electrons Comptonize the seed, disc blackbody photons broadening somewhat the soft component, while the power law tail in the electron energy distribution gives rise to the weak power law tail seen above 10 keV. An additional blackbody also gives a good fit: wabs (diskbb + bbody + thComp) gives .
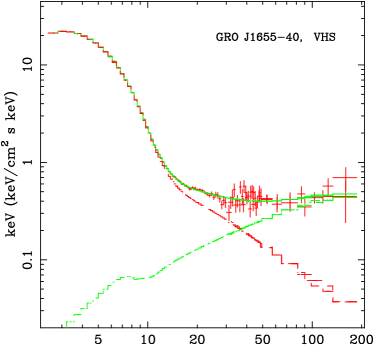
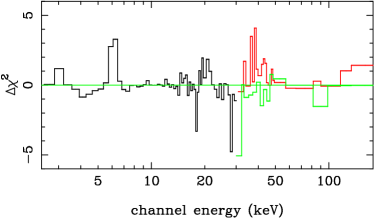
4.2 Very High State of GRO J1655-40
GRO J1655-40 went through a sequence of spectral/temporal states during decline after the outburst observed in March – September 1997. Analysis of the data by Méndez et al. (1997) suggests that during the May 28 observation the source was in the VHS: the energy spectrum contained both a strong soft component and a power law tail. Likewise, the PSD appears to be a sum of a power law component and a flat-topped component (see Takizawa et al. 1997).
We use the 2.5–30 keV top layer RXTE/PCA and 30–200 keV RXTE/HEXTE data for analysis. The value towards this object is rather uncertain: the (Bailyn et al. 1995) corresponds to for standard extinction curve. Fitting the ASCA data of the August 1995 observation Zhang, Cui & Chen (1997a) found , using a power law model for the hard component, while Gierliński, Maciołek-Niedźwiecki & Ebisawa (2001) found using a Comptonization model for the hard component. Fitting the same data, we find values both higher and lower than depending on the model, therefore we let this parameter be free in our fits. We assume the source inclination is .
We begin with PCA data alone. Unusually, the simple model wabs (diskbb + thComp + rel-repr) gives a good fit, , with . Fixing at gives . Further broadening of the soft component is allowed by the data although not required. Replacing the disc blackbody model with thComp yields , again for a cool keV, optically thick, (for a slab geometry) plasma, Comptonizing seed photons at a rather low temperature . These results are very similar to those of Zhang et al. (2000), who fitted similar models to the ASCA data of GRO J1655-40 and GRS 1915+105. Comptonization of the soft component in this source, in high luminosity states, is also reported by Kubota, Makishima & Ebisawa (2001).
Again, the alternative descriptions of the broad soft excess give excellent fits to the data. A hybrid electron distribution gives , while an additional blackbody gives , both fits with .
The central black hole in this object is postulated to be a rotating one based on the observed high temperature and small amplitude of the thermal disc emission (Zhang et al. 1997a). Gierliński et al. (2001) infer black hole spin , fitting a relativistic disc spectrum model, with photon propagation in the Kerr metric to the 1995 ASCA data. However, in order to obtain a good fit, Gierliński et al. need to introduce a smeared edge at 2–3 keV, to model distortions present in the spectrum. Replacing the disc blackbody model in our fits with a disc blackbody in Kerr metric we obtain , fixed at , but with the inner disc radius and central mass as free parameters (to compensate for the fixed value of the black hole spin in our model; see discussion in Gierliński et al. 2001). Thus using the Kerr metric disc model does not improve the fit compared to the simple disc blackbody model. In view of the complex soft component shape which is generally seen in the soft spectral states we caution strongly against interpreting any broadening of the thermal emission solely as relativistic effects (although such effects should be present).
The above models are no longer adequate when the HEXTE data are added. An additional, harder continuum component is required to model the broadband spectrum, as already found for the VHS spectra of XTE J1550-564 by Wilson & Done (2001). A possible description of the spectrum is provided by the hybrid Comptonization model with an additional, thermal Comptonization. The slopes of the two Comptonized tails (the non-thermal tail and the additional Comptonization) are not well constrained individually, so we fit the model fixing the slope of the non-thermal electron distribution at (i.e. steeper than in the fit to PCA data alone). We allowed both continua to give rise to the reprocessed component, but with the same parameters (, and ). The overall model, wabs(compPShybrid + rel-refl + thComp + rel-repr), gives a good fit to the data, (Fig. 4). The reprocessed component is clearly detected in the spectrum: without it the fit is much worse, . The reflection amplitude (lower limit but with poorly constrained upper limit), the ionization parameter , and the inner disc radius . This differs from the results of Gierliński et al. (2001), who did not find any significant reflection features in ASCA data of this source.
5 Discussion
We have re-analysed archival data of a number of SXT sources in soft spectral states in an attempt to characterize their spectral properties in more detail than has generally been done so far. In most previous analyses of IS, HS and VHS spectra the assumed spectral model consisted of a disc blackbody emission, a power law, a smeared edge and a gaussian line near 5–9 keV. Of these, the edge and the line are the least accurate representation of the underlying physical processes. We replace them with a more physical model of X-ray reprocessing by an optically thick plasma. Also, a power law is an inaccurate approximation to Comptonized emission at energies close to the seed photons as true Comptonized spectra have a low energy cutoff. In the soft spectral states the seed photons from the disc are within the observed bandpass, so such effects become important.
Two results from the above data analyses seem to be robust: firstly, the soft component cannot be adequately described by the simple disc blackbody model and, secondly, the reprocessed component is present in the data, it is strongly ionized and smeared.
The complexity of the soft component is not merely an artifact of using the approximate diskbb model. Including the torque-free boundary condition, colour temperature and relativistic effects in photon propagation does not substantially change the overall shape of the spectrum, although the derived model parameters can be significantly different (e.g. Ebisawa 1991; Gierliński et al. 1999; Merloni, Fabian & Ross 1999). Direct fitting of our relativistic disc model grad, which includes the corrections, supports our claim. Although the best fits are somewhat better than the model employing diskbb, they are much worse than fits employing Comptonized black body. Similarly, using the Kerr metric disc emission model did not provide better description of the spectrum of GRO J1655-40 compared to the simple disc blackbody model. The soft component is substantially broader than optically thick disc models, irrespective of relativistic corrections.
Using the Ginga or RXTE data we are not able to differentiate between various possible modifications of the disc blackbody spectrum which ensure a good description of data. The two main possibilities are additional Comptonization of the disc emission or an additional blackbody component. We discuss each of these in turn.
5.1 The complex soft component: additional blackbody
One possibility to explain the complex shape of the soft component is to assume that it is a sum of a disc blackbody and additional blackbody emission, indicating that some fraction of the disc material is heated to rather higher temperatures. Physically we might expect this if the hard X–ray power law arises from magnetic reconnection. The regions of the disc below the intense flares are then heated by the irradiating flux and the thermalized (non–reflected) radiation would be emitted as a quasi–blackbody spectrum at temperatures somewhat higher than the mean disc emission (Haardt, Maraschi & Ghisellini 1994). Alternatively, for a central source geometry, the inner disc is additionally heated by irradiation. In all these models the additional blackbody is powered ultimately by the hard component.
Energetically this is certainly feasible for the IS spectra. Consider, for example, the GS 1124-68 May 18th data. The bolometric (0.01–1000 keV) flux from this model is (in units of ): , the hard X–ray flux is , while the flux in the additional blackbody is . The reprocessor albedo is observed to be (ionization of , so that FeXXV and FeXXVI are the dominant ionization stages of iron). Thus the thermalized fraction is expected to be . Given the uncertainties in the modeling this is probably consistent with the observed fraction .
The observed flux at keV implies an emitting area , where is the Stefan-Boltzmann constant. This gives a tiny area, , assuming distance kpc, and neglecting the colour temperature correction. This is consistent with magnetic flare illumination, if the illuminating area is small, i.e. if the flares are located not too high above the disc (Nayakshin & Kazanas 2001). In the central source geometry the distribution of irradiation flux is somewhat steeper than close to the inner disc radius (see fig. A2 in Życki et al. 1999a). This gives an excess of emission, if modelled by the diskbb model, but the excess is not sufficient to account for the observed shape of the soft component. Partial overlap between the central source and the disc might solve the problem.
However, the soft component is overwhelmingly dominant in the HS spectra and reprocessing of the very small hard X–ray flux is not consistent with the flux required for the additional blackbody. An extreme example here is the HS GS 1124-68 March 18th dataset, where the hard X–ray ( keV) flux is less than 1 per cent of the total flux, while the additional blackbody component contains of the total flux. The situation is not so extreme for the VHS spectra, where there is some hard X–ray emission. The observed fluxes of hard X–rays are rather smaller than the fluxes of the additional blackbody components, which rules out the possibility of the blackbody being the thermalized hard X–ray illumination, if isotropic emission of the latter is assumed. The peak spectrum of GS 1124-68 (Jan 16th; Sec 4.1.2) is a good example here: the fluxes in the 0.01– keV band (in units of ) are: , , and . If the hard X–rays were beamed towards the disc, both the thermalized emission and the reprocessed component would be enhanced. The amplitude is not always well constained in VHS data due to complex continuum curvature; for example for the Jan 16th data , while for the Feb 13th .
5.2 The complex soft component: Comptonization
The two-component description of the disc emission does not seem appropriate for the brighter spectra, especially those lacking a strong hard component. The additional Comptonization of the disc emission provides an alternative description to those (and all other) spectra. The parameters of the Comptonizing plasma are not well constrained, but generally a cool, keV, optically thick, , plasma gives the best fit. The main difference between this and the same spectral index Comptonization from a hotter, optically thinner plasma is in the possible contribution of the seed photons to the final spectrum for . However, this subtle difference is not sufficient to uniquely select the best fit solution, given the rather poor energy resolution and low energy bandpass of the data used here.
We can envision a number possibilities for the origin of the Comptonization of disc emission.
5.2.1 Warm atmosphere of the accretion disc
The soft photons from the disc interior can be Comptonized as they escape through a hot, ionized topmost layer of the disc.
If the Comptonizing layer is heated by external irradiation only, i.e. viscous heating is negligible, its maximum temperature is the inverse Compton temperature, , at which Compton heating is balanced by Compton cooling. This temperature can be estimated from
| (1) |
where is the radiation energy density, and is the Klein–Nishina cross section. For a spectrum consisting of a strong soft component and a steep power law, is not much larger than the temperature of the soft component. For example, for the May 18th data of GS 1124-68 we calculate keV, and similar values are obtained for the other IS spectra. This is lower than the inferred temperature of the Comptonizing plasmas, implying that there must be additional heating of the plasma through e.g. viscous dissipation (Janiuk, Czerny & Madejski, 2001). Only for the 11th Jan spectrum of GS 1124-68 is keV comparable to the required of the Comptonizing plasma.
This picture then implies a three-phased accretion scenario: the hot, keV, plasma with the Comptonization parameter , producing the hard X–ray continuum; the warm, –10 keV plasma with , responsible for the additional Comptonization of the disc emission; and the optically thick, ’cold’, –1 keV disc. A similar accretion scenario was also suggested for the Seyfert 1 galaxy NGC 5548 (Magdziarz et al. 1998). The clear soft X-ray excess component in that object could be well modelled by a Comptonization of accretion disc photons in a warm ( eV), optically thick () plasma. Magdziarz et al. speculated that the plasma could form a transition region between the outer, cold accretion disc and the inner hot flow. Similar Comptonized soft X–ray excesses are present in two Narrow Line Seyfert 1 galaxies: PG 1211-143 (Janiuk et al. 2001), and PKS 0558-504 (O’Brien et al. 2001). A possible analogy of such three-phased configuration around accreting black holes with the Solar corona was suggested by Zhang et al. (2000).
However, the warm plasma cannot form a continuous later covering the cold disc. It is optically thick and completely ionized so would produce no spectral features, contrary to results of our data analyses. More robust (given the uncertainties in optical depth and temperature) arguments against such a geometry are provided by considering the energy balance between the cool disc and warm skin. Following the approach of Haardt & Maraschi (1991), the energy balance can be written as
| (2) |
while for the warm skin
| (3) |
where the fraction of energy dissipated in the warm skin (disc dissipation ), is the fraction of Comptonized emission returning to the cold disc, is the Comptonization amplification factor, , and all the fluxes are normalized to the total gravitational energy dissipated in the two layers. Solving Eq. (2) and Eq. (3), we obtain the condition for the existence of solution,
| (4) |
Curiously, the Comptonization parameters from the fits to GRO J1655-40 imply and , thus . This, in turn, implies very close to 1, i.e. the entire energy dissipation in the warm skin, with the cold disc merely reprocessing and thermalizing the intercepted radiation.
The situation is analogous to that with a continuous hot corona overlapping an optically thick disc (Haardt & Maraschi 1991). Even in the extreme case of the produced spectra are not harder than , because the geometry alone implies . Any harder spectra imply e.g. a patchy corona, coronal outflow, etc. (e.g. Stern et al. 1995; Beloborodov 1999).
A possible solution to the reprocessed features problem is to assume that the scattering layer appears only in the inner part of the disc, close to the radius of maximum effective temperature. The reprocessing features could then be produced further out, where the temperature is lower enabling iron to recombine to H- and He-like ions, as observed. The relativistic smearing of the iron features, usually corresponding to supports this possibility.
5.2.2 Hybrid electron energy distribution in the Comptonizing plasma
Another possibility for the Comptonization of the soft photons is to assume a hybrid, thermal/non-thermal distribution of electron energies in an accretion disc corona (see Coppi 1999 for extensive discussion of relevant physical processes). The harder power law spectrum extending above keV would then be a result of single inverse Compton upscattering of the disc photons by energetic electrons from the power law tail of the distribution. The Comptonized tail of the soft component is a result of scattering of the photons by the low energy electrons, with roughly Maxwellian distribution. Such model was successfully applied to the soft state data of Cyg X-1 (Gierliński et al. 1999), where the soft component shows a clear excess above a disc blackbody component, while the hard power law extends without a break to at least 1 MeV (Grove et al. 1998). Fitting the CompPS Comptonization model (Poutanen & Svensson 1996) with such hybrid electron distribution we found that indeed it provides a good description of some of the spectra: the IS spectra of all three analysed objects are well described by it, as well as some VHS spectra: the peak spectrum of GS 1124-68 and the spectrum of GRO J1655-40. On the other hand, we were not able to find an acceptable description of the Jan 11 and Feb 13 of GS 1124-68 with this model.
5.2.3 Weak thermal corona
Yet another possibility for the Comptonization of soft photons is a weak, accreting corona, similar to that studied by Witt, Czerny & Życki (1997), and Janiuk, Życki & Czerny (2000). In these models the disc–corona transition is governed by the condition of thermal equilibrium between the two phases of accreting plasma. This results in a rather weak corona, dissipating up to per cent of gravitational energy. Details of the solution depend upon the role of advective energy transfer (compare solutions in Janiuk & Czerny 2000 and Janiuk et al. (2000), but generally the corona is optically thin, and its temperature varies between keV at to 150 keV further away. The resulting spectra are rather steep and roughly match the Comptonized excesses in the IS spectra, but such a weak corona would not be able to account for the strong Comptonization observed in e.g. Jan 16th spectrum of GS 1124-68. The model cannot account for the origin of the hard component seen in IS and VHS. There is, however, growing evidence of a very close link between hard X–ray and radio emission (see Fender 2000, 2001 for reviews). If the two are indeed linked, one may envision the hard X–rays originating from e.g. a base of a jet.
5.3 X–ray reprocessing
Spectral features near 6–9 keV are commonly observed in spectra of accreting compact objects, and they are indeed present in the spectra analysed in this paper. Reprocessing of hard X–rays by an optically thick plasma (Compton reflection, photo-absorption, fluorescent and recombination emission) is the standard interpretation of these features. It has been tested on numerous spectra of all kind of accreting objects, although most of the modeling work has been done with low/hard state spectra. The problem with soft states spectra is the complicated shape of the continuum emission near 5–10 keV, where the soft and hard component contribute roughly equally. In our work we do see that the parameters of the reprocessed component in the soft states spectra are dependent on the continuum model adopted. However, two results are robust from the work done so far:
-
•
the very presence of the reprocessed component, i.e. we have not been able to find a continuum description that would make the reprocessed component unnecessary,
-
•
high level of ionization of the reprocessor: again, irrespectively of the continuum model, the reprocessing features correspond to highly ionized plasma, where most abundant Fe ions are more strongly ionized than FeXVI (M-shell electrons removed), and in most cases the He- and H-like ions.
The third result is that the spectral features are further broadened and smeared compared to predictions of the simple model. We model the smearing as the relativistic Doppler effect and gravitational redshift, but it has to be kept in mind that Comptonization in the reprocessor is quite significant, especially for strong ionization (e.g. Ross et al. 1999). Therefore the quantitative determinations of the inner radius of the reprocessing accretion disc may be overestimated.
A potential alternative to the reprocessing scenario might be absorption/emission in winds which are almost certainly launched from the vicinity of central objects accreting at close to the Eddington limit (e.g. Proga 2000 and references therein). The characteristic ’P-Cygni’ emission/absorption profiles might turn out to be compatible with the data. This idea has not been explored in any details and its quantitative tests are not possible at present, as the spectral predictions of the models are not ready yet to be quantitatively confronted with the data.
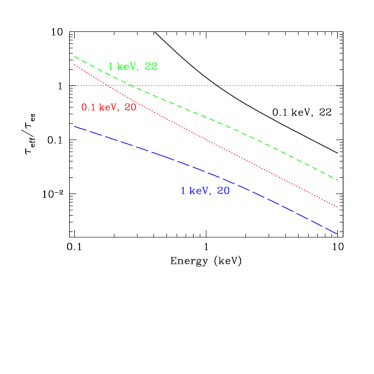
One potential problem that might affect our conclusions is that the computations of the reflected continuum used in the rel-repr model (Magdziarz & Zdziarski 1995) assume that the only X–ray absorption process is the photo-electric absorption. However, the density in accretion discs around stellar mass black holes is high enough for the free-free process to become important. Another way of formulating the problem is to notice that – by the very definition of a soft state – the X–rays at keV are thermalized. If so, then the reflected continuum could have a rather different shape at low energies than that used in our model. Precise computations of the reflected continuum in such conditions are not possible at present, as no photo-ionization code can handle densities and thermalization of incident X–rays. We can however estimate whether the incident X–rays at keV are likely to be thermalized or not. Solving the vertical structure of an disc around black hole at (see e.g. Różańska et al. 1999) we find the H number density at the disc equator . We compute the free–free absorption cross-section (Rybicki & Lightman 1979) as a function of energy for a number of values of gas temperature and density. The results, plotted as the effective absorption, in units of the Thomson cross section as a function of energy, are shown in Fig. 5. Since the effective absorption coefficient is smaller than 1 for keV, the incident X–rays will not be thermalized in the uppermost layer, where Compton reflection takes place. Thus the adopted model for the Compton reflected continuum is appropriate.
5.4 Disc stability
Perhaps the most puzzling behaviour of SXTs, in the context of the -discs model (Shakura & Sunyaev 1973), is the strong soft thermal emission observed when the sources radiate at a significant fraction of the Eddington luminosity, when the -discs are unstable (Kato et al. 1998), and so perhaps they should not exist. On the other hand, these discs are stable for low (LS) when, observationally, they seem not to be present in the central regions of GBH. While the latter problem seems to have found its solution in the mechanism of disc evaporation (Różańska & Czerny 2000 and references therein), the former one is far from any satisfactory explanation.
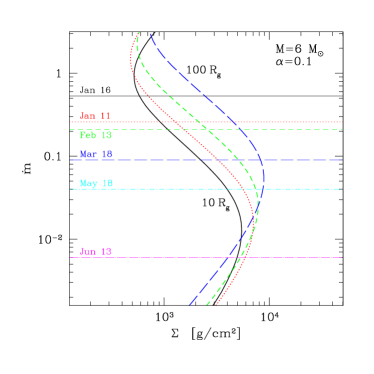
Here we construct the – (accretion rate – surface density) diagram and mark the position of GS 1124-68, to quantitatively demonstrate the extent of the instability. This extends studies done by Gierliński et al. (1999), who argued that in the soft state of Cyg X-1 the accretion disc could remain on the stable branch, down to the last stable orbit. However, we note that the soft state of Cyg X-1 seems to correspond to an Intermediate State of GS 2000+25 or GS 1124-68 rather than a true High State, since its bolometric luminosity is rather low, only (Gierliński et al. 1999), not much higher than a typical low state luminosity (Zhang et al. 1997b; Di Salvo et al. 2001). We estimated the bolometric luminosities of GS 1124-68 from models using either disc blackbody or Comptonized disc blackbody spectra, which should give an upper limit to the bolometric correction. We further assumed a black hole at kpc. Since the largest value of found in literature is kpc (Esin et al. 1997), the uncertainty of should be less than factor of 2. Figure 6 shows positions of the source on the – diagram, demonstrating that the disc was stable in LS, but it was unstable (at least in some inner region) whenever the source was observed in a soft state. One might then speculate that the result of the instability is a slight reconfiguration of the disc, so that the disc emission is still optically thick, but with the additional Comptonization in some warm plasma. There is a number of instabilities operating in radiation pressure dominated discs (Kato et al. 1998; Gammie 1998; Blaes & Socrates 2000), and it is possible that their outcome may be a clumpy accretion flow (Krolik 1998). On the other hand, the amplitude of the soft component sees to be constant during the part of the decline when the spectral state is soft (Ebisawa 1991), indicating that the covering factor of the clumps cannot to be low, so that the disc effectively looks continuous.
The highest luminosity spectra seem to need rather different parameters of the Comptonization compared to the IS spectra. Perhaps, the disc structure changes when the disc solution is located on the upper stable branch (so called ’slim discs’: optically thick, with advective cooling; Abramowicz et al. 1988). Alternatively, if the viscous heating scales with the gas pressure rather than the total (gas plus radiation) pressure then the instability is avoided (Stella & Rosner 1984). While such a scaling might be expected for an MHD dynamo origin of the viscosity (Stella & Rosner 1984), this has not yet been confirmed by numerical simulations. An interesting alternative viscosity prescription is implied by hydrodynamic experiments on rotating flows (Richard & Zahn 1999). For a Keplerian disc, the viscosity can be written as , where is the distance from the rotation axis and the coefficient , where is the Reynolds number. This prescription gives disc solutions that are both thermally and viscously stable (Huré, Richard & Zahn 2001).
6 Conclusions
We model the spectra of Soft X–ray Transients in soft states using more physical models for the emission. We use reflection models as opposed to phenomenological broad line/smeared edge features, and Comptonization models which include the low energy cutoff at the seed photons as opposed to a continuous power law. We find that the strong soft component cannot be described by simple disc models (disc blackbody with colour temperature and/or relativistic corrections). There is additional broadening of the soft emission, indicating the presence of intermediate (between the cool main disc and the hot X–ray plasma) temperature material. This can be modelled either as an additional blackbody, or as additional Comptonization. Both could be plausibly present. Magnetic reconnection above the disc could produce an X–ray heated spot underneath the flare, and/or the electrons in the flare itself may have a hybrid distribution, with a thermal tail at low energies which additionally Comptonizes the disc emission as well as a non–thermal power law to give the hard X–ray flux. Alternatively (additionally?) there could be a warm skin over the inner disc which Comptonizes the highest temperature emission from the disc.
An ionized reflected component is always detected irrespective of the detailed model used to describe the soft component.
Acknowledgments
This work was partly supported by grant no. 2P03D01718 of the Polish State Committee for Scientific Research (KBN) and by British-Polish Joint Research Collaboration Programme.
References
- [] Abramowicz M. A., Czerny B., Lasota J. P., Szuszkiewicz E., 1988, ApJ, 332, 646
- [] Arnaud K. A., 1996, in Jacoby G., Barnes J., eds, ASP Conf. Ser. Vol. 101, Astronomical Data Analysis Software and Systems V. Astron. Soc. Pac., San Francisco, p. 17
- [] Bailyn C. D. et al., 1995, Nature, 374, 701
- [] Belloni T., van der Klis M., Lewin W. H. G., van Paradijs J., Dotani T., Mitsuda K., 1997, A&A, 322, 857
- [] Beloborodov A. M., 1998, MNRAS, 297, 739
- [] Beloborodov A. M., 1999, ApJ, 510, L123
- [] Blaes O., Socrates A., 2000, ApJ, submitted, (astro-ph/0011097)
- [] Burderi L., King A. R., Szuszkiewicz E., 1998, ApJ, 509, 85
- [] Callahan P. J., Garcia M. R., Filippenko A. V., McLean I., Teplitz H., 1996, ApJ, 470, L57
- [] Cannizzo J. K., 1993, in Wheeler J. C., ed, Accretion in Compact Stellar Systems. World Scientific, Singapore, p. 6
- [] Chen W., Shrader C. R., Livio M., 1997, ApJ, 491, 312
- [] Coppi P., 1999, in Poutanen J., Svensson R., eds, ASP Conf. Ser. Vol. 161, High Energy Processes in Accreting Black Holes. Astron. Soc. Pac., San Francisco, p. 375
- [] Di Salvo T., Done C., Życki P. T., Burderi L., Robba N. R., 2001, ApJ, 547, 1024
- [] Done C., 2001, AdSpR, in press, (astro-ph/0012380)
- [] Done C., Mulchaey J. S., Mushotzky R. F., Arnaud K. A., 1992, ApJ, 395, 275
- [] Ebisawa K., 1991, PhD thesis, Univ. of Tokyo
- [] Ebisawa K. et al., 1994, PASJ, 46, 375
- [] Esin A. A., McClintock J. E., Narayan R., 1997, ApJ, 489, 865
- [] Fabian A. C., Rees M. J., Stella L., White N. E., 1989, MNRAS, 238, 729
- [] Fender R., 2001, in Kaper L., van den Heuvel E. P. J., Woudt P. A., eds, Black Holes in binaries and galactic nuclei. Springer-Verlag, p. 193, (astro-ph/9911176)
- [] Fender R., 2000, Ap&SS, in press, (astro-ph/0010613)
- [] Gammie C. F., 1998, MNRAS, 297, 929
- [] George I. M., Fabian A. C., 1991, MNRAS, 249, 352
- [] Gierliński M., Zdziarski A. A., Done C., Johnson W. N., Ebisawa K., Ueda Y., Phlips F., 1997, MNRAS, 288, 958
- [] Gierliński M., Zdziarski A. A., Poutanen J., Coppi P., Ebisawa K., Johnson W. N., 1999, MNRAS, 309, 496
- [] Gierliński M., Maciołek-Niedźwiecki A., Ebisawa K., 2001, MNRAS, in press (astro-ph/0103362)
- [] Gilfanov M., Churazov E., Revnivtsev M., 2000, in Proc. of the 5th CAS/MPG Workshop on High Energy Astrophysics, in press, (astro-ph/0002415)
- [] Grove J. E., Johnson W. N., Kroeger R. A., McNaron-Brown K. Skibo J. G., Phlips B. F., 1998, ApJ, 500, 899
- [] Haardt F., Maraschi L., 1991, ApJ, 380, L51
- [] Haardt F., Maraschi L., Ghisellini G., 1994, ApJ, 432, L95
- [] Hayashida K., Inoue H., Koyama K., Awaki H., Takano S., 1989, PASJ, 41, 373
- [] Homan J., Wijnands R., van der Klis M., Belloni T., van Paradijs J., Klein-Wolt M., Fender R., Méendez M., 2001, ApJS, 132, 377
- [] Huré J.-M., Richard D., Zahn J.-P., 2001, A&A, 367, 1087
- [] Janiuk A., Czerny B., 2000, NewA, 5, 7
- [] Janiuk A., Czerny B., Madejski G. M., 2001, ApJ, in press
- [] Janiuk A., Życki P. T., Czerny B., 2000, MNRAS, 314, 364
- [] Kato S., Fukue J., Mineshige S., 1998, Black Hole Accretion Disks. Kyoto University Press, Kyoto
- [] King A. R., Ritter H., 1998, MNRAS, 293, L42
- [] Krolik J. H., 1998, ApJ, 498, L13
- [] Kubota A., Makishima K., Ebisawa K., 2001, ApJ, submitted, (astro-ph/0105426)
- [] Laor A., 1991, ApJ, 376, 90
- [] Lightman A. P., White T. R., 1988, ApJ, 335, 57
- [] Matt G., Perola G. C., Piro L., 1991, A&A, 247, 25
- [] Magdziarz P., Zdziarski A. A., 1995, MNRAS, 273, 837
- [] Magdziarz P., Blaes O. M., Zdziarski A. A., Johnson W. N., Smith D. A., 1998, MNRAS, 301, 179
- [] Méndez M., Belloni T., van der Klis M., 1998, ApJ, 499, L187
- [] Merloni A., Fabian A. C., Ross R. R., 1999, MNRAS, 313, 193
- [] Meyer F., Meyer-Hofmeister E., 1994, A&A, 288, 175
- [] Miller J. M., Fox D. W., Di Matteo T., Wijnands R., Belloni T., Pooley D., Kouveliotou C., Lewin W. H. G. 2001, ApJ, 546, 1055
- [] Miyamoto S., Kitamoto S., Hayashida K., Egoshi W., 1995, ApJ, 442, L13
- [] Mitsuda K. et al., 1984, PASJ, 36, 741
- [] Morrison R., McCammon D., 1983, ApJ, 270, 119
- [] Nayakshin S., Kazanas D., 2001, ApJ, 553, L141
- [] Nayakshin S., Kazanas D., Kallman T. R., 2000, ApJ, 537, 833
- [] O’Brien P. T. et al., 2001, A&A, 365, L122
- [] Osaki Y., 1996, PASP, 108, 39
- [] Poutanen J., Svensson R., 1996, ApJ, 470, 249
- [] Proga D., 2000, ApJ, 538, 684
- [] Richard D., Zahn J.-P., 1999, A&A, 347, 734
- [] Ross R. R., Fabian A. C., Brandt W. N., 1996, MNRAS, 278, 1082
- [] Ross R. R., Fabian A. C., Young A. J., 1999, MNRAS, 306, 461
- [] Różańska A., Czerny B., 1996, Acta Astron., 46, 233
- [] Różańska A., Czerny B., 2000, A&A, 360, 1170
- [] Różańska A., Czerny B., Życki P.T., Pojmański G., 1999, MNRAS, 305, 481
- [] Rutledge R. E. et al., 1999, ApJS, 124, 265
- [] Rybicki G. B., Lightman A. P. 1979, Radiative Processes in Astrophysics. John Wiley & Sons, New York
- [] Sánchez-Fernández et al., 1999, A&A, 348, L9
- [] Shakura N. I., Sunyaev R. A., 1973, A&A, 24, 337
- [] Shimura T., Takahara F. 1995, ApJ, 445, 780
- [] Siemiginowska A., Czerny B., Kostyunin V., 1996, ApJ, 458, 491
- [] Sobczak G. J., McClintock J. E., Remillard R. A., Cui W., Levine A. M., Morgan E. H., Orosz J. A., Bailyn C. D., 2000, ApJ, 544, 993
- [] Stella L., Rosner R., 1984, ApJ, 277, 312
- [] Stern B., Poutanen J., Svensson R., Sikora M., Begelman M. C., 1995, ApJ, 449, L13
- [] Titarchuk L. 1994, ApJ, 434, 570
- [] Takizawa M. et al., 1997, ApJ, 489, 272
- [] Tanaka Y., Lewin W. H. G., 1995, in Lewin W. H. G., van Paradijs J., van den Heuvel E., eds, X–Ray Binaries. Cambridge Univ. Press, Cambridge, p. 126
- [] Tanaka Y., Shibazaki N., 1996, ARA&A, 34, 607
- [] Turner M., J., L. et al., 1989, PASJ, 41, 345
- [] van der Klis M., 1995, in Lewin W. H. G., van Paradijs J., van den Heuvel E., eds, X–Ray Binaries. Cambridge Univ. Press, Cambridge, p. 252
- [] Watarai K., Fukue J., Takeuchi M., Mineshige S., 2000, PASP, 52, 133
- [] Wilson C. D., Done C., 2001, MNRAS, in press, (astro-ph/0102167)
- [] Witt H. J., Czerny B., Życki P. T., 1997, MNRAS, 286, 848
- [] Zdziarski A. A., Johnson W. N., Magdziarz P., 1996, MNRAS, 283, 193
- [] Zhang S. N., Cui W., Chen W., 1997a, ApJ, 482, L155
- [] Zhang S. N., Cui W., Harmon B. A, Paciesas W. S., Remillard R. E., van Paradijs J., 1997b, ApJ, 477, L95
- [] Zhang S. N., Cui W., Chen W., Yao Y., Zhang X., Sun X., Wu X.-B., Xu H., 2000, Science, 287, 1239
- [] Życki P. T., Czerny B., 1994, MNRAS, 266, 653
- [] Życki P. T., Done C., Smith D. A., 1997, ApJ, 488, L113
- [] Życki P. T., Done C., Smith D. A., 1998, ApJ, 496, L25
- [] Życki P. T., Done C., Smith D. A., 1999a, MNRAS, 305, 231
- [] Życki P. T., Done C., Smith D. A., 1999b, MNRAS, 309, 561