The Globular Cluster Systems of Ellipticals and Spirals
Abstract
In this overview of the key properties of globular cluster (GC) systems I show that the GCs in elliptical and spiral host galaxies have more in common than previously thought. After contrasting these properties I briefly comment on GC formation.
Astrophysics & Supercomputing, Swinburne University, Hawthorn, VIC 3122, Australia
1. Spatial Distribution
For the Milky Way (Minniti 1995) and other spiral galaxies (Forbes, Brodie & Larsen 2001) a consenus is emerging that the bulk of the metal-rich globular clusters (GCs) in spirals are associated with the bulge rather than the disk component, and the metal-poor GCs with the halo. A similar situation appears to be present in ellipticals with the red GCs associated with the elliptical bulge/spheroid and the blue GCs with the (hot gas) halo (Forbes, Brodie & Larsen 2001).
Globular cluster systems typically reveal a surface density distribution that is near constant close to the galaxy centre and which falls off rapidly like a power-law at larger radii. By fitting a King core profile to the GC density profile, a system core radius can be defined. Early-type galaxies reveal a trend for more massive galaxies to have larger core radii (Forbes et al. 1996). The Milky Way GC system, with a core of 1 kpc, seems to obey this trend.
2. Numbers and Specific Frequency
For small ellipticals, the number of GCs scales with the galaxy luminosity, while the most massive ellipticals appear to have a slightly steeper scaling relation (Djorgovski & Santiago 1992). One possible explanation for this comes from the work of McLaughlin (1999). This model requires a universal efficiency factor which is defined to be the ratio of mass in GCs to that of the initial gas mass available to form those GCs. For most ellipticals the initial gas supply has been converted into stars and is hence well represented by the current stellar mass (or luminosity). As a consequence these galaxies have a near constant SN 3. For high luminosity galaxies, McLaughlin argues that the current stellar mass grossly underestimates the initial gas supply and so they appear to be rich in GCs when they should be considered as poor in field stars. However by including the current gas content (as indicated by the presence of extensive X-ray gas), along with the current stellar mass, the GC systems of such galaxies can be understood as part of a continuous trend. McLaughlin’s relation can successfully explain the wide variation in GC number with luminosity.
Fig. 1 shows the McLaughlin relation with a universal efficiency factor of 0.2%. The data for early-type galaxies scatters uniformly about the relation. I have also included the location of three well-studied spiral galaxies (using the bulge luminosity), i.e. M104 (NGC 4594), M31 and the Milky Way (data from Forbes et al. 2000 and Larsen et al. 2001). The GC systems of the three spirals are consistent with the early-type galaxy number–luminosity trend.

3. Metallicities and Abundances
Historically, one difference between the GCs in spirals and ellipticals was the mean metallicity of the two peaks. The Milky Way and M31 have GC subpopulations with metallicities of [Fe/H] –1.5 and –0.5 (Barmby et al. 2000) while ellipticals were thought to have mean GC [Fe/H] –1.0 and 0.0 (Harris 1991). Recently, two developments have caused us to reasses the mean GC metallicity in ellipticals – both of which make the GCs in ellipticals more metal–poor. The first effect is the use of more accurate transformations from optical colours to [Fe/H]. For example, the new transformation of Kissler–Patig et al. (1998) converts a typical V–I = 1.05 to [Fe/H] = –1.07, where the old Galactic–based transformation would give [Fe/H] –0.5. The second effect is that the more accurate Galactic extinction values of Schlegel et al. (1998) tend to be larger on average by up to AV 0.1, than the traditionally-used Burstein & Heiles (1984) values. Thus extinction-corrected GC colours are now bluer than previously, and more metal–poor when transformed. If these two effects are taken into account, the two GC subpopulations in ellipticals have mean metallicities of [Fe/H] –1.5 and –0.5 which is similar to that of the M31 and Milky Way GC systems. Thus there appears to be very little difference between the mean metallicity of the two subpopulations in spirals and giant ellipticals.
The GC metallicity distributions for a wide range of Hubble types and luminosities is shown in Fig. 2 (including the ‘Local Group Elliptical’ – see Forbes et al. 2000). They are remarkably similar. All galaxies appear to possess a population of metal-poor ([Fe/H] –1.5) and presumably old GCs, while all bulge systems also have some metal-rich GCs ([Fe/H] –0.5). Hilker (this conference) confirms the bimodality in NGC 3311 with the same peaks.

There has been some debate over the years about the exact nature of the GC mean metallicity vs mass relation. To investigate this in more detail, we have created the largest sample to date of (37) early-type galaxies from the literature with bimodal GC colour distributions. This is therefore larger than the Forbes & Forte (2001), Brodie (this conference) or Kundu (this conference) samples. We also include M104, M31 and the Milky Way. We examine the correlation of colour (metallicity) with galaxy velocity dispersion (mass) in Fig. 3.
The Spearman rank correlation test finds that both the red and blue GCs are correlated with galaxy velocity dispersion with probabilities of 99.9% and 99.2% respectively. A least squares fit gives a positive slope for the red GCs at the 4 level and 2.5 for the blue GCs. The mean colors of the GC subpopulations in the three spirals are consistent with the best fit relation. We also show the galaxy color – velocity dispersion relation which has the same slope as for the red GCs.

The existence of a GC color (metallicity) – galaxy mass relation, indicates a common chemical enrichment history for the red GCs and the host galaxy (Forbes & Forte 2000). Additionally, this relation has a similar slope to the galaxy bulge metallicity–mass relation. Thus the red GCs and the galaxy (bulge) stars appear to have formed in the same star formation event with fairly similar ages and metallicities for both early and late type galaxies. The red GCs and bulges of spirals follow these same trends and hence a similar evolutionary history.
The situation for the blue GCs is not quite so clear. The slope and hence statistical significance of a relation between colour and mass is less than for the red GCs. If the slope is indeed zero, i.e. there exists a constant mean colour of about (V–I)o = 0.95, then it indicates that the blue GCs formed before the potential well of the galaxy did. This suggests a ‘pregalactic’ origin (Forbes, Brodie & Grillmair 1997). We note that the model of GC formation at cosmological reionization proposed by Cen (2001) predicts no strong correlation between blue GC mean colour (metallicity) and galaxy mass. Alternatively, a relation with galaxy mass would indicate that they formed in situ in the current potential well.
In terms of abundances, it appears that from the few GC spectra available GCs in ellipticals have normal, ie Galactic, abundance ratios. This implies [Mg/Fe] +0.3. These supersolar abundances suggest either a very short star formation timescale or an IMF that is skewed to high mass stars. It will be interesting to extend this work to GCs in low luminosity galaxies for which the field stars have lower [Mg/Fe] ratios (Terlevich & Forbes 2001). From the limited data available it seems that GCs in spirals and ellipticals have the same abundance ratios.
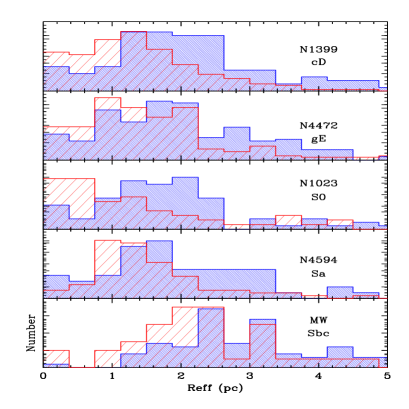
4. Sizes
An advantage of HST over ground-based telescopes for the study of GCs is the ability of HST to measure GC sizes. The largest study to date is that of Larsen et al. (2001). In Fig. 4 we show the effective radius for the blue and red GC subpopulations in a wide range of galaxies, i.e. from spiral to elliptical to cD galaxy. The figure shows that the general trend of the blue GCs being 20% larger than the red ones exists over this large range in Hubble types. What ever process is causing this difference (eg destruction on different orbits or initial conditions) it is doing so irrespective of the host galaxy.
5. Ages and Kinematics
Determining the ages, and to a lesser extent kinematics, of GCs is perhaps the key to discriminating between the different formation models. Although controversial it appears that the metal-rich GCs in our Galaxy may be 2 Gyrs younger than the metal-poor ones. Observations to date of GCs in ellipticals suggest that both subpopulations are old and possibly coeval – a difference of a few Gyrs can not be ruled out.
Kinematics from large numbers of GCs are now available for one elliptical (M49) and two cD galaxies (M87, NGC 1399). Kinematics also hold important clues about formation mechanisms, although we note that both the merger and multi-phase collapse scenarios would probably expect the blue GCs to show higher V/ than the red ones. See Bridges (this conference) for further details.
6. Concluding Remarks
In terms of the spatial distribution, numbers, chemical properties, and sizes the GCs in spirals and ellipticals are remarkably similar. It is perhaps too early to say about the ages and kinematics. However we should take seriously the possibility that GC systems formed in a similar way in all galaxies. We suggest the following formation timeline. About 15 Gyrs ago, GCs with [Fe/H] –1.5 formed in all galaxies. They are associated with galaxy halos. A few Gyrs later, metal-rich [Fe/H] –0.5 GCs form along with galaxy bulges in a clumpy gaseous collapse. This is the main epoch of galaxy field star formation (see Forbes, Brodie & Grillmair 1997 for more details). In addition, recent galaxy mergers form elliptical galaxies with moderate SN values (ie 3).
7. Acknowledgments
I thank my SAGES colleagues M. Beasley, J. Brodie, C. Grillmair, J. Huchra, M. Kissler-Patig, S. Larsen. Part of this research was funded by the Ian Potter Foundation and NSF grant AST 9900732.
References
Djorgovski, S., Santiago, B., 1992, ApJ, 391, L85
Burstein, D., Heiles, C., 1984, ApJS, 54, 33
Cen, R., 2001, astro-ph/0101197
Forbes, D. A., et al. 1996, AJ, 467, 126
Forbes, D. A., Brodie, J. P., Grillmair, C. J., 1997, AJ, 113, 1652
Forbes, D. A., et al. 2000, A&A, 358, 471
Forbes, D. A., Forte, J. C., 2001, MNRAS, 322, 257
Forbes, D. A., Brodie, J. P., Larsen, S. S., 2001, ApJ, submitted
Harris, W. E., 1991, ARA&A, 29, 543
Kissler-Patig, M., et al. 1998, AJ, 115, 105
Larsen, S. S., Forbes, D. A., Brodie, J. P., 2001, MNRAS, in press
Larsen, S. S., et al. 2001, AJ, in press
McLaughlin, D., 1999, AJ, 117, 2398
Minniti, D., 1995, AJ, 109, 1663
Schlegel, D. J., Finkbeiner, D. P., Davis, M., 1998, ApJ, 500, 525
Terlevich, A. I., Forbes, D. A., 2001, MNRAS, submitted