Excess Hard X-ray Emission from the Obscured Low Luminosity AGN In the Nearby Galaxy M 51 (NGC 5194)
We observed the nearby galaxy M 51 (NGC 5194) with BeppoSAX. The X-ray properties of the nucleus below 10 keV are almost the same as the ASCA results regarding the hard component and the neutral Fe K line, but the intensity is about half of the ASCA 1993 data. Beyond this, in the BeppoSAX PDS data, we detected a bright hard X-ray emission component which dominates above 10 keV. The 10 – 100 keV flux and luminosity of this component are respectively erg s-1 cm-2 and erg s-1. These are about 10 times higher than the extrapolation from the soft X-ray band, and similar to the flux observed with Ginga, which found a bright power law component in 2 – 20 keV band. Considering other wavelength properties and the X-ray luminosity, together with strong neutral Fe K line, the hard X-ray emission most likely arises from a low luminosity active nucleus, which is obscured with a column density of cm-2. This suggests that hidden low luminosity AGNs may well be present in other nearby galaxies. We interpret the discrepancy between Ginga and other X-ray satellites to be due to a large variability of absorption column density toward the line of sight over several years, suggesting that the Compton thick absorption material may be present on a spatial scale of a parsec. Apart from the nucleus, several ultra-luminous off-nuclear X-ray sources detected in M 51 exhibit long-term time variability, suggesting the state transition similar to that observed in Galactic black hole candidates.
Key Words.:
Galaxies:active – Galaxies:nuclei – Galaxies:individual:M 511 Introduction
M 51 is a face-on spiral galaxy, also known as the Whirlpool galaxy; it is located at a distance of 9.6 Mpc (Sandage & Tammann sandage (1975)). Optical studies of emission lines classified it as a LINER (Low Ionization Nuclear Emission Region) or a Seyfert 2 galaxy (Stauffer stauffer (1982); Filippenko & Sargent filippenko (1985); Ho et al. 1997b ). Furthermore, Ho et al. (1997c ) suggested the presence of a broad H line. Kohno et al. (kohno (1996)) found a nuclear molecular disk, and constrained the dynamical mass within 70 pc of the nucleus to be (4 – 7). This indicates that M 51 hosts as massive a black hole as many bright AGNs.
Observations in other wavelengths also strongly suggest the presence of an AGN in M 51, although previous X-ray observations of M 51 gave puzzling results. Einstein (Palumbo et al. palumbo (1985)) and ROSAT (Marston et al. marston (1995); Ehle et al. ehle (1995)) observations constrained the soft X-ray luminosity of the M 51 nucleus to be erg s-1. Ginga scanning observations in 1988 detected bright hard X-ray emission with erg/s (2 – 20 keV) with a photon index of (Makishima et al. makishima90 (1990)) and an intrinsic absorption of cm-2. Such hard nuclear X-ray emission is often considered to be evidence of Low Luminosity AGN (LLAGN), but it should have been detected with Einstein and ROSAT if the flux did not change significantly. After the Ginga observations, ASCA observed M 51 in the hard X-ray band (2 – 10 keV) in 1993, and did not detect such a bright hard component (Terashima et al. 1998a ). Instead, a faint hard X-ray continuum with a neutral Fe K line was detected, whose flux was an order of magnitude lower than that measured by Ginga. One possibility is that the difference between these observations is due to time variability with a large amplitude. Such a strong time variability is not often observed for low luminosity AGNs, and therefore is quite interesting if it is correct. The other possibility is a strong change of the intrinsic absorption. The key phenomenon that can help in resolving this mystery is the presence of a neutral Fe K line emission detected by ASCA (Terashima et al. 1998a ), which indicates that during the ASCA observations, the nucleus of M 51 was heavily obscured by Compton thick material below 10 keV, as found in some Seyfert 2 galaxies (e.g. Risaliti et al. risaliti99 (1999)). This idea can be confirmed by X-ray observations at energies above 10 keV.
Detection of an obscured hard X-ray emission from M 51 would suggest that many galaxies may harbor previously unknown hidden LLAGNs emitting below 10 keV. Moreover, such a detection can be valuable for a study of the physical structure of Compton thick absorbing material around AGNs. To further investigate such a possibility, we performed an X-ray observation of M 51 with BeppoSAX, sensitive to hard X-ray emission (Boella et al. 1997b ).
2 Observations and Data Reduction
We observed M 51 with BeppoSAX on Jan. 18–20, 2000. The three Narrow Field Instruments, LECS (Parmar et al. parmar (1997)), MECS2+3 (Boella et al. 1997b ), and PDS (Frontera et al. frontera (1997)) collected the data during the observation. We obtained the net exposures of 37 ks, 97 ks, and 45 ks, for LECS, MECS, and PDS, respectively. We utilized the cleaned and linearized data supplied by the BeppoSAX Science Data Center. The light curves, spectra, and images were reduced with the standard software, such as XSELECT and FTOOLS-4.2. Throughout this paper, the data of two MECS instruments were summed together. The cross-normalization constant between MECS and PDS is set to be 0.85 in this paper (Fiore et al. fiore99 (1999)).
In addition, we utilized ASCA (Tanaka et al. tanaka (1994)) archival data in order to investigate the time variability of the M 51 nucleus. ASCA observed M 51 twice, on May 11–13, 1993 and May 5–7, 1994. The results of ASCA 1993 observation were reported by Terashima et al. (1998a ). Ptak et al. (ptak (1999)) also performed the analysis of both 1993 and 1994 data, but they did not consider the contamination by the neighboring off-nuclear bright X-ray source. The screened data were obtained from the ASCA archival data center. In the data reduction, we imposed the selection criterion on the GIS data requiring that the rigidity is GeV c-1 (Ohashi et al. ohashi (1996); Makishima et al. makishima96 (1996)). The net GIS exposure is 35–38 ksec for both observations, but it was only 12 ksec for the SIS data in 1994 due to problems of the onboard data processing.
3 Image Analysis
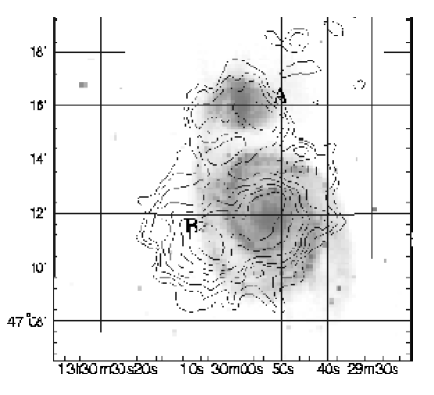
Before spectral analysis can be performed on the nuclear component, it is necessary to investigate X-ray images because M 51 is known to contain several non-nuclear X-ray sources. In Fig. 1, we show the X-ray images taken with the BeppoSAX MECS. The MECS image in the total band is overlaid on the optical image taken from SkyVIEW from NASA/GSFC. Three X-ray sources are clearly visible: the nucleus of M 51, a source in the companion galaxy NGC 5195 (source A), and a source to the east of the nucleus (source B). The nucleus is particularly bright in the 5.7 – 7.0 keV band, where a neutral Fe K line exists. Recently, Terashima et al. (terashima01 (2001)) confirmed that this source is resolved as a nuclear point source with Chandra. The source B is not the supernova SN1994I, since its position is different and the flux observed in ROSAT is quite low (Immler et al. immler (1998)).
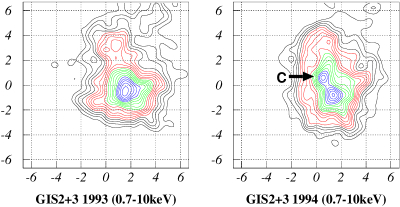
In Fig. 2, we show ASCA GIS images of M 51 taken in 1993 and 1994. The nucleus and the source A are always visible, in the ASCA 1993 and BeppoSAX 2000 observations. The source B is not seen in the ASCA GIS images, indicating the time variability of this source. On the other hand, the north-east X-ray source (source C) that was visible in the ASCA 1994 observation is not seen in the ASCA 1993 and BeppoSAX image.
Sources B and C are thought to correspond to the ROSAT PSPC point sources R3 and R1 in Marston et al. (marston (1995)), respectively. All the detected sources have X-ray luminosities in the range of erg s-1.
4 Spectral Analysis
4.1 BeppoSAX Spectra of the Nucleus
In order to investigate the spectrum of the nucleus, we extracted data from the imaging instruments onboard BeppoSAX corresponding to a radius of 2′ so that neighboring X-ray sources do not contaminate the spectra of the nuclear source. The background spectra were prepared using data from the same detector region, utilizing the standard background data set (Nov. 1998 for MECS, Dec. 1999 for LECS), and we subtracted them from the on-source spectra. In the spectral fitting, we used the standard response matrices released in September 1997.
In Fig. 3, we show the X-ray spectra of LECS and MECS. The data cannot be fit by a simple power law; they reveal both Fe-L and Fe K line features, but the Raymond-Smith thermal model (Raymond & Smith raymond (1977)) with the Galactic absorption of cm-2 (Stark et al. stark (1992)) does not fit the data either: the reduced chi-square is for both models. These spectral features are similar to the ASCA 1993 spectra. Thus, we fit the spectra with a model including Raymond-Smith thermal plasma plus a power law, and including an additional narrow line. The metal abundances are fixed to Solar with the Solar metal abundance ratios (Anders & Grevesse anders (1989)). Such a model was previously applied to the ASCA 1993 spectra (Terashima et al. 1998a ). The fit is acceptable as shown in Fig. 3 and Table 1. The power law photon index of is not well constrained, but it is consistent with the ASCA results. The Fe K line center energy is keV, indicating that it is due to fluorescence from the neutral iron, in agreement with the ASCA results. The equivalent width of the Fe K line is keV, which is within the error range of the 1993 ASCA results. The temperature of the Raymond-Smith plasma is keV. The flux and luminosity of the power law component are erg s-1 cm-2 and erg s-1, respectively in 2 – 10 keV band, about 30% of 1993 ASCA results. The strength of Fe K line is also smaller than that of 1993 ASCA value of c s-1 cm-2.
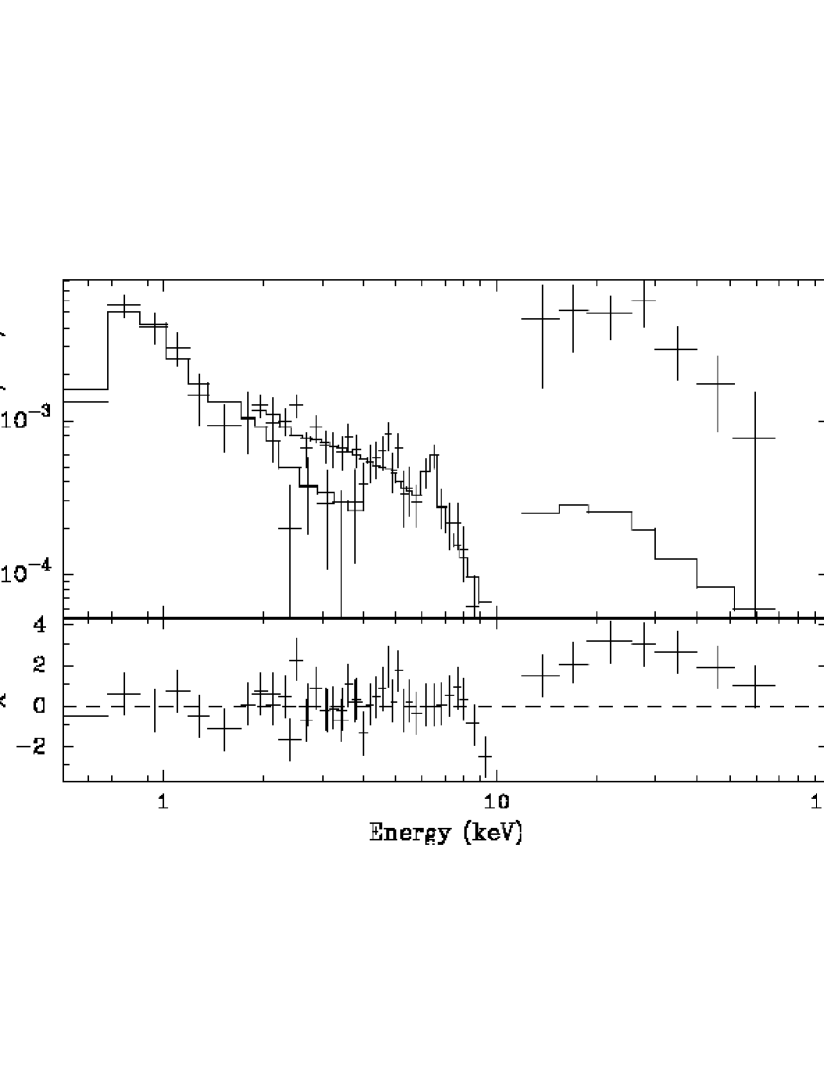
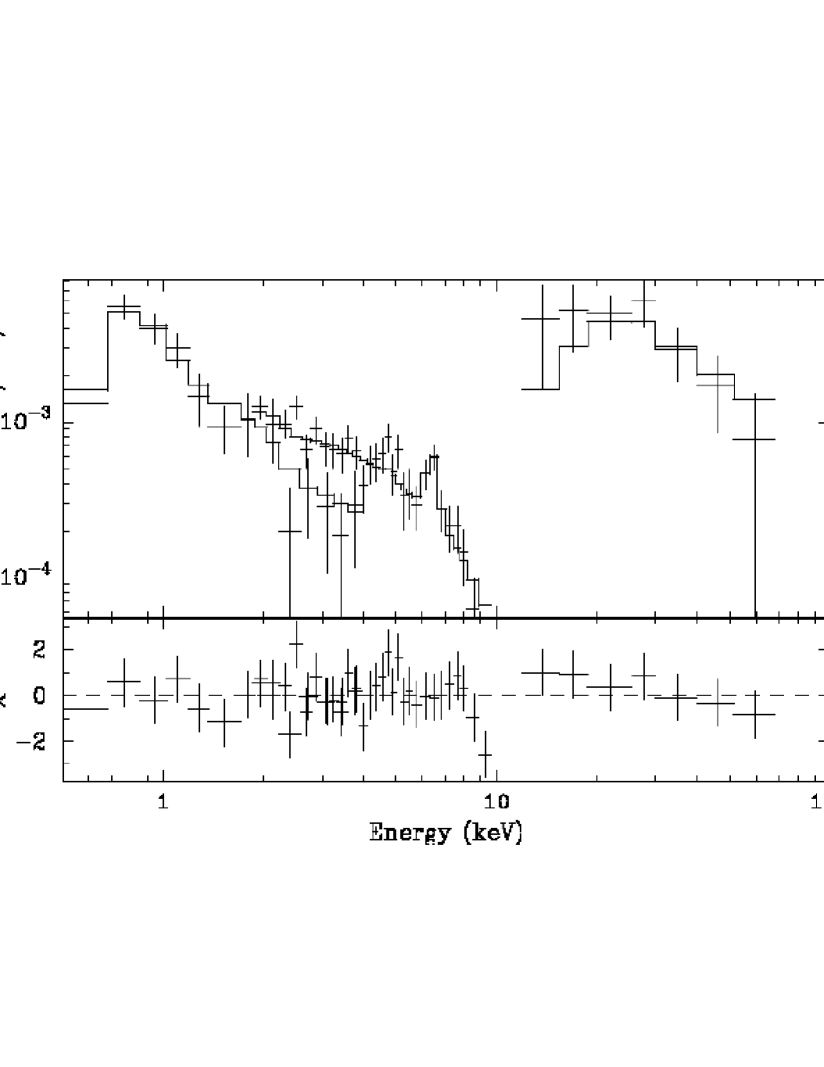
We conclude that the spectral properties below 10 keV measured in the BeppoSAX data are almost the same as the ASCA results except for the flux. To extend the bandpass beyond that of the imaging instruments (10 keV), we plot a PDS spectrum together with the LECS and MECS spectra in Fig. 4a. The solid line represents the best-fit model obtained by the LECS and MECS spectral analysis. It can be seen that the PDS flux is higher by a factor of compared with the extrapolation of the best-fit model of LECS and MECS, and significant photon flux is detected up to 50 keV. This spectral feature is quite similar to that seen in Compton-thick Seyfert 2 galaxies such as NGC 4945 (Done et al. done (1996)), Circinus Galaxy (Matt et al. matt99 (1999)), and Mrk 3 (Cappi et al. cappi (1999))
We add an absorbed power law component to represent this hard X-ray emission, and fit the LECS + MECS + PDS spectra simultaneously. The best-fit results are shown in Table 1 and Fig. 4b. The wide-band X-ray spectra require a hard X-ray component strongly absorbed by optically thick material with a column density cm-2. The best-fit parameters other than this newly included component do not change significantly. Since the photon index and absorption column density for the hard X-ray component are not well constrained separately (as they are correlated in spectral fits), to estimate the absorbing column we fixed the photon index at 1.9, typical for Seyfert 1 galaxies without a reflection component. Then, the absorption column density becomes cm-2, and the X-ray flux and luminosity are erg s-1 cm-2 and erg s-1, respectively in 10 – 100 keV band. The absorption – corrected X-ray flux is erg s-1 cm-2 in 2 – 20 keV band, similar to the Ginga results, and erg s-1 cm-2 in 2 – 10 keV which should be easily detected with ASCA if no absorption was present. When we fit only the PDS spectrum with an absorbed power law model by fixing the power law photon index to be 1.9, we obtained only the upper limit of cm-2. This is most likely because the model adopted by us, with a luminous but heavily absorbed hard component plus a soft component, has an apparent absorption feature located in the energy band between MECS and PDS. To investigate a possible presence of a Compton reflection component, we include it by fitting the data to the spectral model “pexrav” as implemented in XSPEC; with this, the reflection fraction becomes 18%.
| norm | norms | normg | normh | /dof | |||||
| (keV) | (cm-5) | (keV) | cm-2 | ||||||
| LECS + MECS | ABSs*POh | ||||||||
| 2.19 | |||||||||
| LECS + MECS | ABSs*(RS+POs+GA) | ||||||||
| 1.18 | |||||||||
| LECS + MECS + PDS | ABSs*(RS+POs+GA+ABSh*POh) | ||||||||
| 10 | — | 1.14 | |||||||
| LECS + MECS + PDS | ABSs*(RS+POs+GA+ABSh*POh) | ||||||||
| 5.8 | 1.9 fix | 1.21 | |||||||
| ABSs and ABSh: Photoelectric absorption of the Galactic and intrinsic material, RS: Raymond-Smith thermal model, POs and POh: Power law model, GA: Gaussian line. | |||||||||
| : Parameters of a gaussian model. | |||||||||
| The unit of normalizations (norm) of power law and gaussian is c s-1 cm-2 keV-1 at 1 keV and c s-1 cm-2, respectively. | |||||||||
4.2 ASCA spectra of the Nucleus
Since the result of the 1993 ASCA observation are reported in Terashima et al. (1998a ), we here show the result of the 1994 observation. Since the exposure time of the SIS is short, we created only the GIS spectrum. The source C is located at from the nucleus. Thus we created spectra using counts detected only within 1.5′ of the nucleus, where the source C may contaminate the nuclear spectrum by 20%. The spectral model used for the fits of the ASCA data is the same as that for LECS and MECS spectra: Raymond-Smith plasma, plus power law, and one emission line. The normalizations of thermal and power law components are left free, but the other model parameters are fixed to the values measured in the 1993 observation, due to the poor quality of 1994 data.
The spectrum and best-fit model are shown in Fig. 5, which tells us that the overall property of the spectrum apart from the normalization is almost the same as that of ASCA 1993 data and BeppoSAX data. The X-ray flux of the power law component is erg s-1 cm-2 in 2 – 10 keV band, about 30% of that measured in the 1993 data and almost the same as BeppoSAX data. The details of the Fe K line are ambiguous due to the small extraction area. . In order to constrain the Fe K line strength better, we extended the integration radius to 3.75′. Taking into account that about 45% of photons in this spectrum come from the source C, we obtain an upper limit on the Fe K line strength of photons s-1 cm-2, significantly smaller than that measured in the 1993 ASCA data.
4.3 Time Variability of the Nucleus
We investigate the short time variability properties of the hard component of the nucleus. We make light curves in the 3 – 10 keV band (MECS) and 10 – 100 keV band (PDS). The MECS light curve shows a counting rate from the region within 2′ of the nucleus without background subtraction, since the count rate of the background is only 25%. The PDS light curve is created after background subtraction. We do not find any significant short-term time variability in either light curve.
In Fig. 6, we show the long-term time variability of the X-ray flux of the power law component in the 2 – 10 keV band and absorption-corrected 2 – 20 keV band. The X-ray flux in 2 – 10 keV band represents the scattered component of the nuclear emission, and in 1994, it drops to 30% of the 1993 value. Its flux in the 2000 BeppoSAX data is almost the same as that of 1994 ASCA observation. The absorption-corrected flux in 2 – 20 keV of Ginga and BeppoSAX PDS corresponds to the direct nuclear emission. Nominally the 2000 BeppoSAX flux is twice the 1988 Ginga value, but the errors are large, and these fluxes are consistent with the values being the same. The Fe line equivalent width is constant within the error range as described in §4.2.
4.4 Off-nuclear X-ray Sources
M 51 includes several off-nuclear point-like sources. The typical X-ray luminosity of the brightest X-ray sources is erg s-1, much higher than the Eddington limit for accreting neutron stars. In the ASCA and BeppoSAX observations, three off-nuclear sources were visible (Figs. 1 and 2). The source A is associated with NGC 5195, and its flux appears constant. The other two sources (B and C) are located in the spiral arms. They exhibit strong time variability, and are visible when they become as bright as the nucleus.
The source B shows a large time variability in 2000 as shown in Fig. 7, where the count rate in the second half of the observation decreases to 50% of that measured in the first half. This is the third example of short-term time variability of the off-nuclear ultra-luminous X-ray sources, after those in IC342 (Okada et al. okada (1998); Kubota et al. kubota (2001)) and M82 (Matsumoto et al. matsumoto (1999)). The spectra of the sources A and B are determined from the counts collected within 2′ of their position. For the source A, we prepared the spectra using the ASCA 1993 data and the BeppoSAX data. We do not use the ASCA 1994 data because the GIS instrument cannot resolve the source A clearly (see Fig. 2). The source B is only visible in the BeppoSAX data, and its count rate varies significantly. We thus analyzed two MECS spectra; one is integrated in the bright phase (0 – 110,000 sec in Fig. 7), and the other is in the faint phase (110,000 – 190,000 sec in Fig. 7).
The X-ray spectra of these ultra-luminous off-nuclear X-ray sources are known to be generally described by multi-color disk black body (MCD: Mitsuda et al. mitsuda (1984); Makishima et al. makishima86 (1986); Mizuno et al. mizuno99 (1999); Makishima et al. makishima00 (2000); Kotoku et al. kotoku (2001)), and thus we try to fit the spectra by a power law model and MCD model. The spectrum of source A is almost the same between the 1993 ASCA and BeppoSAX observations, and thus we fitted both data sets simultaneously. We performed spectral fittings with the energy band above 2 keV, to avoid the uncertainty of the diffuse thermal emission due to the different angular resolution among instruments. Instead, we include the Raymond-Smith thermal model to represent the diffuse emission. Its temperature cannot be well determined, and thus we fixed the temperature of Raymond-Smith model to 0.39 and 0.35 keV for source A and B, respectively, based on the spectral fitting of the ASCA SIS data around each source. Since we are interested in the hard component rather than soft thermal emission, we performed the spectral fitting above 2 keV. The results are summarized in Table 2 and Fig. 8.
The limited photon statistics does not allow us to distinguish between these two models for both sources. The inner disk temperature of MCD model for the source A, 1.5 – 2.2 keV, is typical for ultra-luminous off-nuclear X-ray sources in other galaxies. The luminosity of the MCD component in the 2 – 10 keV band is erg s-1 for source A. For the source B, the spectrum in the high flux period seems to be harder than that in the low flux period; the power law photon index or the temperature of the MCD model is significantly different. We expect a constant radius of the MCD model despite different temperatures, but that cannot be tested due to the poor data quality. The luminosities of the MCD component in the 2 – 10 keV band of the source B are erg s-1 and erg s-1 for the bright and faint state, respectively.
In order to study the long-term time variability of these sources, we utilized the archival ROSAT HRI data from HEASARC (NASA/GSFC High Energy Astrophysics Science Archive Research Center) and the paper of Ehle et al. (ehle (1995)). We cannot resolve the source A clearly in the HRI images, and thus the source A may be an assembly of discrete sources in NGC 5195. The constant flux is consistent with this scenario. The flux histories for the sources B and C are summarized in Table 3. These are typically in the range of (0 – 3) erg cm-2 s-1, at a level comparable to the ASCA and BeppoSAX measurements. The source B varies by a factor of 2, while the variability of the source C is quite strong, by a factor of 5.
| normr | normp | normd | /dof | |||
| (keV) | (cm-5) | (keV) | ||||
| Source A: GIS + SIS + LECS + MECS | ||||||
| Power law Model | ||||||
| 0.39 Fix | 1.01 | |||||
| MCD Model | ||||||
| 0.39 Fix | 1.00 | |||||
| Source B bright phase: LECS + MECS | ||||||
| Power law Model | ||||||
| 0.35 Fix | 1.04 | |||||
| MCD Model | ||||||
| 0.35 Fix | 1.12 | |||||
| Source B faint phase: LECS + MECS | ||||||
| Power law Model | ||||||
| 0.35 Fix | 0.39 | |||||
| MCD Model | ||||||
| 0.35 Fix | 0.51 | |||||
| : parameters of Raymond-Smith model | ||||||
| : parameters of Power law model | ||||||
| : parameters of MCD model | ||||||
| The unit of normp is c s-1 cm-2 keV-1 at 1 keV. | ||||||
| The normd represents where and are an inner radius and an inclination angle of the disk, respectively, and is a distance to the source. | ||||||
| Time | 1991.12.07 | 1992.01.08 | 1994.05.22 – 23 | 1994.06.18 – 24 | 1997.12.26 – 30 |
| 1992.05.22 – 25 | |||||
| 1992.06.05 | |||||
| exposure | 16097s | 10411s | 9392s | 36343s | 8104s |
| B | 1.5 | 1.2 | 1.8 | 2.1 | 0.9 |
| C | 2.2 | 1.0 | 2.4 | 1.7 | 0.4 |
| The unit is erg s-1 cm-2. The conversion from counts to source flux density is erg cm-2 count-1, from Ehle et al. (ehle (1995)). The data in 1992 are quoted from Ehle et al. (ehle (1995)). | |||||
5 Discussion
5.1 Bright Hard X-ray Emission
In our observations of M 51 with BeppoSAX, we detected in the PDS data bright hard X-ray emission above 10 keV, which we interpret as associated with an active nucleus present in the galaxy. This inference is supported by the fact that in the MECS data we detect a neutral Fe K line emission from the central point-like source, and such emission is consistent with the ASCA observations. The flux above 10 keV is about 10 times higher than the extrapolation of the nuclear flux detected by the MECS below 10 keV. Considering these spectral features, we infer that M 51 harbors a heavily obscured Seyfert 2 type nucleus, with the column density cm-2
The X-ray luminosity of this hard component is erg s-1 in the 10 – 100 keV band, and thus M 51 is probably the first low-luminosity Compton thick Seyfert 2 AGN. The existence of AGN with X-ray luminosity of erg s-1 is reasonable, according to the prediction from the correlation of H and X-ray luminosity in Seyfert 1 galaxies (Ward et al. ward (1988)), and the correlation of [OIII] and X-ray luminosity of Seyfert galaxies (Mulchaey et al. mulchaey (1994)), based on the M 51 value of erg s-1. Moreover, the presence of an obscured nucleus in M 51 is suggested by a dense molecular disk with cm-2 detected around the nucleus by HCN and CO observations (Kohno et al. kohno (1996)).
Nevertheless, we cannot completely rule out the possibility that the PDS spectrum is contaminated by bright hard sources, because the absorption is ambiguous if one considers the PDS spectrum alone. However, there are several observational results which support the above conclusion. The Ginga observation – using the scanning mode, and thus allowing good positional accuracy – indicated that the bright hard X-ray emission indeed comes from the M 51 nucleus (Makishima et al. makishima90 (1990)). Since the hard X-ray flux is similar between the Ginga LAC and the BeppoSAX PDS, the hard emission detected from the PDS is also likely to come from M 51. In addition, there are no other bright X-ray point sources with a flux erg s-1 cm-2 (0.1 – 2 keV) within 2 degrees of the M 51 nucleus in the ROSAT PSPC image. Consequently, we conclude that the hard X-ray emission detected in the PDS is associated with the nucleus of M 51. Then, M 51 is found to be one of the brightest low luminosity AGNs in the sky above the 10 keV band, together with M 81 and NGC 4258 (Pellegrini et al. pellegrini (2000); Fiore et al. fiore (2001)). It is interesting that these two objects are not Compton thick, unlike M51.
There still remains a difference between the Ginga and other satellite observations; the X-ray flux below 10 keV obtained with Ginga was higher than that measured by other instruments by a factor of more than 20, and the X-ray spectrum obtained with Ginga exhibited no absorption features. One possibility is the change of the column density of the absorbing material in the line of sight; the absorption happened to be weak in the Ginga observation. Such a case is in fact observed for the famous Seyfert galaxy NGC 4051 (Uttley et al. uttley (1999)), and for NGC 1365 (Risaliti et al. risaliti00 (2000)) with BeppoSAX, and thus such a behavior is not unique to M 51. Another scenario would have a large change in the soft ( keV) flux, by a factor of more than 20. However, the X-ray flux above 10 keV band is almost the same between the Ginga and BeppoSAX observation epochs, and in addition agrees with the prediction from and , suggesting that the former explanation is more likely.
5.2 A Neutral Fe K line and Reflected Continuum
BeppoSAX detected neutral Fe K lines from the M 51 nucleus, confirming the previous ASCA detection (Terashima et al. 1998a ). This line is likely to arise via fluorescence from neutral material. The equivalent width of the Fe K line, keV is consistent with the ASCA 1993 result (Terashima et al. 1998a ). The equivalent width of the Fe K line can be explained as arising via reflection by the reprocessing material covering around the nucleus with Solar metal abundances. Other well-known examples of objects indicating such geometry are NGC 6552 (Fukazawa et al. fukazawa (1994)) and Circinus Galaxy (Matt et al. matt96 (1996)).
A natural association of the Fe K line would be with the dense, neutral material present around the nucleus; such material is most likely responsible for the Compton reflection component, seen in many Seyfert 1 galaxies. We investigated how strong of such reflection component is in the BeppoSAX data, but obtained a small upper limit corresponding to a solid angle subtended by the reflector of 18% of 2. If the material responsible for the Fe K line and the Compton reflection were to be the same, this value seems to be in contradiction with the Fe K equivalent width. A more likely scenario is that the Fe K line is produced in a Compton-thick region in transmission. In fact, the equivalent width of the Fe K line can be reproduced by such a situation with a column density of cm2, covering factor of , and a Solar Fe abundance (Makishima makishima86a (1986)).
5.3 Time variability
The bright hard component that was detected with Ginga and BeppoSAX, presumably due to direct nuclear emission, has almost constant flux during the BeppoSAX observation. Such a trend of a weak time variability is similar to that seen in other LLAGNs (Ishisaki et al. ishisaki (1996); Iyomoto et al. iyomoto96 (1996), iyomoto00 (2001); Iyomoto iyomoto99 (1999); Reynolds et al. reynolds (2000)), and is not consistent with the trend seen in Seyfert galaxies (Nandra et al. nandra (1997); Hayashida et al. hayashida (1998)). We note that a scenario involving an advection dominated accretion flow (ADAF) is consistent with such a behavior, but any more detailed discussion of the applicability of ADAFs to LLAGN is beyond the scope of this paper (but see, e.g., Lasota et al. lasota (1996)).
On the other hand, we detected time variability of two quantities: the weak hard X-ray emission below 10 keV, and the absorption column density for direct nuclear emission. These are indicative of a change of conditions of the material surrounding the nucleus. The former, which is thought to be a scattered or reflected nuclear component, exhibits a long time variability, by a factor of 2 – 3 on a time scale of years, through ASCA and BeppoSAX observations (Fig. 7). The strength of the Fe K line also varied simultaneously with the continuum by almost the same factor. Regarding the latter, we measure the intrinsic absorption column density changes by a factor of within several years between the Ginga and ASCA observations. These indicate that the Compton-thick absorption material has a spatial scale (meaning the size and/or a distance from the nucleus) of a parsec. Such a parsec – scale torus material is also suggested by other observations (Greenhill et al. greenhill (1996); Gallimore et al. gallimore (1997); Siebenmorgen et al. siebenmorgen (1997); Matt matt00 (2000)). Further variability studies of direct nuclear emission on shorter time scales at energies above 10 keV, such as with INTEGRAL and Astro-EII HXD, are necessary to characterize the dimensions of this component in more detail.
5.4 Obscured Low Luminosity AGNs
ASCA survey showed that LINER galaxies often exhibit hard X-ray emission with X-ray luminosity of erg/s (2-10 keV) and power law spectra with photon indices of 1.7 (Makishima et al. makishima94 (1994); Ishisaki et al. ishisaki (1996); Iyomoto et al. iyomoto96 (1996); iyomoto97 (1997); iyomoto98 (1998); Terashima et al. 1998a ; 1998b ; terashima00 (2000)). However, there are LINERs which do not show a significant excess of hard X-ray emission below 10 keV. Interestingly, ASCA results show that some LLAGNs also exhibit an intrinsic absorption of cm-2 which is comparable to Compton-thin Seyfert 2 galaxies. Furthermore, ASCA found two LLAGNs, M 51 and NGC 1365 (Terashima et al. 1998a ; Iyomoto et al. iyomoto97 (1997)), which exhibit a flat hard X-ray component with a strong neutral Fe K line, and thus these are good candidates for the low luminosity Compton-thick Seyfert 2 galaxies. In this context, our BeppoSAX observations confirm M 51 as a Compton-thick LLAGN. These results suggest that the distribution of the absorption column density of LLAGNs may be similar to that of Seyfert galaxies, and thus a significant fraction of LINERs may be also completely obscured below 10 keV, as is the case for Seyfert galaxies. LLAGNs are thought to be quite numerous because LINERs are quite numerous (Keel keel (1983); Ho et al. 1997a ). With this, future X-ray observations of LINER galaxies may reveal many LLAGNs in galaxies that are considered otherwise “normal.” Understanding the relationship between LINERs and LLAGN is likely to be an important step in understanding the link between evolution of normal and active galaxies.
5.5 Ultra-Luminous Off-nuclear X-ray Sources
M 51 contains several ultra-luminous off-nuclear X-ray sources found with Einstein and ROSAT (Palumbo et al. palumbo (1985); Marston et al. marston (1995); Ehle et al. ehle (1995)). ASCA and BeppoSAX observations resolved three of them, and all three exhibit time variability of a factor of . The X-ray luminosity measured in those sources – erg s-1 – cannot be explained by neutron star binaries, as the Eddington limit for those is erg s-1. The X-ray spectra for two of them can be fitted with power law or disk blackbody models. This spectral shape is similar to that seen in other ultra-luminous off-nuclear X-ray sources in other galaxies (Mizuno et al. mizuno99 (1999); Makishima et al. makishima00 (2000); Mizuno mizuno00 (2000)). These bright X-ray sources in nearby galaxies are postulated to be black hole binaries, where spectra (and in particular, the disk black body temperature and normalization) imply Kerr black holes with masses 100 (Mizuno et al. mizuno99 (1999); Makishima et al. makishima00 (2000); Mizuno mizuno00 (2000)). We suggest that the bright, off-nuclear X-ray sources in M 51 detected with ASCA and BeppoSAX are objects of the same type. The strong variability of these sources is similar to that often observed in the Galactic black hole candidates. Since their X-ray spectra were obtained only in their bright states, it would be quite interesting to know what are the X-ray spectra in their faint states, and in particular, whether they exhibit hard power law spectra in their faint states, similar to the Galactic black hole candidates. So far, two ultra-luminous off nuclear X-ray sources in IC342 exhibited such a spectral transition (Kubota et al. kubota (2001)), suggesting that these are black-hole binaries. Since it contains relatively many ultra-luminous off-nuclear X-ray sources, M 51 is an interesting target for repeated observations by Chandra and XMM-Newton to study such sources.
We are grateful to Prof. Greg Madejski for correction of the English in the manuscript. The authors also thank the anonymous referee for careful reading and helpful comments, and thank as well operation and calibration teams of BeppoSAX and ASCA.
References
- (1) Anders E., & Grevesse N., 1989, Geochim. Cosmochim. Acta. 53, 197
- (2) Boella G., Butler R., Perola G.C., et al., 1997a, A&AS 112, 299
- (3) Boella G., Chiappetti L., Conti G., et al., 1997b, A&AS 112, 372
- (4) Cappi M., Bassani L., Comastri A., et al., 1999, A&A 344, 857
- (5) Done C., Madejski G. M., & Smith D. A., 1996, ApJ 463, L63
- (6) Ehle M., Pietsch W., & Beck R., 1995, A&A 295, 289
- (7) Filippenko A. V., & Sargent W. L. W., 1985, ApJS 57, 503
- (8) Fiore F., Guainazzi M., & Grandi P., 1999, Cookbook for BeppoSAX NFI Spectral Analysis
- (9) Fiore F., Pellegrini S., Matt G., et al., 2001, astro-ph/0102438
- (10) Frontera F., Costa E., Dal Fiume D., et al., 1997, A&AS 112, 357
- (11) Fukazawa Y., Makishima K., Ebisawa K., et al., 1994, PASJ 46, L141
- (12) Gallimore J. F., Baum S. A., & O’Dea C. P., 1997, Nature 388, 852
- (13) Greenhill L. J., Gwinn C. R., Antonucci R., Barvainis R., 1996, ApJ 472, L21
- (14) Hayashida K., Miyamoto S., Kitamoto S., et al., 1998, ApJ 500, 642
- (15) Ho L. C., Filippenko A. V., & Sargent W. L. W., 1997a, ApJ 487, 568
- (16) Ho L. C., Filippenko A. V., & Sargent W. L. W., 1997b, ApJS 112, 315
- (17) Ho L. C., Filippenko A. V., Sargent W. L. W., Peng C. Y., 1997c, ApJS 112, 391
- (18) Immler S., Pietsch W., & Aschenbach B., 1998, A&A 336, L1
- (19) Ishisaki Y., Makishima K., Iyomoto N., et al., 1996, PASJ 48, 237
- (20) Iyomoto N., Makishima K., Fukazawa Y., et al., 1996, PASJ 48, 231
- (21) Iyomoto N., Makishima K., Fukazawa Y., et al., 1997, PASJ 49, 425
- (22) Iyomoto N., Makishima K., Matsushita K., et al., 1998, ApJ 503, 168
- (23) Iyomoto N., 1999, Ph-D thesis, University of Tokyo
- (24) Iyomoto N., & Makishima K., 2001, MNRAS 321, 767
- (25) Keel W.C., 1983, ApJ 269, 466
- (26) Kohno K., Kawabe R., Tosaki T., Okumura S. K., 1996, ApJ 461, L29
- (27) Kotoku J., Mizuno T., Kubota A., Makishima K., 2001, PASJ 52, 1081
- (28) Kubota A., Mizuno T., Makishima K., et al., 2001, ApJ 547, L119
- (29) Lasota J.-P., Abramowicz M. A., Chen X., et al., 1996, ApJ, 462, 142
- (30) Maiolino R., Krabbe A., Thatte N., Genzel R., 1998, ApJ 493, 650
- (31) Makishima K., 1986, “The Physics of Accretion onto Compact Objects”, Lecture Notes in Physics, Vol. 266, edited K.P. Mason, M.G. Watson, and N.E. White. Springer-Verlag, Berlin Heidelberg New York, p.249
- (32) Makishima K., Maejima Y., Mitsuda K., et al., 1986, ApJ 308, 635
- (33) Makishima K., Ohashi T., Kondo H., et al., 1990, ApJ 365, 159
- (34) Makishima K., Fujimoto R., Ishisaki Y., et al., 1994, PASJ 46, L77
- (35) Makishima K. Tashiro M., Ebisawa K., et al., 1996, PASJ, 48, 171
- (36) Makishima K., Kubota A., Mizuno T., et al., 2000, ApJ 535, 632
- (37) Marston A. P., Elmegreen D., Elmegreen B., et al., 1995, ApJ 438, 663
- (38) Matsumoto H., & Tsuru T. G., 1999, PASJ 51, 321
- (39) Matt G., Fiore F., Perola G. C., et al., 1996, MNRAS 281, L69
- (40) Matt G., Guainazzi M., Maiolino R., et al., 1999, A&A 341, L39
- (41) Matt G., 2000, A&A 35, L31
- (42) Mitsuda K., Inoue H., Koyama K., et al., 1984, PASJ 36, 741
- (43) Mizuno T., Ohnishi T., Kubota A., et al., 1999, PASJ 51, 663
- (44) Mizuno T., 2000, Ph-D thesis, University of Tokyo
- (45) Mulchaey J. S., Koratkar A., Ward M. J., et al., 1994, ApJ 436, 586
- (46) Nandra K., George I. M., Mushotzky R. F., et al., 1997, ApJ 477, 602
- (47) Ohashi T. Ebisawa K., Fukazawa Y., et al., 1996, PASJ, 48, 157
- (48) Okada K., Dotani T., Makishima K., et al., 1998, PASJ 50, 25
- (49) Palumbo G. G. C., Fabbiano G., Trinchieri G., Fransson C., 1985, ApJ 298, 259
- (50) Parmar A. N., Martin D. D. E., Bavdaz M., et al., 1997, A&AS 112, 309
- (51) Pellegrini S., Cappi M., Bassani L., et al., 2000, A&A 353, 457
- (52) Ptak A., Serlemitsos P., Yaqoob T., Mushotzky R. F., 1999, ApJS 120, 179
- (53) Raymond J. C., & Smith B. W., 1977, ApJS 35, 419
- (54) Reynolds C. S., Nowak M. A., & Maloney P. R., 2000, ApJ 540, 143
- (55) Risaliti G., Maiolino R., & Salvati M., 1999, ApJ 522, 157
- (56) Risaliti G., Maiolino R., & Bassani L., 2000, A&A 356, 33
- (57) Sandage A., & Tammann G. A., 1975, ApJ 196, 313
- (58) Siebenmorgen R., Moorwood A., Freudling W., et al., 1997, A&A 325, 450
- (59) Stark A. A., Gammie C. F., Wilson R. W., et al., 1992, ApJS 79, 77
- (60) Stauffer J. R., 1982, ApJ 262, 66
- (61) Tanaka Y., Inoue H., & Holt S. S., 1994, PASJ 46, L37
- (62) Terashima Y., Ptak A., Fujimoto R., et al., 1998a, ApJ 496, 210
- (63) Terashima Y., Kunieda H., Misaki K., et al., 1998b, ApJ 503, 212
- (64) Terashima Y., Ho L. C., & Ptak A. F., 2000, ApJ 539, 161
- (65) Terashima Y., & Wilson A. S., 2001, astro-ph/0103287
- (66) Uttley P., McHardy I. M., Papadakis I. E., et al., 1999, MNRAS 307, L6
- (67) Ward M. J., Done C., Fabian A. C., et al., 1988, ApJ 324, 767