On the MBM12 Young Association
Abstract
I present a comprehensive study of the MBM12 young association (MBM12A). By combining infrared (IR) photometry from the Two-Micron All-Sky Survey (2MASS) survey with new optical imaging and spectroscopy, I have performed a census of the MBM12A membership that is complete to 0.03 () for a field encompassing the MBM12 cloud. I find five new members with masses of 0.1-0.4 and a few additional candidates that have not been observed spectroscopically. From an analysis of optical and IR photometry for stars in the direction of MBM12, I identify M dwarfs in the foreground and background of the cloud. By comparing the magnitudes of these stars to those of local field dwarfs, I arrive at a distance modulus (275 pc) to the MBM12 cloud; it is not the nearest molecular cloud and is not inside the local bubble of hot ionized gas as had been implied by previous distance estimates of 50-100 pc. I have also used Li strengths and H-R diagrams to constrain the absolute and relative ages of MBM12A and other young populations; these data indicate ages of Myr for MBM12A and Myr for the TW Hya and Cha associations. MBM12A may be a slightly evolved version of the aggregates of young stars within the Taurus dark clouds ( Myr) near the age of the IC 348 cluster ( Myr).
1 Introduction
Young nearby stellar populations offer unique advantages in the study of star and planet formation. Because of the youth and proximity of the members of these regions, substellar companions and circumstellar material are bright and can be observed at small separations and high spatial resolution. In particular, associations at ages of 1 to 10 Myr within 100 pc should contain the brightest brown dwarfs in the sky and giant planets that are emerging from their natal disks.
The nearest star forming regions and young open clusters are at distances of pc, which have been identified by their associated molecular clouds, infrared (IR) excess emission, and compact and rich populations. At closer distances, associations with small memberships and ages of Myr are less conspicuous and can go unnoticed. Recently, data from the Hipparcos and ROSAT missions have been used in searching for members of previously undiscovered nearby associations. These observations have revealed four populations at ages of 10-30 Myr and distances of 50-100 pc, namely the TW Hya (TWA) (Kastner et al. 1997; Webb et al. 1999; Zuckerman et al. 2001), Chamaeleonits (Mamajek et al. 1999), Horologium (HorA) (Torres et al. 2000), and Tucana associations (Zuckerman & Webb 2000). The group of T Tauri stars projected against cloud 12 from Magnani, Blitz, & Mundy (1985) (MBM12) has been suggested as an additional young association within 100 pc, and is the subject of this study.
From distance estimates of 60-70 pc (Hobbs, Blitz, & Magnani 1986) and 53-102 pc (Hearty et al. 2000a), the MBM12 cloud, also known as L1453, L1454, L1457, and L1458 from Lynds (1962), is believed to be the nearest molecular cloud. The line-of-sight extinctions through the cloud are typically -5 and can reach as high as in a few locations (Zuckerman et al. 1992; Hearty et al. 2000b, hereafter H00b), placing it near the boundary between translucent and dark clouds (, van Dishoeck & Black 1988). Surveys in H and X-rays have identified seven young stars near the MBM12 cloud (Herbig & Rao 1972; Stephenson 1986; Downes & Keyes 1988; Herbig & Bell 1988; Fleming, Gioia, & Maccacaro 1989; Martín et al. 1994; Fernández et al. 1995; Magnani et al. 1995; H00b). An additional X-ray source in the vicinity of the MBM12 cloud, RXJ0306.5+1921, was proposed as young member of MBM12A by H00b, but it is probably an older object that is not related to these T Tauri stars, as shown in this work. Based on the strengths of Li absorption and H and mid-IR emission and the presence of the parent molecular cloud, the group of stars towards MBM12 is believed to be younger than TWA and Cha ( Myr) with an age of a few million years (H00b; Jayawardhana et al. 2001).
In this paper, I present the results of a magnitude-limited search for new members of the MBM12 association (MBM12A) that is complete to 0.03 . Following the methods of similar searches in Taurus by Briceño et al. (1998) and Luhman (2000), I combine and images of the dark cloud with IR photometry from the Two-Micron All-Sky Survey (2MASS) and select candidate members for spectroscopy, from which five new members are found. In addition, I revise the distance to MBM12A, use Li data and the Hertzsprung-Russell (H-R) diagram to estimate the absolute and relative ages of this and other young associations, and discuss the disk properties of stars in MBM12A.
2 Observations and Data Analysis
2.1 Photometry
Images of the MBM12 cloud were obtained with the four shooter camera at the Fred Lawrence Whipple Observatory 1.2 m telescope on 2000 October 24-26. The instrument contained four CCDs separated by and arranged in a grid. After binning during readout, the plate scale was pixel-1. The survey area for MBM12 was divided into a grid in right ascension and declination where the grid cells were separated by . At each grid cell, two positions separated by in right ascension and declination were observed. At each position, images were obtained with exposure times of 15 and 450 s at and 10 and 300 s at . The images were bias subtracted, divided by dome flats, registered, and combined into one image at each band and exposure time. Stars in overlapping regions of the frames were used to scale all images to the frames that were known to be photometric. Photometry and image coordinates of the sources in these data were measured with DAOFIND and PHOT under the IRAF package APPHOT. For most stars, aperture photometry was extracted with a radius of four pixels. Smaller apertures were used for closely spaced stars. The background level was measured in an annulus around each source and subtracted from the photometry, where the inner radius of the annulus was five pixels and the width was one pixel. The photometry was calibrated in the Cousins system through observations of standards across a range of colors (Landolt 1992). Saturation in the short exposures occurred at -12 and -11.5. The completeness limits of the long exposures were and . Typical photometric uncertainties (1 ) are 0.04 mag at and and 0.1 mag at and . The plate solution was derived from coordinates of sources observed in the 2MASS Spring 1999 Release Point Source Catalog that appeared in the optical images and were not saturated.
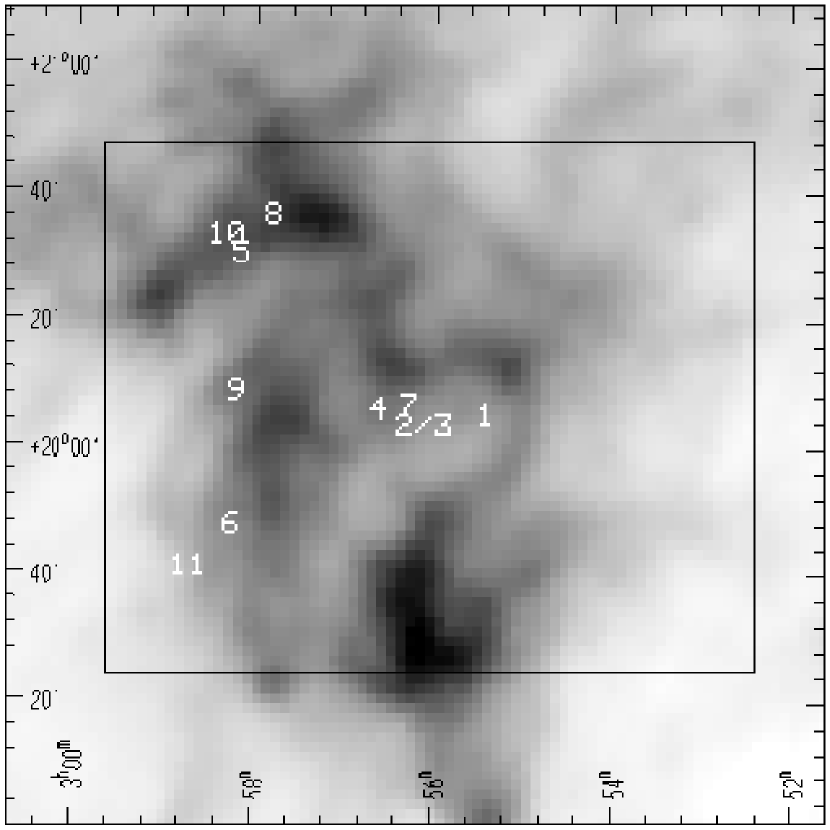
The boundaries of the rectangular field from which photometry was extracted are , and , (J2000). This region is indicated in Figure 1. Out of 4661 2MASS sources within this field, 50 objects were not measured in the optical data because they fell within gaps between the detectors or were contaminated by bad pixels; these 2MASS sources are excluded from the study. In addition, 5 known asteroids that were flagged in the 2MASS database were rejected, leaving a total of 4606 2MASS sources. Out of the 9157 optical sources, 4471 stars have 2MASS detections, resulting in a total of 9292 optical and IR sources. When available, the final coordinates are those measured from the optical data. For the other stars – the 44 2MASS sources that were saturated or the 91 2MASS sources that were too red to be detected in the optical images – the 2MASS coordinates are adopted. Photometry and coordinates are given in Tables 1-4 for stars spectroscopically identified as young members, foreground dwarfs, or background stars and for candidate members without spectra. The complete list of optical and IR photometry for the MBM12 cloud can be obtained from the author upon request.
2.2 Spectroscopy
In § 3.1, the optical and IR photometry for the MBM12 cloud is used to identify candidate members of the young association. The spectroscopic observations of those candidates is now described. For the remainder of this paper, the previously known members and the new members discovered in this work are named by the MBM12A designations defined in Table 1.
Candidates of intermediate brightness (-17) were observed with moderate-resolution spectroscopy at the Steward Observatory 2.3 m Bok Reflector. On 2000 December 4, spectra were obtained for 22 candidate members, which include the new members MBM12A 7-11, 11 of the foreground dwarfs in Table 3, and 6 of the background stars in Table 2. The previously known members MBM12A 3 and 6 were observed as well. The Boller and Chivens Spectrometer was operated with the 400 l mm-1 grating ( Å) and Y48 blocking filter to obtain spectra from 5900 to 9300 Å. The spectra were obtained with the slit rotated to the parallactic angle for each target. The slit width was , producing a spectral resolution of FWHM=7.0 Å. The exposure times ranged from 300 to 1800 s.
Out of the 16 candidates from December 4 that showed K or M-type spectra, the 12 brightest (-15) were observed at higher resolution near the Li 6707 Å transition on 2000 December 5. These sources consist of the new members MBM12A 7 and 10 and 10 of the field dwarfs in Table 3. In addition, 34 of the brightest remaining candidates (-13) – 4 field dwarfs and 30 background stars – and the previously known members MBM12A 3 and 4 were observed. The 832 l mm-1 grating ( Å) and Y48 blocking filter provided a wavelength coverage of 6100-7800 Å. With the slit, the spectral resolution was 3.1 Å. The exposure times ranged from 120 to 1800 s.
The faintest three candidates (-19) were observed with low-resolution spectroscopy at the Keck I telescope. Spectra were obtained for 2MASSs J0253030+194904 on 2000 November 25 and for 2MASSs J0258110+192908 and 2MASSs J0257299+204308 on 2000 November 26 with the Keck low-resolution imaging spectrometer (LRIS; Oke et al. 1995). The long-slit mode of LRIS was used with the 150 l mm-1 grating ( Å) and GG570 blocking filter. The maximum wavelength coverage of LRIS, 3800 to 11000 Å, was provided in one grating setting centered near 7500 Å. The spectra were obtained with the slit rotated to the parallactic angle for each target. The slit widths were for 2MASSs J0253030+194904 and for 2MASSs J0258110+192908 and 2MASSs J0257299+204308, producing spectral resolutions of 16 and 20 Å, respectively. The exposure times were 600 s for 2MASSs J0253030+194904 and 1200 s for 2MASSs J0258110+192908 and 2MASSs J0257299+204308.
Standard data reduction procedures were followed for all spectra. After bias subtraction and flat-fielding with internal continuum lamps, the spectra were extracted and calibrated in wavelength with arc lamp data. The spectra were then corrected for the sensitivity functions measured from observations of the spectrophotometric standard stars Feige 11 and 34.
3 New Members of MBM12A
3.1 Identification of Candidate Members
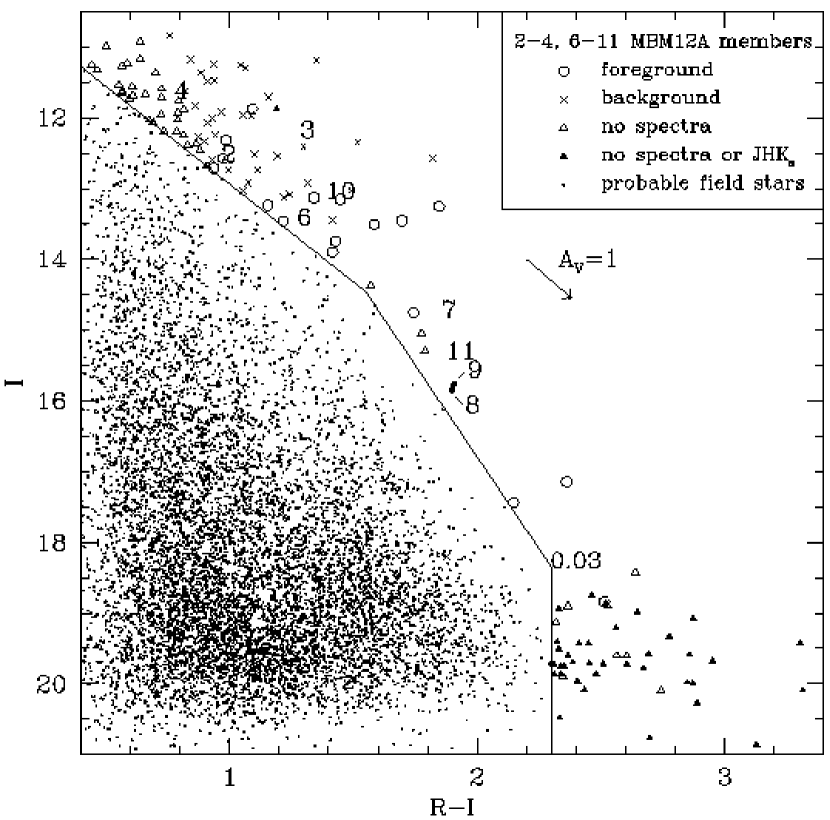
Candidate members of MBM12A can be identified through optical and IR color-color and color-magnitude diagrams. In an optical color-magnitude diagram, the members of a nearby young population form a well-defined locus that is above most of the background stars. In a similar search for young low-mass stars, Luhman (2000) supplemented the and photometry of Briceño et al. (1998) with and data to provide completeness to substellar masses for the full range of the typical reddenings of Taurus members (-10). For the MBM12 cloud, the total extinction is relatively modest () at most sight lines and the reddenings of the previously known members are even lower (). As a result, the and bands are sufficient for this search for new members of MBM12A.
I now describe the region in Figure 2 where stellar and substellar members of MBM12A are expected to reside. An isochrone in vs. can be constructed by combining the models of Baraffe et al. (1998) with the appropriate temperature and color conversions and bolometric corrections (see § A.1). While the vertical offset of this isochrone depends on the assumed age and distance, the shape remains fairly constant for ages of 1-30 Myr. Therefore, independent of the precise age or distance, all members of MBM12A should fall above a boundary that is parallel to a young model isochrone and is below the observed positions of previously known members. Because the colors of the latest M stars saturate near -2.5, the boundary becomes vertical at in Figure 2.
Candidate members in a given region of the above color-magnitude diagram can be reddened background stars or K and M-type stars, where the latter are either members of the association or foreground dwarfs. Many of the background stars can be separated from the late-type stars and rejected from the candidate list through color-color diagrams. For instance, the diagram of vs. in Figure 3 is useful for colors at . With progressively later M spectral types, quickly increases and the corresponding reddening vector separates from the band occupied by most stars, which are reddened background stars of earlier spectral types. The combination of the models of Baraffe et al. (1998) and the compatible temperature scale of Luhman (1999) indicate that brown dwarfs at masses of 0.03 and 0.08 and an age of 2 Myr should have spectral types near M8 and M6.5, respectively. For the filters used here, Luhman (2000) derived the reddening vector . By combining this slope with the dwarf colors of Leggett (1992) for spectral types of M8 and M6.5, I plot the reddening vectors for 0.03 and 0.08 in Figure 3. Only three of the candidates with from Figure 2 exhibit the and colors expected for late M stars.
Finally, as shown in § 4.1.3, a diagram of vs. is a powerful tool for separating background stars and M-type stars at . If this method had been used here in developing the candidate list, the spectroscopy of background stars at would have been avoided.
3.2 Spectral Classification of Candidate Members
The candidate members of MBM12A that were observed spectroscopically are indicated in Figure 2. As described in § 2.2, the candidates with -15 were observed first at low resolution. If they exhibited the K and M-type spectra expected for members (e.g., strong TiO and VO absorption bands), they were observed at higher resolution to check for the strong Li absorption that would identify them as young members rather than foreground field dwarfs. The low-resolution spectra were unnecessary for the brightest candidates as they could be efficiently observed at the higher resolution. At the spectral types of M5 expected for the faintest and reddest candidates (, ), the K and Na absorption lines vary significantly between dwarfs and pre-main-sequence stars (Martín, Rebolo, & Zapatero Osorio 1996; Luhman et al. 1998a, 1998b; Luhman 1999). Because these features are easily detected in low-resolution spectra, higher-resolution data for Li were unnecessary for distinguishing young members from field dwarfs among these faintest candidates.
The targets in the spectroscopic sample can be background stars, foreground stars, or young members of MBM12A. Background stars are predominantly giants and early-type stars; in low-resolution spectra they exhibit only a few absorption lines (H, Ca II) and are otherwise featureless. The 36 stars with these spectral characteristics of background objects are listed in Table 2. Background dwarfs should not appear in a spectroscopic sample of this type because they fall well below the locus of young members in vs. . However, in the initial data reduction used for selecting spectroscopic candidates immediately following the imaging observations, bad pixels near 2MASSs J0257299+204308 caused the star to appear as a candidate member. After correcting for the bad pixels in the final data reduction, the star falls below the boundary in Figure 2. The spectrum of this object is consistent with that of a background dwarf with a spectral type of M2.75V and a reddening of -5.
Foreground dwarfs and young members of MBM12A can be distinguished from each other by the Li, K, and Na absorption features. However, the Li I 6707.8 Å transition must be used with caution as a youth diagnostic (Briceño et al. 1997). The strength of the line can be significantly overestimated in low-resolution data because of blending with nearby Fe lines (Basri, Martín, & Bertout 1991; Covino et al. 1997). In addition, the transition is less useful as a youth indicator for stars earlier than K0. Comparisons of Li measurements of the same stars at both low and high spectral resolutions suggest that accurate equivalent widths can be obtained at a resolution of FWHM Å while the strength of the line is overestimated for FWHM Å (Walter et al. 1988; Gómez et al. 1992; Briceño et al. 1997; Covino et al. 1997; Favata et al. 1997; Neuhäuser et al. 1997). The errors are greatest for G and K-type stars while the contaminating lines are weak relative to Li for M-type stars. In this study of MBM12A, given the resolution of 3.1 Å for the Li spectra and the M types of most of the non-background candidates, the resulting Li measurements should be fairly reliable. This conclusion can be tested by comparing the Li strengths measured here with the equivalent widths found at higher resolution by H00b for MBM12A 4 and by Jayawardhana et al. (2001) for MBM12A 3 and 4. As shown in Table 5, the Li measurements in this study are roughly consistent with previous data at higher resolution and should overestimate the line strengths by no more than %.
No Li absorption is detected for 14 of the candidates showing M-type spectra. The upper limits for Li absorption were for 2MASSs J0257501+195830 and 2MASS J0253243+200659 and -0.1 Å for the remaining stars. A sample spectrum near Li is shown for one of these dwarfs in Figure 4. Strong absorption in K and Na is also found in the spectra of these stars. All of these spectral properties are indicative of field M dwarfs. The lack of reddening in their spectra and colors and their position above the main sequence at the distance to MBM12A suggest that these stars are in the foreground of the cloud. For the faint candidates 2MASSs J0255083+193859, 2MASSs J0258110+192908, and 2MASSs J0253030+194904, only low-resolution spectra are available. However, even without Li measurements, these three stars are clearly M dwarfs by the strong K and Na absorption in their spectra in Figure 5. Spectral types listed in Table 3 for these 17 foreground stars were measured by comparison to the spectra of standard dwarfs from Kirkpatrick, Henry, & McCarthy (1991), Henry, Kirkpatrick, & Simons (1994), and Kirkpatrick, Henry, & Irwin (1997).
The strong Li absorption expected for young late-type stars ( Å) is found in the spectra of the candidates MBM12A 7 and 10, as well as the previously known members MBM12A 3 and 4, as shown in Figure 4. Measurements of Li and H for these stars are given in Table 5. The spectra of MBM12A 7 and 10 also exhibit weak K and Na lines relative to dwarfs of the same spectral types, which is further evidence of their pre-main-sequence nature. The three candidates MBM12A 8, 9, and 11 were observed with low-resolution spectroscopy but were too faint for higher resolution Li measurements. In Figure 5, the spectra of these stars show the weak K and Na absorption features that are signatures of pre-main-sequence stars. The moderately strong H emission (10-15 Å) in MBM12A 7, 9, 10, and 11 is typical of both active field dwarfs and young stars, while the much stronger emission from MBM12A 8 is expected for only the latter. MBM12A 8, 9, and 10 also show IR excess emission in their and colors (§ 4.3). In addition, MBM12A 7 is probably the source of X-rays detected by H00b at from the optical position of the star. Finally, the positions of these five stars are closely correlated with those of the original six members, as seen in Figure 1. For these reasons, I conclude that MBM12A 7-11 are young stars and are associated with the previously known young sources MBM12A 1-6. I used the methods of spectral classification for young late-type stars described by Luhman (1999) to derive spectral types for MBM12A 3, 4, and 6-11, which are listed in Table 1.
3.3 Evaluation of Remaining Candidate Members
Among the stars that were not rejected as field stars in the diagram of vs. in Figure 2, there remain 82 sources that have not been observed spectroscopically. Are any of these objects promising candidate members of MBM12A? There are 32 sources at in Figure 2 that lack spectra. It is unlikely that any of these stars are young members because the previous H and X-ray searches by Stephenson (1986) and H00b should be complete at these bright levels.
The 39 stars at without IR detections are not easily evaluated. From the optical data alone, they could be very cool objects – foreground dwarfs or low-mass members of MBM12A – or reddened background stars. Most of these objects are probably an extension of the reddened background star population at the left of the boundary in Figure 2. To better determine their nature, they must be observed with IR photometry and examined with the color-color diagrams described in § 3.1. If any of them are members of MBM12A, they would have masses of .
There are 11 objects remaining that lack spectra, all of which have IR photometry, , and . As described in § 3.1, at these red colors, young members of MBM12A should be M-type and distinguishable from most background stars by diagrams of vs. and vs. . Indeed, the new M5-M6 young stars (MBM12A 7-9, 11) and the three M6-M9 foreground dwarfs were expected to have M types by their colors in such diagrams. Five of the 11 objects that lack spectra do not have the appropriate colors for late-type stars. The other six sources are potential members of MBM12A, which are listed in Table 4 and are discussed individually. For 2MASSs J0252490+195252, 2MASSs J0258523+195840 and 2MASSs J0258344+194650, the colors , , , and are all consistent with spectral types of M4, M5, and M5, respectively, with no reddening and little or no IR excess (E() and E( mag). These objects could be either foreground dwarfs or young members of MBM12A. The stars 2MASSs J0255056+194454 and 2MASSs J0255372+204311 have very similar photometry, where their optical and IR colors suggest spectral types of M8-M9. They could be either foreground dwarfs or substellar members of MBM12A. If these two stars are members of MBM12A, they should have masses of by their positions in the diagram of vs. in Figure 6 (, ). For 2MASSs J0255452+192526, the various colors are consistent with either a highly reddened mid-M dwarf (-5) or an L-type object with no reddening; the observed colors are somewhat better matched by those of a reddened dwarf. If this source is a member of MBM12A, its position in the diagram of vs. in Figure 6 would imply a mass of . Because 2MASSs J0255452+192526 is projected against the strongest peak in the IRAS 100 m image of the MBM12 cloud, it is probably a highly reddened background dwarf.
3.4 Completeness
Because the mass and reddening vectors are roughly perpendicular in a near-IR color-magnitude diagram and because all of the late-type members should have similar intrinsic IR colors, completeness in mass and reddening are readily evaluated with near-IR data. A diagram of vs. from the 2MASS survey is shown in Figure 6 for the field towards the MBM12 cloud that was imaged in the and bands. The objects that were identified as probable field stars by the diagram of vs. have been omitted. The completeness limits of the 2MASS data are taken to be the magnitudes at which the logarithm of the number of sources as a function of magnitude departs from a linear slope and begins to turn over (, ). As demonstrated in Figure 6, the census of stellar members of MBM12A is complete to the highest line-of-sight reddenings in the cloud (-10). All of the known members show reddenings of (§ A.1.2). If the range of reddenings is the same for stellar and substellar members, then the 2MASS completeness limit indicates that this search for new members of MBM12A is complete to 0.03 , with the exception of the three candidates at -13 from Table 4. The only other IR sources for which membership status is unknown are the bright sources at – which are unlikely to be members (§ 3.3) – and the stars near the 2MASS detection limit – which should have masses of if they are members.
3.5 RXJ0306.5+1921 and MBM12A 12
In a search for new members of MBM12A, H00b used the presence of X-ray emission to identify candidates and obtained followup spectroscopy to check for signatures of youth such as Li absorption and H emission. They found that the star RXJ0306.5+1921, which is east of the cloud, exhibited Li absorption (0.35 Å) and a spectral type of K1 in a low-resolution spectrum (6.4 Å). Because of the X-ray emission and moderately strong Li absorption, H00b identified RXJ0306.5+1921 as a weak-line T Tauri star that was likely a member of MBM12A. However, as discussed in § 3.2, moderately high spectral resolution ( Å) is necessary for accurately measuring the strength of Li absorption in early K stars. Insufficient resolution can produce overestimates of the line strength because of line blending. Indeed, Jayawardhana et al. (2001) recently measured a Li equivalent width of only 0.22 Å in higher resolution spectra (1.5 Å) of RXJ0306.5+1921. This Li strength is more indicative of a star at an age of 100 Myr than a T Tauri star (§ 4.2.1). Furthermore, RXJ0306.5+1921 lacks any other distinguishing characteristics of young stars. The star shows no excess emission at near- to mid-IR wavelengths (Jayawardhana et al. 2001), no reddening, and little or no H emission. Finally, when placed on the H-R diagram at the distance to MBM12A, RXJ0306.5+1921 does not have the same age as the members of MBM12A (§ 4.2.2). There is no evidence that RXJ0306.5+1921 is a young star or a member of MBM12A.
As with RXJ0306.5+1921, the star MBM12A 12, also known as S18, has been taken to be a member of MBM12A although it is offset from the cloud by a few degrees. The IR excess emission, Li absorption, and H emission for MBM12A 12 are clear evidence that it is a bonafide T Tauri star (H00b; Jayawardhana et al. 2001). In addition, the age of MBM12A 12 on the H-R diagram is consistent with that of the association when all stars are placed at the same distance (§ 4.2.2). It is likely that MBM12A 12 was produced in the same episode of star formation as the young stars projected against the MBM12 cloud, but proper motion or radial velocity data are needed to determine its membership in the association with better certainty. For the purposes of this study, MBM12A 12 is taken to be a member of MBM12A.
4 The MBM12A Stellar Population
4.1 Distance
4.1.1 Using the Cloud to Derive the Distance of the Association
To estimate the distance to MBM12A, I first consider whether the association and the cloud are at the same distance. As shown in Figure 1, with the exception of MBM12A 12, the positions of the young stars are closely correlated with the IRAS 100 m emission from the cloud. In addition, radial velocities have been measured for two members of the association, MBM12A 1 and 4, and are consistent with the distribution of velocities of the cloud (H00b). The reddenings of the stars (-2) are less than those observed for background stars at comparable sight lines (-8), which clearly indicates that the stars are not behind the cloud. It is likely that the young stars projected against the MBM12 cloud are at the same distance as the cloud.
4.1.2 Cloud Distance from Interstellar Na I Absorption
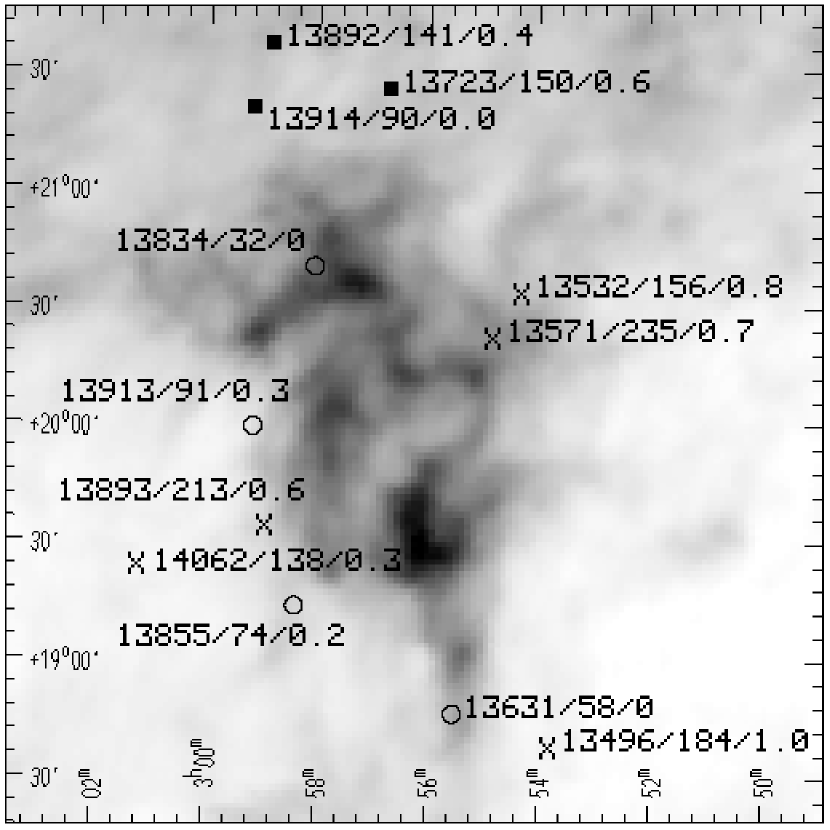
The commonly referenced distance to the MBM12 cloud is 65 pc as reported by Hobbs et al. (1986). They obtained high-resolution spectroscopy of the Na I D lines in A and F stars along the line of sight to the cloud and identified probable foreground and background stars by the absence and presence of interstellar absorption in these transitions. This information was then combined with spectroscopic distances to constrain the distance to the cloud. From the apparent foreground and background positions of HIP13631 and Ari AB (HIP13914), the cloud distance was estimated to be 60-70 pc, which would make it one of the nearest molecular clouds. Hearty et al. (2000a) updated this analysis by including Na spectroscopy of additional stars near MBM12 and by replacing the spectroscopic distances with Hipparcos trigonometric measurements. In the end, the distance estimate of Hearty et al. (2000a) was based on the same pair of stars as in the study by Hobbs et al. (1986), HIP13631 ( pc) and Ari AB ( pc). However, there are two additional stars in the combined samples of Hobbs et al. (1986) and Hearty et al. (2000a) that provide useful limits on the distance to the cloud. As shown in Figure 7, the stars HIP13913 ( pc) and HIP13855 ( pc) are projected against levels of IRAS 100 m emission that are comparable to those at the positions of HIP13631 and Ari AB, making them equally valid stars for constraining the cloud distance. By their proximity to the cloud on the sky and their lack of Na absorption, the stars HIP13834 ( pc), HIP13631 ( pc), HIP13855 ( pc), and HIP13913 ( pc) are probably in the foreground of the cloud and therefore imply a distance of pc to MBM12.
I now discuss the star Ari AB, which has previously provided the upper limit of pc for the distance to MBM12. If this star is behind the MBM12 cloud, then it should exhibit reddening in its colors, but none is apparent in and . This discrepancy was noted by Hobbs et al. (1988), who suggested that the intrinsic colors used in computing the reddening may be uncertain due to the multiplicity of the system. In other words, is it possible that the system does in fact suffer from reddening, but that its intrinsic colors are bluer than the assumed values? Spectral types of A2IV and A3IVs have been measured for the individual components of Ari AB by Abt & Morrell (1995) and colors of and are listed in the Hipparcos database for the system. In the following discussion, the A2IV primary is assumed to dominate the photometry. If the secondary did contribute significantly to the colors, the intrinsic colors of the system would be redder and make it even less plausible that the system is reddened. The observed colors of the system agree perfectly with those expected for a spectral type of A2V. As an additional test, I consider the 49 other stars classified as A2IV in the study of Abt & Morrell (1995), which should have colors that are very similar to those of the primary component of Ari AB. For those 49 stars, the average color is and the bluest value is . Given this typical color, Ari AB again exhibits no reddening. Even if it has colors that are the same as the bluest stars in that sample, the reddening would be only . In conclusion, there is no evidence of the reddening towards Ari AB that is expected if the interstellar Na absorption in its spectrum arises from a dark cloud in the foreground of the star.
Hobbs et al. (1986) did note the possibility that an unusually high concentration of foreground neutral gas could be responsible for the Na absorption towards Ari AB and that the MBM12 cloud could fall at some distance behind the star, which would explain the lack of reddening towards the star. They considered this an unlikely possibility for the following reasons. The Sun is surrounded by a cavity containing hot ionized gas that extends out to pc, which is known as the local bubble (Cox & Reynolds 1987). Because the spectroscopic distance of 70 pc used by Hobbs et al. (1986) for Ari AB placed the star within this cavity, it appeared unlikely that a neutral gas cloud of high optical depth would fall in the foreground of the star. However, the Hipparcos distance to Ari AB is pc, which places it near the wall of the local bubble. In fact, in a study where Hipparcos distances were combined with Na measurements to map the structure of the local bubble, Sfeir et al. (1999) attributed the Na absorption for Ari AB to a clump of cold neutral interstellar gas that is possibly associated with the local bubble wall. A similar scenario was suggested for HD14613 and HD14670, which also have strong Na absorption and are near a clumpy portion of the wall of the local bubble. As with Ari AB, these stars exhibit no reddening in their colors. Given this explanation for the Na absorption and the lack of reddening, it is likely that Ari AB and the wall of the local bubble are in the foreground of the MBM12 cloud. As a result, this star cannot be used to provide the upper limit to the distance to the cloud. In fact, because the boundary of the local bubble is mapped by searching for the Na absorption that is expected from the interstellar medium beyond the bubble, the presence of Na absorption cannot be used as evidence that a star is behind a dark cloud if that star is beyond the local bubble, or at distances greater than 90 pc for the direction of MBM12. In other words, the Na absorption detected for the stars beyond 90 pc in Figure 8 could be attributed to the interstellar medium rather than the MBM12 cloud. Therefore, the Na absorption measurements provide only a lower limit of pc for the distance to MBM12.
4.1.3 Cloud Distance from Reddening
While Na absorption can be produced by both molecular clouds and the neutral gas in the interstellar medium, reddening is by definition a direct tracer of a dark cloud. I explore two methods that incorporate reddening in measuring the distance to MBM12.
Stars with Trigonometric Parallaxes
For the stars near the cloud that have Hipparcos distances, their foreground or background nature can be examined through their reddenings. The positions of the 12 stars in the immediate vicinity of the MBM12 cloud on the sky that have Hipparcos distances are plotted in Figure 7. Colors in are taken from the Hipparcos database. Data at are available from the 2MASS survey for 7 of these stars, which are combined with the measurements compiled by Hipparcos to arrive at colors. An approximate luminosity class (dwarf or giant) of each star was inferred from its absolute magnitude. Extinctions are calculated from the and colors by assuming the appropriate intrinsic values expected for the spectral type and luminosity class in question (see § A.1.2). The reddenings and distances for the 12 stars are shown on the map in Figure 7 and are used to construct the diagram of distance vs. reddening in Figure 8. The reddenings among these stars increase with distance in a manner that is consistent with the reddening arising from the interstellar medium; there is no abrupt increase in reddening that is expected if any of these stars are behind the MBM12 cloud. The lack of significant reddening towards these stars implies that the cloud has a distance of more than 200-250 pc. However, because the more distant stars in this sample are on the outskirts of the cloud, they could be behind the cloud and yet have fairly low reddenings.
Foreground and Background M dwarfs
I now estimate the distance to the MBM12 cloud by using IR and optical photometry to identify background and foreground dwarf stars and then comparing their apparent magnitudes to the absolute magnitudes of nearby dwarfs at comparable spectral types.
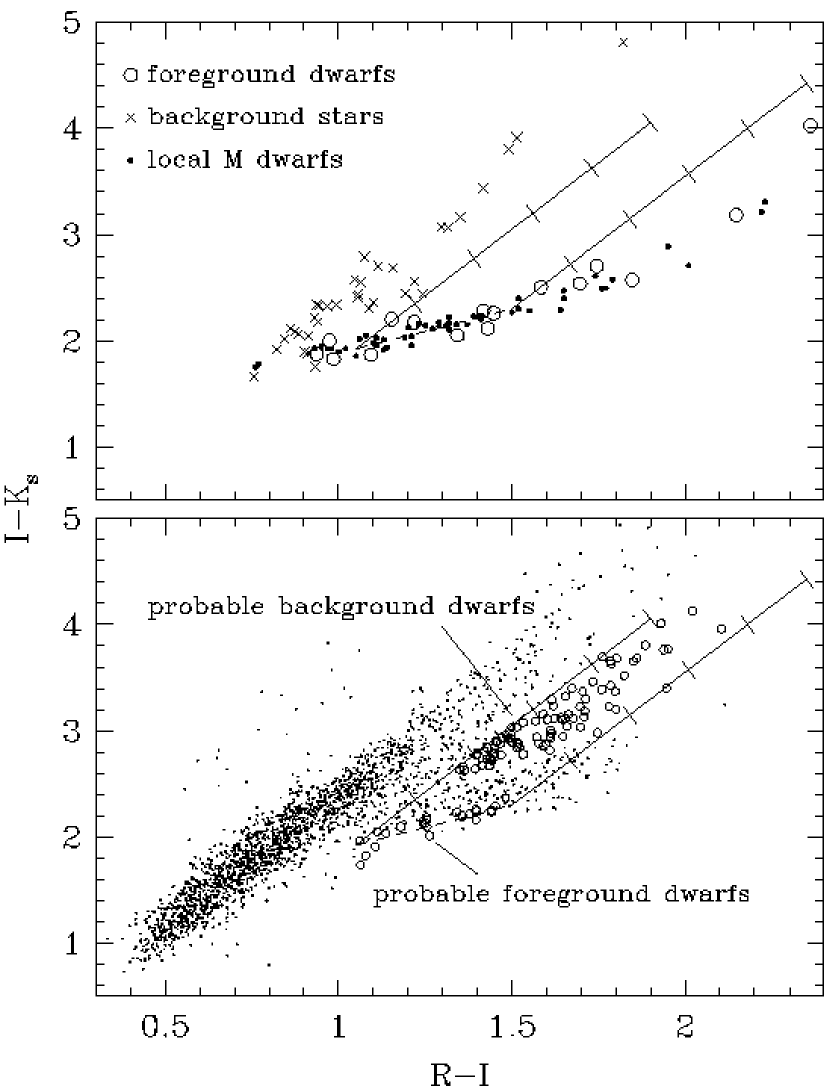
For this method to be successful, there must be a range of dwarf spectral types that is distinguishable from all other types through photometry alone, even in the presence of variable reddening. Because of reddening, stars of different spectral types can inhabit the same regions of most color-color and color-magnitude diagrams. However, in a diagram of vs. , M dwarfs have positions that are unique from those of other stars, as demonstrated in the top panel of Figure 9 where the colors of the foreground dwarfs and the background giants and early-type stars from the spectroscopic sample are compared. (This diagram could have been used to better filter the candidate members that were observed with spectroscopy, as noted in § 3.1). At intrinsic colors of (M1), M dwarfs become well-separated from other stars. Because the path of the latest M dwarfs becomes nearly parallel to the reddening vector in vs. , their reddenings cannot be accurately estimated from this combination of colors. On the other hand, the extinctions for dwarfs at can be readily determined by dereddening the and colors to the sequence of intrinsic colors represented by the dashed line in Figure 9. Therefore, through vs. , dwarfs from to 1.5 (M1-M4) can be separated from stars of other spectral types and have their reddenings estimated. The lower panel of Figure 9 shows all stars in the images of MBM12 that lack spectra and have and . Stars that are near the M dwarf fit at -1.5 and that are projected against the higher levels of IRAS 100 m emission are likely to be M dwarfs in the foreground of the cloud. The remaining stars within the reddening band for the M dwarf fit are probably reddened M dwarfs, where those with colors indicative of are very likely to be behind the MBM12 cloud.
The two samples of probable foreground and background M dwarfs can be compared to local M dwarfs in a color-magnitude diagram to constrain the distance to the MBM12 cloud. For this diagram, is selected as the color because it changes significantly from types of M1 to M4. The 2MASS measurements at are used for the magnitude; the correction for reddening is small in this band and the availability of 2MASS data for both the MBM12 stars and a large number of local M dwarfs enables a reliable comparison among all stars. The foreground and background dwarfs towards MBM12 are shown in the diagrams of vs. in Figure 10. The data for the background dwarfs have been corrected for the reddenings implied by Figure 9. The local field dwarf sample consists of all single M stars from the NASA NStars database ( pc) for which and 2MASS data are available. The individual distances and colors compiled by NStars and the measurements from 2MASS are used to place the stars in this local dwarf sample at distance moduli of 6.7, 7.2, and 7.7 in Figure 10. If the field dwarfs in the vicinity of MBM12 and those in the solar neighborhood have similar photometric properties, and if the latter are placed at the distance to MBM12, than the lower envelope of the distribution of dwarfs in the foreground of MBM12 should match the lower envelope of the local M dwarf sequence. At the same time, the upper envelopes of the background dwarfs and the local M dwarfs should agree as well. As illustrated in Figure 10, this method indicates a distance modulus of ( pc) to the MBM12 cloud.
4.1.4 Implications of New Distance
The revision in the distance to MBM12 from 65 to 275 pc has implications for the previously derived properties of both the cloud and the local bubble. With a distance of 65 pc, Zimmerman & Ungerechts (1990) found that the cloud is not gravitationally bound, except perhaps for a few of the larger clumps. Although the larger revised distance suggests the cloud is more easily bound, these general conclusions may remain unchanged with the larger distance (Zimmerman & Ungerechts 1990). Because of its shadow against the diffuse soft X-ray background and its suggested distance of 65 pc, the MBM12 cloud was believed to fall within the local bubble (Snowden, McCammon, & Verter 1993). In estimating the size of the local bubble from X-ray data, Snowden et al. (1998) assumed a distance intermediate between 32 to 90 pc to the MBM12 cloud. More recently, Sfeir et al. (1999) found that the boundaries of the local bubble as inferred from those X-ray measurements and from Na data agree better if MBM12 is placed at or beyond the edge of the local bubble ( pc) in the X-ray analysis, which is consistent with the revised distance of 275 pc derived in this work. As a result, the X-ray shadow towards the MBM12 cloud is probably caused by diffuse emission from a region outside of the local bubble, such as the Galactic Halo, as observed for other distant clouds (Snowden et al. 2000).
4.2 Age
The age of MBM12A is constrained through two independent methods in the following discussion. First, its age relative to other young associations is examined through a comparison of Li strengths between the populations. Relative and absolute ages are then inferred from the positions of these associations on the H-R diagram. For the comparison to MBM12A, I have selected four of the nearest associations and clusters that have ages of 10-30 Myr: Cha, TWA, HorA, and IC 2602. The sources of the data for these young associations are described in detail in the appendix.
4.2.1 Lithium
As young low-mass stars evolve from the birthline ( Myr) to the main sequence ( Myr), the processes of convection and nuclear burning deplete Li at their stellar surfaces. Consequently, the age of a coeval population of stars is reflected in the typical strengths of photospheric Li absorption in those stars.
The behavior of Li absorption is dependent on both age and effective temperature. At M spectral types, the Li equivalent widths vary from 0.45-0.8 Å at Myr (e.g., Taurus; Basri et al. 1991; Martín et al. 1994) to nearly zero at Myr (e.g., IC 2602; Randich et al. 1997). For G and K stars, the initial Li absorption is weaker and the species is not fully depleted even at 100 Myr, resulting in a smaller change in observed Li strengths with time. Consequently, the diagram of vs. (Li) in Figure 11 is useful for comparing the Li strengths among MBM12A and the other young populations. The distributions of Li strengths for MBM12A, Cha, and TWA are indistinguishable from each other. The range of equivalent widths (0.4-0.65 Å) for the M stars in these associations is similar to or slightly less than that observed for Taurus. Meanwhile, the Li data clearly indicate that MBM12A, Cha, and TWA are younger than IC 2602 and HorA. The Li measurements are consistent with the same age for the latter two populations. However, because the change in Li strengths is small from IC 2602 (30 Myr) to the Pleiades (125 Myr) and the number statistics are poor for HorA, these Li data also allow for an age difference of few tens of millions of years between IC 2602 and HorA.
Because H00b measured strong Li absorption for RXJ0306.5+1921, they identified it as a young star and thus a possible member of MBM12A. However, the weaker line strength found at higher spectral resolution (Jayawardhana et al. 2001) implies an age of Myr, supporting the assertion that this star is not a young member of MBM12A (§ 3.5).
4.2.2 H-R Diagram
In constructing the H-R diagrams for the young associations in Figure 12, the luminosities and temperatures have been derived in the most uniform fashion that is possible given available data. By then placing these associations on one set of theoretical evolutionary models (Baraffe et al. 1998), their relative ages can be determined from a consistent and meaningful comparison among the populations.
On an H-R diagram, a very young stellar population in a star forming region ( Myr) will form a locus that has a large range in luminosities at a given temperature. The dominant sources of this width in the locus are uncertainties in luminosity estimates, variability, and a spread in ages among the cluster members. As a result, when using evolutionary models to infer an age for the population, it is the median or mean age that is generally measured and reported. For a stellar cluster that is older than 5-10 Myr, the lack of reddening and circumstellar excess emission allows more accurate luminosity estimates, accretion-related variability is not present, and typical age spreads of a few million years correspond to negligible ranges of luminosities. Instead, the largest contributor to the width of the locus for an older cluster is expected to be unresolved binaries that appear as overly luminous single stars. Therefore, for older populations the age is measured from the sequence of single stars that forms the lower envelope of the locus rather than from the median of the locus. This approach is clearly applicable to IC 2602. Because of the lack of excess emission near the bands from which the luminosities are computed and the low level of reddening for stars in Cha and MBM12A, unresolved binarity could be the source of the spread in luminosities of their sequences as well. In fact, the presence of double H emission profiles for some of the brighter members of MBM12A and Cha suggests that they may be binaries (Jayawardhana et al. 2001; Mamajek et al. 1999). Therefore, the ages for these associations will be inferred from the lower envelopes of their sequences. For TWA and HorA, the large uncertainties in the relative distances among their members may dominate the scatter in the sequences. Therefore, the age of TWA will be measured from the position of TW Hya alone and the age of HorA will be estimated by considering both the median and the lower envelope of its sequence.
Previous studies have estimated distances of 50-100 pc to the MBM12 cloud. As shown in Figure 12, this range of distances implies that the age of MBM12A is equal to or greater than that of IC 2602 and HorA. If so, the Li strengths of MBM12A should be similar to those of IC 2602 and HorA, which is clearly not the case as seen in the previous section. If the commonly accepted distance of 65 pc were adopted for MBM12A (Hobbs et al. 1986), these stars would fall at or below the main sequence ( Myr).
For comparison to the other associations, MBM12A is plotted for the distance modulus of 7.2 that was derived in § 4.1. A well-defined locus of stars is delineated for both MBM12A and Cha. As described above, unresolved binaries are the likely source of the spread in luminosities for each locus. With the binarity effects taken into account, the sequences for MBM12A and Cha imply ages of 2 Myr and 10 Myr. The uncertainty of in the distance modulus to MBM12A corresponds to possible ages of 1-5 Myr. A comparison of the disk properties of these three populations suggests that IC 348 and MBM12A have similar ages and are slightly older than Taurus, which supports an age of 2 Myr for MBM12A. The position of the star TW Hya on the H-R diagram indicates an age of 10 Myr for TWA.
The models of Baraffe et al. (1998) suggest an age of Myr for IC 2602, which agrees with the value reported by Stauffer et al. (1997) using the calculations of D’Antona & Mazzitelli (1994). For HorA, the members have distances ranging from 40 to 100 pc, which is equivalent to variations of in log . Because only 4 members of the association have Hipparcos distances, large uncertainties are possible in the distances for most of the members, which could result in errors in the luminosity estimates that are greater than the effect of unresolved binaries. Consequently, the age of the association may be reflected in either the median or the lower envelope the sequence, which imply ages of and 50 Myr, respectively. An age of Myr is adopted for HorA. These relative and absolute ages for IC 2602 and HorA are consistent with the age constraints provided by the Li data.
The position of RXJ0306.5+1921 is plotted with the members of MBM12A in Figure 12. As found with the Li data, this star appears significantly older than the stars in MBM12A when the same distance is adopted for all stars.
4.3 Disk Properties
The properties of inner disks as reflected by near-IR excess emission are compared among MBM12A, Taurus, and the cluster IC 348.
In Figs. 13 and 14, the diagrams of vs. and vs. are shown for the 12 members of MBM12A and for the seven original members that were observed at by Jayawardhana et al. (2001), respectively. To estimate the intrinsic IR colors of the star-disk systems, these colors have been corrected for the reddenings in Table 1, most of which were derived from . No optical colors were available for MBM12A 1, 5, and 12, which were dereddened by assuming values for the intrinsic IR colors (§ A.1.2). The locus of intrinsic colors for classical T Tauri stars (CTTS) in Taurus is also shown (Meyer, Calvet, & Hillenbrand 1997). The origin of the Taurus locus is near the intrinsic colors of a M0 dwarf, which is the typical spectral class of the Taurus young stars from which the CTTS locus was measured. For other spectral types, the CTTS locus is expected to maintain the same slope but with the origin shifted to the dwarf colors of the spectral type in question (Meyer et al. 1997; Luhman 1999).
The frequencies and sizes of excess emission in both and in MBM12A are very similar to those in IC 348 (see Figure 1 of Haisch et al. 2001). Stars in Taurus exhibit greater -band excess emission than these two regions; the -band excess frequency is in Taurus as compared to in IC 348 (Haisch et al. 2000, 2001) and the -band excesses of typical CTTS in Taurus are higher than those in MBM12A (Figure 13). Meanwhile, as shown in Figure 14, the sizes of the -band excesses in the MBM12A stars are comparable to those in Taurus. In fact, the frequencies of -band excess sources are similar among MBM12A (5/7, ), Taurus (), and IC 348 () (Haisch et al. 2000, 2001; Kenyon & Hartmann 1995). This reduction in short-wavelength excess emission with age from Taurus to IC 348 and MBM12A (and TW Hya; Jayawardhana et al. 1999) may be a result of inside-out clearing or settling of the disk.
5 Conclusion
I have conducted a comprehensive study of the group of young stars that is projected against the MBM12 dark cloud. For this association, I have searched for new members down to substellar masses, revised its distance, and examined its age and disk properties in the context of other young populations. The conclusions are as follows:
-
1.
With IR photometry from the 2MASS survey and new optical imaging and spectroscopy, I have performed a census of the MBM12A membership that is complete to 0.03 for a field towards the MBM12 cloud, from which I find five new members with spectral types of M3-M6 (0.1-0.4 ). If the IMF in MBM12A were the same as that in the Trapezium Cluster (Luhman et al. 2000), 2-3 brown dwarfs ( ) are expected in MBM12A where none were found. Although this difference between MBM12A and the Trapezium is not significant by itself, it is consistent with the deficit of brown dwarfs observed for Taurus (Luhman 2000), which has similar star-forming conditions as MBM12. Meanwhile, the previously suggested member RXJ0306.5+1921 shows no evidence for youth or membership in the association. There are a total of 11 young sources that are resolved in normal ground-based imaging () towards the MBM12 cloud and an additional star away towards MBM13 that is probably associated with MBM12A. I identify a few additional candidate members of MBM12A that have not been observed spectroscopically.
-
2.
I have used optical and IR photometry to identify stars that are likely to be M dwarfs in the foreground and background of the MBM12 cloud. By comparing the magnitudes of these stars to those of local field dwarfs, the distance modulus to the cloud is constrained to be (275 pc). MBM12 is not the nearest molecular cloud and is not inside the local bubble of hot ionized gas as had been implied by previous distance estimates of 50-100 pc. If the MBM12 cloud were at 65 pc as previously reported, its associated T Tauri stars would fall near the main sequence ( Myr).
-
3.
I have used Li measurements and a combination of H-R diagrams and the evolutionary models of Baraffe et al. (1998) to estimate the absolute and relative ages of MBM12A and other young associations. These data indicate ages of Myr for MBM12A and 10 Myr for TWA and Cha. I also find ages of and Myr for IC 2602 and HorA, which are consistent with previous estimates.
-
4.
Based on published photometry, the frequencies and sizes of -band excess emission are similar among MBM12A, IC 348, and Taurus. Meanwhile, stars in Taurus exhibit greater -band excess emission than those in the other two regions, suggesting that the inner disks are more evolved in the latter.
-
5.
The reddenings, radial velocities, and locations of the young stars relative to one another and to those of the MBM12 cloud combined with the coevality of the stars on the H-R diagram are compelling evidence that these stars comprise an association and that it originated from the cloud. Most of the young stars in Taurus are located in loose aggregates of 10-20 young stars within the dark clouds (Gómez et al. 1993). Similarly, the MBM12A stars form a small, sparse group around the MBM12 cloud. However, compared to the Taurus sites, the MBM12 cloud is less opaque (-10 vs. ) and the stars are less reddened (-2 vs. -10), have more evolved disks and appear to be slightly older on the H-R diagram (2 Myr vs. 1 Myr), and have a lower space density ( pc-3 vs. -10 pc-3). In addition, the MBM12 cloud may be gravitationally unbound and in the process of dispersing following the episode of star formation that created its associated young stars. The MBM12 region appears to be a slightly evolved version of the Taurus star-forming clouds ( Myr) near the age of the IC 348 cluster ( Myr).
Appendix A Adopted Data for Young Associations
Described below are the sources of the Li equivalent widths, effective temperatures, and bolometric luminosities used for MBM12A and the other young associations in § 4.2. The detailed procedures given for MBM12A also apply to the other populations unless otherwise noted. In general, for each population I have selected the members that have resolved photometry and Li measurements and have spectral types between G0 and M6.
A.1 MBM12A
A.1.1 Lithium Strengths
The Li strengths measured in this work and in previous studies for the members of MBM12A are listed in Table 5. No Li data are available for the new members MBM12A 8, 9, and 11. For reasons discussed in § 3.2, the adopted Li strengths are those obtained at the highest spectral resolution among the available data.
In actively accreting young stars, continuum veiling from blue excess emission can weaken the observed strengths of optical absorption features such as Li I 6707.8 Å. As a result, the observed values of Li equivalent widths must be corrected for this effect to arrive at true line strengths, where veilings are typically measured through analysis of multiple photospheric lines in high-resolution spectra and defined as (e.g., Hartigan, Edwards, & Ghandour 1995). Continuum veiling should be significant only for stars showing clear signatures of active accretion, such as strong H emission or excess emission at ultra-violet or IR wavelengths. No veiling correction is made for MBM12A 1 and RXJ0306.5+1921, which exhibit weak H emission and no IR excess emission (Jayawardhana et al. 2001). For MBM12A 5, the presence of a disk is implied by mid-IR photometry, but the low H strength suggests that any accretion is not currently significant and that optical veiling is probably negligible. In the spectrum of MBM12A 4 obtained in this study, the H emission is modest and no significant veiling is found (). For MBM12A 3, a veiling of is measured near the Li transition from the moderate-resolution spectrum presented here. At spectral types of late M, the broad, deep molecular bands allow for rough veiling estimates from low-resolution spectra. In this way, a veiling of is measured from the spectrum of the M4.5 star MBM12A 6. This spectrum was obtained at a different epoch than the adopted Li measurement by Jayawardhana et al. (2001). However, because the H emission strength is similar between the two observations, the veiling probably did not vary significantly either. Thus, the veiling measured here is used to correct the Li strength of Jayawardhana et al. (2001). For MBM12A 7 and 10, the moderate- and low-resolution spectra in this work imply veilings of and and provide the adopted Li data. For MBM12A 2 and 12, spectra were not obtained here and no veiling measurements have been reported previously. The strong H and IR excess emission for both stars suggests that significant veiling may be present. The Li measurements of these two stars could be corrected for veilings that are inferred from the H emission strengths (Strom et al. 1989; Hartmann & Kenyon 1990). However, Basri et al. (1991) found a large scatter between veilings implied by H and those derived from high-resolution spectral analysis. Therefore, rather than use this method, no veiling correction is attempted for MBM12A 2 and 12 and the observed Li strengths are taken as lower limits. The adopted Li measurements and the values after deveiling are given in Table 5.
A.1.2 Extinctions
In the following analysis, standard dwarf colors are taken from the compilation of Kenyon & Hartmann (1995) for types earlier than M0 and from the young disk populations described by Leggett (1992) for types of M0 and later. The IR colors from Kenyon & Hartmann (1995) are transformed from Johnson-Glass to CIT (Bessell & Brett 1988). The data in Table 1 are from the 2MASS survey. For the range of colors of the MBM12A stars (-1), the photometric system of 2MASS is very similar to CIT (Carpenter 2001). Reddenings are calculated with the extinction law of Rieke & Lebofsky (1985), where , , and (extrapolated from ). For the filters used here, Luhman (2000) measured . The combination of these relations implies .
In the common method for estimating the reddening towards a young star, a color excess is calculated by assuming the intrinsic color, typically that of a standard dwarf at the spectral type in question. To ensure that the color excess reflects only the effect of reddening, contamination from short or long wavelength excess emission is minimized by selecting colors between the and bands. Because is less susceptible to excess emission than , the former is used for measuring reddening in this study when it is available. Luhman (1999) found that the intrinsic colors of young stars at M4-M5 types are slightly bluer than the dwarf values, which is a departure from dwarf colors towards giant-like colors. The same effect is present for the 5 members of MBM12A at M4-M6, whose observed colors are equal to or bluer than dwarf colors. Therefore, although dereddening the colors of these stars to dwarf values implies no reddening, they could in fact have small reddenings of up to if the intrinsic colors are even bluer and more giant-like than the observed colors. However, because the 4 stars at M5.5 and M5.75 have nearly identical colors, it’s likely that they are unreddened stars rather than 4 stars all with the same extinction.
Optical colors were not measured for MBM12A 1, 5, and 12. The first two stars were saturated in the data and the latter source was outside of the field that was imaged. Because MBM12A 1 shows no IR excess in the colors , , and , the color should be uncontaminated by IR excess emission. Therefore, the extinction for this star is calculated by dereddening the observed color to the dwarf value at its spectral type. On the other hand, MBM12A 5 and 12 both exhibit strong excesses at and that are indicative of circumstellar disks. To estimate reddenings for these stars, the and colors are dereddened to the locus observed for classical T Tauri stars (CTTS) by Meyer et al. (1997). The locus is constructed here such that the origin coincides with the dwarf colors for the star’s spectral type and the slope is that measured by Meyer et al. (1997) for M0 stars, which they predicted to remain relatively constant with spectral type. This method assumes that the central stars of young mid- and late-M stars have dwarf-like and colors, which is suggested by the work of Luhman (1999). The reddenings derived from IR colors in this manner will have higher uncertainties than those estimated from optical measurements. For instance, the intrinsic CTTS colors can vary by mag, which corresponds to mag in .
A.1.3 Effective Temperatures and Bolometric Luminosities
For reasons described in previous studies (e.g., Luhman 1999), and are the preferred bands for measuring bolometric luminosities of young low-mass stars. The luminosities in Table 1 are computed from standard dwarf bolometric corrections (see Luhman 1999), the dereddened -band measurements, and a distance modulus of 7.2 (§ 4.1). Because the reddening of the MBM12A stars is low and is well-determined by optical colors and because the luminosity is estimated from a wavelength range that suffers little extinction, the uncertainties in the bolometric luminosities from the dereddening procedure are small. Combining the uncertainties in the reddenings, photometry, and bolometric corrections, the typical errors in the relative bolometric luminosities are in log . The errors in the absolute luminosities are dominated by the uncertainty in the distance modulus to the association, which corresponds to in .
Spectral types of M0 and earlier are converted to effective temperatures with the dwarf temperature scale of Schmidt-Kaler (1982). For spectral types later than M0, I adopt the temperature scale developed by Luhman (1999) for use with the evolutionary models of Baraffe et al. (1998). Detailed discussions of the temperature scales and evolutionary models for young low-mass stars are found in Luhman & Rieke (1998), Luhman (1999), and Luhman et al. (2000).
The reddenings, adopted spectral types, effective temperatures, and bolometric luminosities of the members of MBM12A are given in Table 1. Photometric measurements from this work, the 2MASS survey, and Jayawardhana et al. (2001) are also provided.
A.2 Cha
I consider 10 of 12 Cha members from Mamajek et al. (1999). The adopted Li strengths and spectral types for Cha members RECX 1, 7, 10, and 12 are from Covino et al. (1997). Data for the remaining Cha stars are from Mamajek et al. (1999). Limited data are available with which to determine the likelihood of blue excess emission that could veil the Li feature. Only 2 of the 10 members considered here show H strengths that exceed 10 Å. At the late M spectral types of these two stars, H equivalent widths are larger for a given line flux because of the depression of surrounding continuum by molecular bands. Thus, the H measurements of the Cha members suggest that continuum veiling is probably not significant.
Reddenings for the members of Cha are calculated from the colors reported by Lawson et al. (2000). These colors were used rather than data because the latter were not corrected for the effects of star spots in that study. The resulting extinctions had a range of -0.8 and an average value of . In contrast, Lawson et al. (2000) used an assumption of zero reddening and the relations between optical colors and spectral types of standard dwarfs to infer spectral types from the colors of the Cha members. They claimed that these photometrically derived spectral types were more accurate than the classifications from spectra (Covino et al. 1997; Mamajek et al. 1999) because of the relatively high precision of color measurements. However, there are several problems with estimating spectral types in that manner. First, although the colors may be precise, the scatter in the relations between colors and spectral types are much larger. In other words, a given measured color – regardless of its accuracy – can arise from a relatively wide range of spectral types. Also, the method of Lawson et al. (2000) is highly dependent on the assumption that the relation of colors to spectral types for young stars is the same as that for dwarfs, which is not the case for certain colors and ranges of spectral types. For instance, because the optical colors of RECX 5 were bluer than the values expected for the spectral classification of M5, Lawson et al. (2000) concluded that the star must be M4. However, young stars at these spectral types in fact exhibit intrinsic colors that are bluer than those of dwarfs and are more giant-like (Luhman 1999). When comparing their photometrically inferred spectral types to spectral classifications, Lawson et al. (2000) found that their types were systematically later by an average of one subclass. They adopted the photometric spectral types and offered no explanation for why the spectral classifications would have such a systematic error. Instead, it is more reasonable and likely that the spectral classifications are correct and that the red color excesses are simply to due to extinction. The small amount of reddening in question could easily arise from dust within the cluster or from circumstellar material near these young stars.
Mamajek et al. (2000) also note that HD75505 is redder than expected for its spectral type of A1 by 0.13 mag in , which is equivalent to . Again, they attribute the color excess to a spectral misclassification rather than reddening. Mamajek et al. (2000) contend that if the spectral type of this star is truly A1, than it would fall 0.05 dex below the 100 Myr isochrone and thus have an age that is inconsistent with that of the association. But, of course, at a spectral type near A0, isochrones for 10 and 100 Myr are nearly coincident (e.g., D’Antona & Mazzitelli 1997). Thus, this position on the HR diagram is consistent with the age of 10 Myr found for the other members. Furthermore, Mamajek et al. (2000) argue that the red and colors of HD75505 are evidence of a later spectral type of A6. However, just as with the colors, these red colors can be explained by reddening; an A6 star with no reddening and an A0 star with will have similar colors in and . It is unlikely that separate studies would spectroscopically misclassify stars from B to late M in the amount necessary to mimic reddening of . Therefore, the reddenings computed with the colors are adopted here. The bolometric luminosities are derived by combining the dereddened photometry, the appropriate bolometric corrections, and the Hipparcos distance of 97 pc to the star Cha.
A.3 TWA
For the H-R diagram, I consider the 14 TWA stars from Webb et al. (1999) that have resolved spectral types. Because little photometry has been published for the two members from Sterzik et al. (1999), they are not included in the H-R diagram. The new members from Zuckerman et al. (2001) are omitted as well as their distances are uncertain and may be larger than the previously known members (70-100 pc; Zuckerman et al. 2001). For the Li analysis, all members from these studies that have resolved Li measurements and spectral types are included.
For TWA 1, 2A, 4, and 5A, the adopted Li strengths are from Torres et al. (2000) and the adopted spectral types are the average of the values from Torres et al. (2000) and Webb et al. (1999). The Li data and spectral types for TWA 3A, 3B, 6, 7, 8A, 8B, 9A, 9B, and 10 are from Webb et al. (1999) and for TWA 11B (HR4796B) are from Stauffer et al. (1995). The two members of TWA showing the strongest H emission are TWA 1 (TW Hya) and TWA 3A (Hen 3-600A) with and 22 Å, respectively. Muzerolle et al. (2000) concluded that these stars are probably the only known members that have accreting gas disks. Using high-resolution spectroscopy, they derived a veiling of at 7000 Å for TW Hya and negligible veiling for Hen 3-600A. This veiling for TW Hya is used to correct the Li measurement by Torres et al. (2000).
Colors from through have been measured by Torres et al. (2000) for 6 stars in TWA. Reddenings have been derived from the colors of 5 of these 6 stars. For TWA 1 (TW Hya), the reddening is estimated from the color as the band is contaminated by very strong H emission. The resulting values are for 4 stars and for the other 2 sources. As with Cha, although the members of TWA are usually assumed to have no reddening in previous studies (Webb et al. 1999), some do in fact have colors indicative of extinction, as noted recently by Zuckerman et al. (2001). The presence of reddening in these TWA stars is supported by the fact that no reddening was found in the photometry for HorA, which was measured in the same study as the TWA data. The TWA stars that lack optical colors must be assumed to have no reddening. Hipparcos distances are available for four TWA members. For the remaining members, a distance of 50 pc was adopted. The luminosities are derived by combining the distances, dereddened photometry from Webb et al. (1999), and bolometric corrections.
A.4 HorA
For HorA, I consider the 10 “probable” members from Torres et al. (2000) and take the Li data, spectral types, and photometry from that study. The colors from through are consistent with no reddening () for the members of HorA. The trigonometric and kinematic distances reported by Torres et al. (2000) are adopted, which have an average value of 60 pc. The luminosities are calculated by combining these distances, bolometric corrections, and the photometry.
A.5 IC 2602
In Figure 11, the upper envelopes for Li strengths in rapidly and slowly rotating stars in the Pleiades (125 Myr; Stauffer, Schultz & Kirkpatrick 1998) and in stars in IC 2602 (30 Myr; Stauffer et al. 1997) have been defined by Neuhäuser et al. (1997) for Li measurements from Soderblom et al. (1993), García López, Rebolo, & Martín (1994), Randich et al. (1997), and Stauffer et al. (1997). There is no evidence of disk accretion or continuum veiling in these relatively old stars ( Myr).
Temperatures and luminosities for the likely members of IC 2602 (Stauffer et al. 1997; Randich et al. 2001) were derived by combining the relations between spectral types, effective temperatures, colors, and bolometric corrections in § A.1, photometry and colors, a distance modulus of 5.95, and a reddening of (Stauffer et al. 1997).
References
- (1) Abt, H. A., & Morrell, N. I. 1995, ApJS, 99, 135
- (2) Baraffe, I., Chabrier, G., Allard, F., & Hauschildt, P. H. 1998, A&A, 337, 403
- (3) Basri, G., Martín, E. L., & Bertout, C. 1991, A&A, 252, 625
- (4) Bessell, M. S., & Brett, J. M. 1988, PASP, 100, 1134
- (5) Briceño, C., Hartmann, L. W., Stauffer, J. R., Gagné, M., Stern, R. A., & Caillault, J.-P. 1997, AJ, 113, 740
- (6) Briceño, C., Hartmann, L., Stauffer, J., & Martín, E. L. 1998, AJ, 115, 2074
- (7) Carpenter, J. M. 2001, A&A, in press
- (8) Covino, E., Alcalá, J. M., Allain, S., Bouvier, J., Terranegra, L., & Krautter, J. 1997, A&A, 328, 187
- (9) Cox, D. P., & Reynolds, R. J. 1987, ARA&A, 25, 303
- (10) D’Antona, F., & Mazzitelli, I. 1994, ApJS, 90, 467
- (11) Downes, R. A., & Keyes, C. D. 1988, ApJ, 96, 777
- (12) Favata, F., Micela, G., & Sciortino, S. 1997, A&A, 326, 647
- (13) Fernández, M., Ortiz, E., Eiroa, C., & Miranda, L. F. 1995, A&AS, 114, 439
- (14) Fleming, T. A., Gioia, I. M., & Maccacaro, T. 1989, ApJ, 340, 1011
- (15) García López, R. J., Rebolo, R., & Martín, E. L. 1994, A&A, 282, 518
- (16) Gómez, M., Jones, B. F., Hartmann, L., Kenyon, S. J., Stauffer, J. R., Hewett, R., & Reid, I. N. 1992, AJ, 104, 762
- (17) Gómez, M., Hartmann, L., Kenyon, S. J., & Hewett, R. 1993, AJ, 105, 1927
- (18) Haisch, K. E., Lada, E. A., & Lada, C. J. 2000, AJ, 120, 1396
- (19) Haisch, K. E., Lada, E. A., & Lada, C. J. 2001, AJ, 121, 2065
- (20) Hartigan, P., Edwards, S., & Ghandour, L. 1995, ApJ, 452, 736
- (21) Hartmann, L. W., & Kenyon, S. J. 1990, ApJ, 349, 190
- (22) Hearty, T., Fernández, J. M., Alcalá, J. M., Covino, E., & Neuhäuser, R. 2000a, A&A, 357, 681
- (23) Hearty, T., Neuhäuser, R., Stelzer, B., Fernández, J. M., Alcalá, J. M., Covino, E., & Hambaryan, V. 2000b, A&A, 353, 1044 (H00b)
- (24) Henry, T. J., Kirkpatrick, J. D., & Simons, D. A. 1994, AJ, 108, 1437
- (25) Herbig, G. H., & Bell, K. R. 1988, Lick Obs. Bull. Ser., No. 1111
- (26) Herbig, G. H., & Rao, N. K. 1972, ApJ, 174, 401
- (27) Hobbs, L. M., Blitz, L., & Magnani, L. 1986, ApJ, 306, L109
- (28) Hobbs, L. M., Blitz, L., Penprase, B. E., Magnani, L., & Welty, D. E. 1988, ApJ, 327, 356
- (29) Jayawardhana, R., Hartmann, L., Fazio, G., Fisher, R. S., Telesco, C. M., & Piña, R. K. 1999, ApJ, 521, L129
- (30) Jayawardhana, R., Wolk, S. J., Barrado y Navascués, D., Telesco, C. M., & Hearty, T. J. 2001, ApJ, 550, L197
- (31) Kastner, J. H., Zuckerman, B., Weintraub, D. A., & Forveille, T. 1997, Science, 277, 67
- (32) Kenyon, S. J., & Hartmann, L. 1995, ApJS, 101, 117
- (33) Kirkpatrick, J. D., Henry, T. J., & Irwin, M. J. 1997, AJ, 113, 1421
- (34) Kirkpatrick, J. D., Henry, T. J., & McCarthy, D. W. 1991, ApJS, 77, 417
- (35) Kirkpatrick, J. D., et al. 1999, ApJ, 519, 802
- (36) Kirkpatrick, J. D., et al. 2000, AJ, 120, 447
- (37) Landolt, A. U. 1992, AJ, 104, 340
- (38) Lawson, W. A., Crause, L. A., Mamajek, E. E., & Feigelson, E. D. 2001, MNRAS, 321, 57
- (39) Leggett, S. K. 1992, ApJS, 82, 351
- (40) Luhman, K. L. 1999, ApJ, 525, 466
- (41) Luhman, K. L. 2000, ApJ, 544, 1044
- (42) Luhman, K. L., Briceño, C., Rieke, G. H., & Hartmann, L. W. 1998a, ApJ, 493, 909
- (43) Luhman, K. L., & Rieke, G. H. 1998, ApJ, 497, 354
- (44) Luhman, K. L., Rieke, G. H., Lada, C. J., & Lada, E. A. 1998b, ApJ, 508, 347
- (45) Luhman, K. L., Rieke, G. H., Young, E. T., Cotera, A. S., Chen, H., Rieke, M. J., Schneider, G., & Thompson, R. 2000, ApJ, 540, 1016
- (46) Lynds, B. T. 1962, ApJS, 7, 1
- (47) Magnani, L., Blitz, L., & Mundy, L. 1985, ApJ, 295, 402
- (48) Magnani, L., Caillault, J.-P., Buchalter, A., & Beichman, C. A. 1995, ApJS, 95, 159
- (49) Mamajek, E., Lawson, W. A., & Feigelson, E. D. 1999, ApJ, 516, 77
- (50) Mamajek, E., Lawson, W. A., & Feigelson, E. D. 2000, ApJ, 544, 356
- (51) Martín, E. L., Rebolo, R., Magazzù, A., Pavlenko, Ya. V. 1994, A&A, 282, 503
- (52) Martín, E. L., Rebolo, R., & Zapatero Osorio, M. R. 1996, ApJ, 469, 706
- (53) Meyer, M. R., Calvet, N., & Hillenbrand, L. A. 1997, AJ, 114, 288
- (54) Muzerolle, J., Calvet, N., Briceño, C., Hartmann, L., & Hillenbrand, L., 2000, ApJ, 535, L47
- (55) Neuhäuser, R., Torres, G., Sterzik, M. F., & Randich, S. 1997, A&A, 325, 647
- (56) Oke, J. B., et al. 1995, PASP, 107, 375
- (57) Randich, S., Aharpour, N., Pallavicini, R., Prosser, C. F., & Stauffer, J. R. 1997, A&A, 323, 86
- (58) Randich, S., Pallavicini, R., Meola, G., Stauffer, J. R., & Balachandran, S. C. 2001, A&A, in press
- (59) Rieke, G. H., & Lebofsky, M. J. 1985, ApJ, 288, 618
- (60) Schmidt-Kaler, T. 1982, in Landolt-Bornstein, Group VI, Vol. 2, ed. K.-H. Hellwege (Berlin: Springer), 454
- (61) Sfeir, D. M., Lallement, R., Crifo, F., & Welsh, B. Y. 1999, A&A, 346, 785
- (62) Snowden, S. L., Egger, R., Finkbeiner, D. P., Freyberg, M. J., & Plucinsky, P. P. 1998, ApJ, 493, 715
- (63) Snowden, S. L., Freyberg, M. J., Kuntz, K. D., & Sanders, W. T. 2000, ApJS, 128, 171
- (64) Snowden, S. L., McCammon, D., & Verter, F. 1993, ApJ, 409, L21
- (65) Soderblom, D. R., Jones, B. F., Balachandran, S., Stauffer, J. R., Duncan, D. K., Fedele, S. B., & Hudon, J. D. 1993, AJ, 106, 1059
- (66) Stauffer, J. R., Hartmann, L. W., & Barrado y Navascués, D. 1995, ApJ, 454, 910
- (67) Stauffer, J. R., Hartmann, L. W., Prosser, C. F., Randich, S., Balachandran, S., Patten, B. M., Simon, T., & Giampapa, M. 1997, ApJ, 479, 776
- (68) Stauffer, J. R., Schultz, G., & Kirkpatrick, J. D. 1998, ApJ, 499, 199
- (69) Stephenson, C. B. 1986, ApJ, 300, 779
- (70) Sterzik, M. F., Alcalá, J. M., Covino, E., & Petr, M. G. 1999, A&A, 346, L41
- (71) Strom, K. M., Wilkin, F. P., Strom, S. E., & Seaman, R. L. 1989, AJ, 98, 1444
- (72) Torres, C. A. O., Da Silva, L., Quast, G. R., De La Reza, R., & Jilinski, E. 2000, AJ, 120, 1410
- (73) van Dishoeck, E. F., & Black, J. H. 1988, ApJ, 334, 771
- (74) Walter, F. M., Brown, A., Mathieu, R. D., Myers, P. C., & Vrba, F. V. 1988, AJ, 96, 297
- (75) Webb, R. A., et al. 1999, ApJ, 512, L63
- (76) Zimmermann, T., & Ungerechts, H. 1990, A&A, 238, 337
- (77) Zuckerman, B., Becklin, E. E., McLean, I. S., & Patterson, J. 1992, ApJ, 400, 665
- (78) Zuckerman, B., & Webb, R. A. 2000, ApJ, 535, 959
- (79) Zuckerman, B., Webb, R. A., Schwartz, M., & Becklin, E. E. 2001, ApJ, 549, L233


| MBM12A | Other Names | (2000) | (2000) | Spectral Typeaa 1=Herbig & Bell 1988, 2=Hearty et al. 2000b, 3=Fleming, Gioia, & Maccacaro 1989, 4=this work. | Adopt | bbIntermediate temperature scale of Luhman 1999. | |||||||||
|---|---|---|---|---|---|---|---|---|---|---|---|---|---|---|---|
| 1 | RXJ0255.4+2005 | 2 55 25.78 | 20 04 51.7 | K6(2) | K6 | 4205 | 0.11 | 1.8 | 10.69 | 0.62 | 0.18 | 8.99 | 0.08 | 0.15 | |
| 2 | LkHa262 | 2 56 07.99 | 20 03 24.3 | M0(1,2) | M0 | 3850 | 0.33 | 0.55 | 1.00 | 12.51 | 1.03 | 0.60 | 9.66 | 0.82 | 2.64 |
| 3 | LkHa263 | 2 56 08.42 | 20 03 38.6 | M2(1),M4(2),M3(4) | M3 | 3415 | 0.00 | 0.59 | 1.32 | 12.17 | 0.80 | 0.30 | 9.52 | 0.55 | 2.45 |
| 4 | LkHa264 | 2 56 37.56 | 20 05 37.1 | K5(1,2),K5-K6(4) | K5 | 4350 | 0.24 | 1.4 | 0.81 | 11.60 | 0.83 | 0.49 | 8.90 | 0.77 | 3.75 |
| 5 | E02553+2018 | 2 58 11.23 | 20 30 03.5 | K3(3),K4(2) | K3.5 | 4660 | 0.55 | 4.8 | 10.54 | 0.80 | 0.36 | 8.11 | 1.06 | 2.45 | |
| 6 | RXJ0258.3+1947 | 2 58 16.09 | 19 47 19.6 | M5(2),M4.5(4) | M4.5 | 3198 | 0.00 | 0.19 | 1.30 | 13.40 | 0.71 | 0.37 | 10.73 | 0.30 | 2.15 |
| 7 | RXJ0256.3+2005 | 2 56 17.98 | 20 06 09.9 | M5.75(4) | M5.75 | 3024 | 0.00 | 0.098 | 1.89 | 14.70 | 0.60 | 0.30 | 11.66 | ||
| 8 | 2 57 49.02 | 20 36 07.8 | M5.5(4) | M5.5 | 3058 | 0.00 | 0.035 | 1.90 | 15.85 | 0.69 | 0.34 | 12.61 | |||
| 9 | 2 58 13.37 | 20 08 25.0 | M5.75(4) | M5.75 | 3024 | 0.00 | 0.038 | 1.91 | 15.77 | 0.70 | 0.28 | 12.60 | |||
| 10 | 2 58 21.10 | 20 32 52.7 | M3.25(4) | M3.25 | 3379 | 0.05 | 0.27 | 1.45 | 13.04 | 0.83 | 0.37 | 10.33 | |||
| 11 | 2 58 43.80 | 19 40 38.3 | M5.5(4) | M5.5 | 3058 | 0.00 | 0.052 | 1.93 | 15.30 | 0.63 | 0.33 | 12.25 | |||
| 12 | S18 | 3 02 21.05 | 17 10 34.2 | M3(2) | M3 | 3415 | 0.50 | 0.87 | 0.81 | 0.33 | 9.56 | 0.90 | 1.75 |
Note. — , , and data are from this work, the 2MASS survey, and Jayawardhana et al. 2001, respectively. Coordinates for MBM12A 1-11 are measured from the -band images, where the plate solutions were derived using 2MASS coordinates of sources appearing in the images. Coordinates for MBM12A 12 are directly from the 2MASS survey.
| ID | (2000) | (2000) | |||||
|---|---|---|---|---|---|---|---|
| 2MASSs J0253511+202808 | 2 53 51.15 | 20 28 08.5 | 0.91 | 12.08 | 0.64 | 0.19 | 10.03 |
| 2MASSs J0253530+194517 | 2 53 53.09 | 19 45 18.0 | 0.94 | 11.25 | 0.78 | 0.22 | 8.91 |
| 2MASSs J0254108+201804 | 2 54 10.90 | 20 18 04.5 | 0.94 | 11.47 | 0.72 | 0.21 | 9.29 |
| 2MASSs J0254151+202218 | 2 54 15.13 | 20 22 18.6 | 0.94 | 12.24 | 0.76 | 0.22 | 9.90 |
| 2MASSs J0254471+202918 | 2 54 47.19 | 20 29 18.5 | 0.84 | 11.18 | 0.62 | 0.21 | 9.16 |
| 2MASSs J0255119+201624 | 2 55 11.98 | 20 16 24.5 | 1.09 | 11.97 | 0.63 | 0.23 | 9.67 |
| 2MASSs J0255230+194145 | 2 55 23.10 | 19 41 45.3 | 1.06 | 11.30 | 0.80 | 0.28 | 8.75 |
| 2MASSs J0255386+202443 | 2 55 38.64 | 20 24 43.9 | 1.05 | 11.96 | 0.79 | 0.26 | 9.56 |
| 2MASSs J0255516+201807 | 2 55 51.65 | 20 18 07.9 | 1.24 | 13.08 | 0.78 | 0.22 | 10.64 |
| 2MASSs J0256007+194046 | 2 56 00.72 | 19 40 46.1 | 1.82 | 12.57 | 1.35 | 0.51 | 7.76 |
| 2MASSs J0256087+193344 | 2 56 08.78 | 19 33 44.9 | 1.52 | 12.35 | 1.09 | 0.36 | 8.43 |
| 2MASSs J0256129+202915 | 2 56 12.94 | 20 29 15.7 | 1.11 | 12.74 | 0.80 | 0.30 | 10.04 |
| 2MASSs J0256462+193351 | 2 56 46.24 | 19 33 51.7 | 0.93 | 12.00 | 0.49 | 0.19 | 10.24 |
| 2MASSs J0256481+193204 | 2 56 48.13 | 19 32 04.5 | 0.91 | 11.48 | 0.56 | 0.18 | 9.60 |
| 2MASSs J0256574+195815 | 2 56 57.46 | 19 58 15.6 | 0.90 | 12.34 | 0.54 | 0.17 | 10.44 |
| 2MASSs J0256598+200215 | 2 56 59.85 | 20 02 15.7 | 1.07 | 12.92 | 0.95 | 0.24 | 10.13 |
| 2MASSs J0257004+195124 | 2 57 00.41 | 19 51 24.5 | 0.89 | 11.37 | 0.67 | 0.21 | 9.30 |
| 2MASSs J0257038+201311 | 2 57 03.82 | 20 13 11.2 | 0.97 | 11.93 | 0.69 | 0.26 | 9.60 |
| 2MASSs J0257159+202616 | 2 57 15.94 | 20 26 16.7 | 0.88 | 12.28 | 0.60 | 0.24 | 10.18 |
| 2MASSs J0257214+194730 | 2 57 21.49 | 19 47 30.8 | 0.66 | 0.13 | 8.80 | ||
| 2MASSs J0257280+195738 | 2 57 28.08 | 19 57 38.3 | 1.05 | 11.26 | 0.79 | 0.21 | 8.68 |
| 2MASSs J0257299+204308 | 2 57 29.94 | 20 43 08.9 | 1.88 | 18.20 | 1.16 | 0.51 | 13.64 |
| 2MASSs J0257391+193107 | 2 57 39.11 | 19 31 07.3 | 1.32 | 12.92 | 0.87 | 0.35 | 9.85 |
| 2MASSs J0257439+193336 | 2 57 43.90 | 19 33 36.6 | 0.82 | 11.63 | 0.66 | 0.18 | 9.71 |
| 2MASSs J0257460+200055 | 2 57 46.05 | 20 00 55.7 | 1.22 | 13.13 | 0.64 | 0.28 | 10.56 |
| 2MASSs J0257474+192609 | 2 57 47.43 | 19 26 09.3 | 1.42 | 13.44 | 1.04 | 0.36 | 10.01 |
| 2MASSs J0257536+194325 | 2 57 53.60 | 19 43 25.2 | 1.49 | 13.03 | 1.11 | 0.44 | 9.22 |
| 2MASSs J0257540+202724 | 2 57 54.09 | 20 27 24.7 | 0.99 | 12.74 | 0.73 | 0.19 | 10.40 |
| 2MASSs J0257562+193228 | 2 57 56.28 | 19 32 28.8 | 1.35 | 11.19 | 1.05 | 0.33 | 8.03 |
| 2MASSs J0257597+200343 | 2 57 59.72 | 20 03 43.5 | 1.16 | 11.71 | 0.78 | 0.26 | 9.02 |
| 2MASSs J0258046+193146 | 2 58 04.69 | 19 31 46.9 | 1.30 | 12.41 | 0.90 | 0.34 | 9.33 |
| 2MASSs J0258157+194626 | 2 58 15.72 | 19 46 26.4 | 0.86 | 11.84 | 0.60 | 0.27 | 9.72 |
| 2MASSs J0258257+200824 | 2 58 25.78 | 20 08 24.9 | 1.19 | 12.54 | 0.78 | 0.22 | 10.09 |
| 2MASSs J0258458+201114 | 2 58 45.81 | 20 11 15.0 | 1.06 | 13.04 | 0.86 | 0.23 | 10.60 |
| 2MASSs J0259057+202309 | 2 59 05.71 | 20 23 09.5 | 1.10 | 12.52 | 0.59 | 0.24 | 10.16 |
| 2MASSs J0259134+203452 | 2 59 13.43 | 20 34 52.6 | 0.76 | 10.84 | 0.42 | 0.17 | 9.18 |
| 2MASSs J0259258+201702 | 2 59 25.83 | 20 17 03.0 | 0.93 | 12.60 | 0.74 | 0.21 | 10.38 |
Note. — Spectroscopy indicates early or giant spectral types for all sources except 2MASSs J0257299+204308, which is classified as M2.75V.
| ID | (2000) | (2000) | Spectral Type | |||||
|---|---|---|---|---|---|---|---|---|
| 2MASSs J0252368+193424 | 2 52 36.80 | 19 34 24.2 | M0.5V-M1V | 1.09 | 11.88 | 0.63 | 0.20 | 10.01 |
| 2MASSs J0252486+203908 | 2 52 48.63 | 20 39 08.6 | M2.5V | 1.22 | 13.46 | 0.60 | 0.24 | 11.29 |
| 2MASSs J0253030+194904 | 2 53 03.00 | 19 49 04.3 | M8.25V | 2.36 | 17.14 | 0.74 | 0.42 | 13.12 |
| 2MASSs J0253031+192907 | 2 53 03.11 | 19 29 07.6 | M4.75V | 1.85 | 13.25 | 0.61 | 0.26 | 10.68 |
| 2MASSs J0253099+203849 | 2 53 09.92 | 20 38 49.2 | M0V | 0.97 | 12.58 | 0.67 | 0.18 | 10.57 |
| 2MASSs J0253243+200659 | 2 53 24.37 | 20 06 59.5 | M3V | 1.42 | 13.90 | 0.60 | 0.30 | 11.61 |
| 2MASSs J0254038+193136 | 2 54 03.87 | 19 31 36.2 | M3V | 1.43 | 13.75 | 0.59 | 0.27 | 11.63 |
| 2MASSs J0255083+193859 | 2 55 08.31 | 19 38 59.2 | M5.75V | 2.15 | 17.44 | 0.53 | 0.46 | 14.26 |
| 2MASSs J0255214+194614 | 2 55 21.52 | 19 46 15.1 | M0.5V-M1V | 0.99 | 12.31 | 0.66 | 0.20 | 10.48 |
| 2MASSs J0255350+200648 | 2 55 35.02 | 20 06 48.7 | M4.5V | 1.70 | 13.46 | 0.64 | 0.26 | 10.91 |
| 2MASSs J0257501+195830 | 2 57 50.17 | 19 58 30.1 | M4.5V | 1.74 | 14.75 | 0.66 | 0.25 | 12.05 |
| 2MASSs J0257585+202208 | 2 57 58.56 | 20 22 08.0 | M4V-M4.5V | 1.58 | 13.51 | 0.61 | 0.29 | 11.00 |
| 2MASSs J0258110+192908 | 2 58 11.03 | 19 29 08.0 | M9V | 2.51 | 18.84 | 0.55 | 0.54 | 14.91 |
| 2MASSs J0258146+202249 | 2 58 14.65 | 20 22 49.0 | M3V-M3.5V | 1.45 | 13.16 | 0.60 | 0.23 | 10.89 |
| 2MASSs J0258228+200722 | 2 58 22.88 | 20 07 22.4 | K7V-K8V | 0.94 | 12.71 | 0.68 | 0.19 | 10.84 |
| 2MASSs J0258343+200023 | 2 58 34.32 | 20 00 23.6 | M2V | 1.15 | 13.23 | 0.70 | 0.27 | 11.03 |
| 2MASSs J0259129+200549 | 2 59 12.98 | 20 05 49.3 | M2.5-M3V | 1.34 | 13.13 | 0.55 | 0.26 | 11.08 |
| ID | (2000) | (2000) | |||||
|---|---|---|---|---|---|---|---|
| 2MASSs J0252490+195252 | 2 52 49.09 | 19 52 52.4 | 1.57 | 14.37 | 0.58 | 0.27 | 12.01 |
| 2MASSs J0255056+194454 | 2 55 05.61 | 19 44 53.3 | 2.61 | 19.60 | 0.81 | 0.31 | 15.65 |
| 2MASSs J0255372+204311 | 2 55 37.26 | 20 43 11.2 | 2.56 | 19.60 | 0.77 | 0.37 | 15.74 |
| 2MASSs J0255452+192526 | 2 55 45.24 | 19 25 26.1 | 2.35 | 19.89 | 1.07 | 0.71 | 15.17 |
| 2MASSs J0258344+194650 | 2 58 34.52 | 19 46 50.5 | 1.78 | 15.04 | 0.44 | 0.36 | 12.63 |
| 2MASSs J0258523+195840 | 2 58 52.39 | 19 58 40.0 | 1.79 | 15.29 | 0.66 | 0.30 | 12.43 |
| MBM12A | (H) | (Li) | (H) | (Li) | (H) | (Li) | (Li) | |
|---|---|---|---|---|---|---|---|---|
| H00b | Jayawardhana et al. 2001 | this work | adopted | deveiled | ||||
| 1 | bbHigh resolution. | 0.44 | 0.44 | |||||
| 2 | aaDouble-peaked profile. | 0.51 | ||||||
| 3 | aaDouble-peaked profile. | aaDouble-peaked profile. | 0.39 | 0.51 | ||||
| 4 | bbHigh resolution. | aaDouble-peaked profile. | 0.51 | 0.51 | ||||
| 5 | aaDouble-peaked profile. | 0.39 | 0.39 | |||||
| 6 | 0.42 | 0.63 | ||||||
| 7 | 0.75 | 0.75 | ||||||
| 8 | ||||||||
| 9 | ||||||||
| 10 | 0.54 | 0.65 | ||||||
| 11 | ||||||||
| 12 | 0.35 | |||||||
Note. — Positive and negative equivalent widths denote absorption and emission, respectively, in units of Å.