Detection of an X-ray Pulsar Wind Nebula and Tail in SNR N157B
Abstract
We report Chandra X-ray observations of the supernova remnant N157B in the Large Magellanic Cloud, which are presented together with an archival HST optical image and a radio continuum map for comparison. This remnant contains the recently discovered 16 ms X-ray pulsar PSR J0537-6910, the most rapidly rotating young pulsar known. Using phase-resolved Chandra imaging, we pinpoint the location of the pulsar to 204 (J2000) with an uncertainty of . PSR J0537-6910 is not detected in any other wavelength band. The X-ray observations resolve three distinct features: the pulsar itself, a surrounding compact wind nebula which is strongly elongated (dimension pc pc), and a feature of large-scale ( pc long) diffuse emission trailing from the pulsar. This latter comet tail-shaped feature coexists with enhanced radio emission and is oriented nearly perpendicular to the major axis of the pulsar wind nebula.
We propose the following scenario to explain these features. The bright, compact nebula is likely powered by a toroidal pulsar wind of relativistic particles which is partially confined by the ram-pressure from the supersonic motion of the pulsar. The particles, after being forced out from the compact nebula (the head of the “comet”), are eventually dumped into a bubble (the tail), which is primarily responsible for the extended diffuse X-ray and radio emission. The ram-pressure confinement also allows a natural explanation for the observed X-ray luminosity of the compact nebula and for the unusually small X-ray to spin-down luminosity ratio of , compared to similarly energetic pulsars. We estimate the pulsar wind Lorentz factor of N157B as (with an uncertainty of a factor ), consistent with that inferred from the modeling of the Crab Nebula.
1 Introduction
Pulsars are thought to lose their rotation energy predominately in the form of a highly relativistic electron/positron wind. Initially, the wind is invisible as it freely expands through the self evacuated region surrounding the pulsar, and eventually encounters ambient medium where the wind is reverse-shocked, resulting in the thermalization and re-acceleration of particles. The synchrotron radiation from these particles may be strong enough to be observable. The classic example of such a pulsar wind nebulae (PWNe) is the Crab nebula (containing a pulsar with a spin period of 33 ms) and the supernova remnant (SNR) 0540-693 in the Large Magellenic Cloud (LMC) which contains a 50 ms pulsar (Gotthelf & Wang 2000 and references therein). Extracting information from a Crab-like PWN is difficult though, because their present physical condition depends on their evolutionary history, which can be rather uncertain.
Optimally, one wants to study a PWN that is strongly confined by ram pressure. Such confinement occurs when the pulsar responsible for the PWN is moving at a velocity higher than the sound speed of the ambient medium. In this case, the shocked wind assumes a bow-shock morphology. Driven by the high pressure inside the bow shock region, shocked wind material can flow out in the direction opposite to the pulsar’s proper motion (e.g., Wang et al. 1993; Wang & Gotthelf 1998a — WG98 hereafter). Consequently, the bow shock region contains only freshly shocked wind material. Thus the synchrotron radiation (primarily in X-ray) from this region contains the most direct information about both the pre-shock pulsar wind and the subsequent particle acceleration in the shock. The moderate relativistic outflow will eventually be terminated by a weak reverse shock or a series of oblique shocks, forming a pulsar wind bubble that is largely offset from the pulsar (Wang et al. 1993).
The bright X-ray object N157B (NGC 2060, Henize 1956; also known as SNR 0538-691) is a young (about yr-old; WG98) supernova remnant in the 30 Doradus region of the Large Magellanic Cloud (LMC) with a complex X-ray morphology. To explain the nature of the emission from this object, WG98 proposed the ram-pressure confined PWN model, based on a spatial and spectral analysis of ROSAT and ASCA observations. The subsequent discovery of the 16 ms pulsar PSR J0537-6910 in the remnant (Marshall et al. 1998) validated this interpretation and a later ROSAT HRI analysis located the pulsar emission to where predicted by the model (Wang & Gotthelf 1998b). The ROSAT data also marginally resolved large-scale diffuse X-ray emission extending out from one side of the pulsar. The data, however, did not allow for a spatial separation of the expected bow shock nebula from the pulsar.
The Chandra observations reported here enabled us to conduct a high spatial resolution X-ray study of N157B. We further compare the X-ray data with an archival HST WFPC2 optical image and a radio continuum map. Our results are consistent with the confined PWN interpretation and further allow us to infer the geometry and Lorentz factor of the pulsar wind. Throughout this paper, we adopt a distance of N157B as 51 kpc (thus corresponds to 0.25 pc).
2 Observations and Calibration
N157B was imaged by the Chandra observatory (Weisskopf et al. 1996) twice, once with each of its two High Resolution Cameras, the HRC-I and HRC-S (Murray et al. 1997), placed at the focal plane of the telescope mirror. The original HRC-I observation, taken on 12 Feb 2000, suffered from a non-recoverable timing problem (see the Chandra Science Center memo for details) which prevented the detection of the expected pulse period from PSR J0537-6910, whose pulse profile is just 2 ms wide. A re-observation, obtained on 30 July 2000 with the HRC-S, was carried out in a revised mode designed to bypass the timing problem of the HRCs. This observation served as the verification of this new observing mode which is now standard for HRC targets that require pulse timing uncertainty of less than 4 ms.
The HRCs are multi-channel plate detectors sensitive to X-rays over an energy range of keV with essentially no spectral information available. For both observations, N157B was centered on the on-axis position of the HRCs where the point spread function (PSF) has a half power radius (the radius enclosing 50% of total source counts) of . The detectors oversample the telescope mirror PSF with pixels 01318 per side. Only the HRC-S observation was used in the timing analysis reported herein. Time-tagged photons were acquired with a nominal precision of 15.6 s, and the arrival times were corrected to the solar system barycenter using a beta version of AXBARY. The initial pulsar position for the barycenter correction was estimated using the reported ROSAT position (Wang & Gotthelf 1998b).
Having previously identified various problems with the standard processed HRC data sets, we begin our analysis with photon event data re-processed from the Level 0.5 event files according to the prescription and filtering criteria outlined in Helfand, Gotthelf, & Halpern (2001). This reduced the instrumental background, removed “ghost image” artifacts, applied the correct degap parameters, filtered out time intervals of telemetry dropouts, and reassigned mis-placed photons. The filtered/total exposure times were 26.6/30.4 ks and 26.4/32.5 ks, respectively, for the first and second observations.
Both data sets are useful. The HRC-I field of view covered the core region of 30 Dor, which harbors two relatively bright X-ray sources that are apparently associated with Wolf-Rayet stars, MK34 and R140 (Wang 1995). The HRC-I centroids of the two X-ray sources are found to be consistent with the optical positions of these stars; the offset is . Thus, we consider the astrometry of the HRC-I observation to be accurate. However, the HRC-S centroid of PSR J0537-6910 is offset by from the measured HRC-I centroid of the pulsar. Since the fiducial stars were out of the HRC-S field of view and thus unavailable, we aspected the HRC-S observation using the pulsar’s centroid to the HRC-I coordinates. The two observations were then combined to increase the counting statistics for images used to produce Figs. 1-3. Since the reponses of the two instruments are not necessarily identical, all the our quantitative measurements reported here are based on the HRC-S data alone.
For a comparison with the Chandra data, we downloaded an archival HST WFPC2 image, which was taken on 1997 October 16 (Proposal ID 7786). As this HST observation was a single 40-sec exposure, the cosmic-ray-removal program was not performed on the image (Fig. 2). The apparent linear artifacts were caused by cosmic ray hits. The correction of geometric distortion was not applied on the image, which can result in an error of about 01 on the relative positions. The accuracy of absolute astrometry on WFPC2 images, limited by the accuracy of the guide star position, is typically 05 rms in each coordinate (Shaw et al. 1998).
3 Analysis and Results
A global view of N157B as seen by the Chandra HRCs is shown in Fig. 1. The low surface brightness X-ray enhancement on scales up to is the previously resolved emission (WG98). The spectral analysis of the ROSAT and ASCA data indicates that the enhancement most likely represents the blastwave-heated thermal gas with a characteristic temperature of keV (WG98). A spectrum from the XMM-Newton X-ray Observatory has confirmed the presence of the thermal component (Dennerl et al. 2001). The true boundary of the SNR is uncertain, however. As shown in Fig. 2, the relatively bright X-ray emission region is confined within the optical filaments, F1, F2, and F3. But the X-ray emission clearly extends beyond F4. These filaments, corresponding well with high velocity features in long-slit optical spectra, are considered to be the edges of the SNR (Chu et al. 1992). The region is also bright in radio continuum (Fig. 3a). The lack of enhanced X-ray emission in the southern part of the region may be due to the presence of a foreground dark cloud, evident in the HST WFPC2 image (Fig. 2). This complexity of the region is at least partly due to the coexistence of the SNR with the OB association LH99 (Lucke & Hodge 1970). Some of the features may result from the photonization and/or mechanical input from massive stars. There may be stellar wind bubbles and other SNRs. The interaction of the SNR N157B with this complex may also play an important role in defining the overall X-ray morphology of the region.
Fig. 3 presents a close-up of the high X-ray surface brightness region of N157B along with a recent radio continuum map for comparison. The main X-ray emission for the region, referred to as a “comet-shaped” feature in WG98, is oriented SE-NW and is now fully resolved in the Chandra images. As can be see in Fig. 3, embedded in the SE end of the “comet” lies a bright, compact nebula (the “head” in WG98). This compact nebula is elongated in a direction nearly perpendicular to the fainter, diffuse comet tail-shaped feature. In the middle of the bright nebula is a point-like source, representing the pulsar PSR J0537-6910. The X-ray centroid of the source is at R.A., Dec (J2000) = 204, consistent with the ROSAT position within its uncertainty. Interestingly, the enhanced radio emission matches morphologically the X-ray boundary at the opposite end of the “comet”. Table 1 summarizes the properties of these individual components of N157B.
Following the procedure outlined in Gotthelf & Wang (2000), we conducted period folding and phase-resolved imaging analyses of the HRC-S data. We detected a highly significant signal () near the expected period, at ms for Epoch 51756.291036808 MJD. We assumed a period derivative of for the Epoch of the data based on a phase-connected ephemeris derived from RXTE monitoring observations which span the Chandra Epoch (Middleditch 2001, personal communications). Our period measurement is in excellent agreement with the RXTE prediction, well within the expected uncertainty, confirming the timing accuracy of Chandra. Fig. 4 shows the resultant light-curve folded at the peak period. Consistent with the previous detections, the full width of the pulse is only .

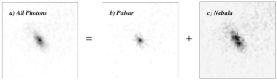
The phase-resolved imaging capability of the data allowed us to decompose the pulsed and unpulsed components. We constructed on- and off-pulse images (Fig. 5) by selecting data in the phase interval and the rest of the pulse profile (Fig. 4). The on-pulse image with the phase interval-normalized off-pulse image subtracted reproduced the expected PSF. The image was then scaled by a factor of 1.6 and subtracted from the off-pulse image to construct an image of the extended nebula emission (Fig. 5c) alone. This scaling, which minimizes the point-like contribution at the pulsar position, indicates that a substantial fraction of the pulsar’s X-ray emission may be unpulsed (Table 1) or that considerable amounts of X-ray emission arises in the region very close to the pulsar (), mimicking a point-like source. Fig. 5 illustrates a clear distinction between the spatially extended emission from the nebula and the point-like pulsed emission from the pulsar. This distinction is also apparent in Fig. 6, in which we present average radial intensity distributions around the pulsar.


Figs. 7a,b further demonstrate the average intensity distributions along two rectangular cuts. We choose our first box (25 ) to show the X-ray intensity along the long axis of the pulsar nebula. The position angle of the box is 39.2 degs (counterclockwise from the north; Fig. 3b). The long axis of the second box (335 ) is perpendicular to the first, to show the profile of the comet tail-shaped diffuse feature. Although the sharpness of the peaks is somewhat damped by the averaging, the figures allow for both appreciating the relatively intensities along the cuts and defining the boundaries of the three distinct components: the point-like source, the SW-NE elongated compact nebula around the source, and the comet tail-shaped large-scale diffuse feature (Table 1). In particular, the flat top plateau of the point-source subtracted nebula intensity profile has a half width of 12 (e.g., Fig. 7b). This width is not particularly sensitive to the uncertainty (a couple of tens percent) in the scaling of the above point-like source subtraction.
| Component | Count Ratea | Size and Shape | |
|---|---|---|---|
| Pulsar | |||
| pulsed | 5.8 | 0.8 | point-like |
| unpulsed | 9.2 | 1.2 | ” |
| Nebula (Torus) | 44 | 8.6 | ellipse |
| Diffuse Featurec | 71 | 15 | ellipse |
| SNR Shell | 150 | 17 | radius |
4 Comparison with Other Crab-like SNRs
A comparison of N157B with the Crab Nebula and SNR 0540-693 shows interesting similarities and distinctions. The spindown luminosities () of N157B, Crab, and SNR 0540-693 pulsars are comparable: 4.8, 4.7 and 1.5 (all in units of ). The compact X-ray nebulae around the pulsars of these remnants are also similar, in terms of both size and shape (Table 1), although the elongation of the N157B nebula is the strongest. Chandra images of the Crab Nebula show a tilted X-ray torus that is interpreted as synchrotron radiation from the shocked toroidal pulsar wind (Weisskopf et al. 2000). This structure resembles the X-ray-emitting rings which lie around the rotation equator of the nearby Vela pulsar (Helfand et al. 2001), although the latter is not as energetic (). The nonthermal nebula of SNR 0540-693 exhibits a very similar overall X-ray morphology to that of the Crab Nebula, though seen at a much larger distance (Gotthelf & Wang 2000). Thus, the strong elongation of the N157B nebula likely represents a nearly edge-on view of the shocked toroidal pulsar wind from PSR J0537-6910. The ratio of the minor to major axes of the nebula (Table 1) suggests that the toroidal wind fans out primarily within an opening angle of about the equator of the pulsar and sweeps a total solid angle of steradian.
Just like the Crab and Vela nebulae, the spin axis of the N157B pulsar is perhaps aligned approximately with the direction of its proper motion. Both the comet-like morphology (Fig. 3) and the position offset of the pulsar from the radio peak in the same direction as the orientation indicate that the pulsar is moving toward SE relative to the ambient medium (WG98). The direction is almost perpendicular to the elongation of the nebula, thus probably parallel to the spin axis of the pulsar.
N157B does show several distinct characteristics. First, the X-ray to spindown luminosity ratio of the N157B nebula () is much less than that of the Crab Nebula or SNR 0540-693 (both ; Chevalier 2000 and references therein). Even with the inclusion of the emission from the diffuse feature (Table 1), the ratio of N157B is still only about 0.5%. Second, the compact X-ray nebula in N157B is not associated with a distinct radio peak as in the Crab Nebula and in SNR 0540-693. Instead, the strong radio enhancement coincides spatially with the NW portion of the diffuse feature. Third, this very extended ( pc) nonthermal X-ray feature itself is the largest among all known Crab-like SNRs. Its nonthermal nature was determined from a joint ROSAT and ASCA data analysis (WG98). This conclusion is consistent with a recent off-axis Chandra ACIS image of the region, showing that the feature is prominent at energies greater than 2 keV (L. Townsley, 2000; private communications). The radio emission from the region is polarized (Lazendic et al. 2000), again indicating a nonthermal origin. What do these distinct characteristics tell us about N157B?
5 Nature of the N157B nebula
The bright, symmetric X-ray nebula surrounding the N157B pulsar evidently represents a PWN. In the following we argue that this nebula is pressure-confined as proposed in WG98. From Fig. 3a, it is seen that there is a offset between the pulsar and the radio peak, which presumably represents the synchrotron radiation from accumulated pulsar wind material. This offset, together with the age of the pulsar and the SNR (Marshall et al. 1998; WG98), suggests a proper motion of the pulsar as , which alone is greater than the sound speed of the SNR hot gas with a characteristic temperature of keV (WG98). Since SNR N157B coexists with a massive star forming region, the medium around the pulsar may be very clumpy, as indicated in Fig. 2. The pulsar could be moving through a local cooler and denser environment. In any case, it is the combination of the pulsar velocity and the environment that determines the morphology and X-ray emission of the PWN. The nebulae in both Crab and SNR 0540-693 apparently lack the right combination for them to be ram-pressure confined PWNs.
Let us now test whether this ram-pressure confined PWN interpretation could explain the observed X-ray morphology and luminosity of the N157B nebula. We can define a characteristic scale for a ram-pressure confined nebula by considering the shock radius of the pulsar wind (if confined primarily within the solid angle ), , where and are the density and mean particle mass of the ambient hot gas (WG98). The corresponding angular size of 12 is consistent with the half width of the flat top intensity distribution along the major axis of the point-source subtracted nebula (Fig. 7b; §3). Fig. 3a shows that the X-ray intensity contours, except for the highest levels, are largely asymmetric, relative to the major axis of the nebula. This is the morphological characteristics of a ram-pressure confined PWN. If the pulsar is moving towards SE along the minor axis, as is assumed in our interpretation, some asymmetry in the intensity distribution about the major axis might also be expected even at the highest levels, because the reverse shock should be closer to the pulsar (thus stronger) on the SE side than on the NW side of the nebula. This of course assumes a symmetry in the pulsar wind about the major axis. Fig. 7a shows indication of this asymmetry: there is a separate intensity peak, about 05 southeast of the primary peak (pulsar). The reverse shock on the SE side is expected to be closer to the pulsar than in the direction of the major axis. Therefore, the reverse shock in the direction of the pulsar motion may not be fully resolved. With uncertainties in both the counting statistics and the PSF of the instrument, however, the data do not allow for a clean separation of the shocked particle emission from the pulsar. The relation between the inner and outer radii of the nebula depends on the detailed MHD dynamics of shocked pulsar wind material, which is greatly uncertain theoretically. We thus adopt a characteristic path-length of particles before being driven out from the nebula as pc, the average of the observed inner and outer radii of the nebula. The escaping time of the particles from the nebula is then yrs with , the sound velocity in the relativistic plasma.
Following Chevalier (2000), we can estimate the synchrotron luminosity of the confined PWN, or the bow shock region of the extended diffuse feature. Specifically, we assume 1) the pulsar spindown power is equally divided between magnetic fields and particles in the shocked wind material, 2) these particles acquire a power law energy distribution with an index and the lower energy bound is determined by the pulsar wind speed (or the Lorentz factor ), and 3) the energy is radiated at the critical energy , where is the Lorentz factor of a particle and G is the magnetic field (assuming the equipartition). The integrated synchrotron spectrum is then a power law with an energy slope of . Assuming , the observed slope of the nonthermal emission from N157B (WG98) indicates . The synchrotron emission from the ram-pressure confinement nebula is limited by the above particle escaping time scale , which is shorter than the X-ray-emitting life-time of the particles , where is in units of keV. From the observed 0.2-4 keV band luminosity (; Table 1), we infer . This estimate of does depend on the assumed parameters, especially . Based on the X-ray spectrum of an integrated spectrum of N157B from the XMM-Newton X-ray Observatory, Dennerl et al. (2001) obtain a steeper power law component with , depending on their preferred spectral decomposition of thermal and nonthermal components. Adopting this value gives . Of course, the may vary with the position in the nebula, as the spectral steepening for synchrotron burn-off is expected (e.g., Slane et al. 2000). Assuming , a typical value for Crab-like nebulae, we find . Thus within such an uncertainty, our inferred is consistent with the value () estimated from the detailed modeling of the Crab Nebula (Kennel & Coroniti 1984).
In contrast, if the nebula in N157B were a normal PWN as in the Crab Nebula or SNR 0540-693, the inferred would be much smaller. By comparing the observed luminosity with the integration of Equation 9 of Chevalier (2000) over the keV range, we find , which is more than one order of magnitude lower than the inferred for the Crab pulsar. In this case, the synchrotron radiation of the particles is not limited by the escaping time as is in a ram-pressure confined PWN, but the observed X-ray luminosity represents only the high energy tail of the radiation spectrum. Most importantly, this PWN model of the N157B nebula would offer no explanation for the trailing nonthermal diffuse X-ray feature.
The ram-pressure confined PWN scenario provides a natural explanation for the nonthermal diffuse X-ray feature trailing the pulsar as well as its associated radio emission. The nonthermal spectrum represents the continuing synchrotron cooling of the particles escaped from the nebula. The pressure outside of the compact nebula should be comparable to that of hot gas in the SNR. Further assuming equipartition, we estimate the magnetic field as G, about an order of magnitude lower than in the nebula. Correspondingly, the X-ray-emitting lifetime of the particles is a factor of longer than for those in the compact nebula. The length of the diffuse emission feature ( pc) requires a particle transporting velocity of . This velocity can be achieved easily by the bulk outflow of shocked pulsar wind material from the compact nebula, but would be difficult for other mechanisms (e.g, diffusion). Furthermore, the bulk outflow is naturally one-sided, as observed. The outflow, after being terminated, feeds a bubble of pulsar wind material, which may be responsible for part of the diffuse emission feature (WG98). The observed radio peak represents the emission from pulsar wind material accumulated during the lifetime of PSR J0537-6910, whose age is smaller than the lifetime of radio-emitting particles. The low efficiency of radio emission, compared with X-ray radiation, naturally explains the lack of a strong radio peak at the nebula close to the pulsar, which has probably moved outside the bubble. The nebula represents the emission only from fresh particles just out of the pulsar.
In short, the ram-pressure confined PWN model is consistent with the existing data on N157B and provides a working scenario for understanding the pulsar wind and its interaction with the ambient medium. A detailed spatially-resolved X-ray spectroscopy, which can be provided by a deep on-axis Chandra ACIS observation, will be most useful for further testing the model, for tightening constraints on various parameters of the pulsar wind (e.g., ) and the shock acceleration of particles (e.g., ), and for determining the nature of various diffuse X-ray emission features of the SNR.
References
- (1) Chevalier, R. A., 2000, ApJL, 539, 45
- (2) Chu, Y.-H., et al. 1992, AJ, 103, 1545
- (3) Dennerl, K., et al. 2001, A&A, 365, L202
- (4) Gotthelf, E. V., & Wang, Q. D. 2000, ApJL, 532, 117
- (5) Helfand, D. J., Gotthelf, E.V., & Halpern, J. et al. 2001, ApJ, in press
- (6) Henize, K, G. 1956, ApJS, 2, 315
- (7) Kennel, C. F., & Coroniti, F. V. 1984, ApJ, 283, 710
- (8) Lazendic, J. S., et al. 2000, ApJ, 540, 808
- (9) Lucke, P. B., & Hodge, P. W. 1970, AJ, 75, 171
- (10) Marshall, F.E., Gotthelf, E.V., Zhang, W., Middleditch, J., & Wang, Q. D. 1998, ApJL, 499, 179
- (11) Murray, S. S., et al. 1997, SPIE, 3114, 11
- (12) Shaw, R., ed. 1998, HST Data Handbook, Version 3.1, Vol. I, (Baltimore; STScI)
- (13) Slane, P., et al. 2000, ApJL, 533, 29
- (14) Wang, Q. D., Li, Z.-Y., & Begelman, M. C. 1993, Nature, 364, 127
- (15) Wang, Q. D. 1995, ApJ, 453, 783
- (16) Wang, Q. D., & Gotthelf, E. V. 1998a, ApJ, 494, 623 (WG98)
- (17) Wang, Q. D., & Gotthelf, E. V. 1998b, ApJL, 509, 109
- (18) Weisskopf, M. C., O’Dell, S. L., & van Speybroeck, L. P. 1996, Proc. SPIE 2805, Multilayer and Gazing Incidence X-ray/EUV Optics III, 2.
- (19) Weisskopf, M., et al. 2000, ApJ, 536, 81