Magellanic Cloud Structure from Near-IR Surveys II:
Star Count Maps and the Intrinsic Elongation of the LMC
Abstract
I construct a near-IR star count map of the LMC and demonstrate, using the viewing angles derived in Paper I, that the LMC is intrinsically elongated. I argue that this is due to the tidal force from the Milky Way.
The near-IR data from the 2MASS and DENIS surveys are ideally suited for studies of LMC structure, because of the large statistics and insensitivity to dust absorption. The survey data are used to create a star count map of RGB and AGB stars. The resulting LMC image shows the well-known bar, but is otherwise quite smooth. Ellipse fitting is used for quantitative analysis. The radial number density profile is approximately exponential with a scale-length –. However, there is an excess density at large radii that may be due to the tidal effect of the Milky Way. The position angle and ellipticity profile both show large radial variations, but converge to and for . At large radii the image is influenced by viewing perspective (i.e., one side of the inclined LMC plane being closer to us than the other). This causes a drift of the center of the star count contours towards the near side of the plane. The observed drift is consistent with the position angle of the line of nodes inferred in Paper I.
The fact that differs from indicates that the LMC disk is not circular. Deprojection shows that the LMC has an intrinsic ellipticity in its outer parts, considerably larger than typical for disk galaxies. The outer contours have a more-or-less common center, which lies from the center of the bar. Neither agrees with the kinematic center of the HI gas disk. The LMC is elongated in the general direction of the Galactic center, and is elongated perpendicular to the Magellanic Stream and the velocity vector of the LMC center of mass. This suggests that the elongation of the LMC has been induced by the tidal force of the Milky Way.
The position angle of the line of nodes differs from the position angle of the line of maximum line of sight velocity gradient. Results from HI gas and discrete tracers indicate that –. This could be due to one or more of the following: (a) streaming along non-circular orbits in the elongated disk; (b) uncertainties in the transverse motion of the LMC center of mass, which can translate into a spurious solid-body rotation component in the observed velocity field; (c) an additional solid body rotation component in the observed velocity field due to precession and nutation of the LMC disk as it orbits the Milky Way, which is expected on theoretical grounds.
1 Introduction
The structure of the Magellanic Clouds has been a topic of intense study for many years (as reviewed by Westerlund 1997). This subject is of fundamental importance to several questions, including the study of the Galactic dark halo through modeling of the Magellanic Stream and the tidal disruption of the Magellanic Clouds (e.g., Moore & Davis 1994; Lin, Jones & Klemola 1995; Gardiner & Noguchi 1996) and the study of compact objects in the dark halo through microlensing studies (e.g., Alcock et al. 2000; Lasserre et al. 2000; Udalski et al. 1999). The structure of the Large Magellanic Cloud (LMC) in particular has been studied by many authors, using almost every possible tracer, including: optically detected starlight (de Vaucouleurs & Freeman 1973; Bothun & Thompson 1988; Schmidt-Kaler & Gochermann 1992); stellar clusters (Lynga & Westerlund 1963; Freeman et al. 1983; Kontizas et al. 1990; Schommer et al. 1992); HII regions, supergiants, or planetary nebulae (Feitzinger, Isserstedt & Schmidt-Kaler 1977; Meatheringham et al. 1988); carbon stars (Kunkel et al. 1997; Graff et al. 2000; Alves & Nelson 2000); red giants (Zaritsky & Lin 1997; Zaritsky et al. 1999); HI emission (McGee & Milton 1966; Rohlfs et al. 1984; Luks & Rohlfs 1992; Kim et al. 1998); or non-thermal radio emission (Alvarez, Aparici & May 1987).
Recently, two important near-IR surveys have become available for studies of the Magellanic Clouds, the Two Micron All Sky Survey (2MASS; e.g., Skrutskie 1998) and the Deep Near-Infrared Southern Sky Survey (DENIS; e.g., Epchtein et al. 1997). These surveys are perfect for a study of LMC structure. Near-IR data is quite insensitive to dust absorption, which is a major complicating factor in optical studies (Zaritsky, Harris & Thompson 1997; Zaritsky 1999). The surveys have superb statistics with of the order of a million stars. Also, the observational strategy with three near-IR bands (, and in the 2MASS survey; , and in the DENIS survey) allows clear separation of different stellar populations. In particular, the data are ideal for studies of evolved Red Giant Branch (RGB) and Asymptotic Giant Branch (AGB) stars, which emit much of their light in the near-IR. This is important for studies of LMC structure, because these intermediate-age and old stars are more likely to trace the underlying mass distribution of the LMC disk than younger populations that dominate the light in optical images (e.g., de Vaucouleurs & Freeman 1973). The present paper is the second in a series of studies of the Magellanic Clouds using the near-IR 2MASS and DENIS surveys. The series focuses on the structure of the Clouds, and addresses topics that are either different or more in-depth than previous work with the same data sets (Cioni, Habing & Israel 2000b; Cioni et al. 2000c; Nikolaev & Weinberg 2000; Weinberg & Nikolaev 2000).
The generally accepted consensus on the structure of the LMC is that it is an approximately planar galaxy that is circular at large radii. At smaller radii there is an off-center bar. The planarity of the LMC is supported by a large body of evidence, as reviewed in Section 9.3 of Paper I (van der Marel & Cioni 2001). It has been a topic of debate whether the LMC contains secondary populations that do not reside in the main disk plane (e.g., Luks & Rohlfs 1992; Zaritsky & Lin 1997; Zaritsky et al. 1999; Weinberg & Nikolaev 2000; Zhao & Evans 2000; this issue will be further addressed in Paper III, van der Marel 2001), but the planar geometry of the primary LMC population is not generally called into question. On the other hand, the consensus that the LMC disk is circular (at large radii) is based entirely on assumptions, and has never been tested. The projected shape and kinematics of the LMC are determined both by the intrinsic shape of the LMC, and the angles under which it is viewed (the inclination angle , and the position angle of the line of nodes). Almost all existing studies have assumed that the LMC disk is circular, to obtain estimates of the viewing angles (see the review of this subject in Paper I).
However, there exists an alternative, and much more accurate method to estimate the LMC viewing angles. It does not make any assumptions about the intrinsic shape of the LMC, but merely uses simple geometry. Because the LMC plane is inclined with respect to the plane of the sky, one side of it is closer to us than the other. This causes sinusoidal variations in the apparent brightness of LMC tracers as a function of position angle on the sky. In Paper I we sought such variations in the apparent magnitude of features in the near-IR color-magnitude diagrams (CMDs) extracted from the DENIS and 2MASS surveys. The expected sinusoidal variations are confidently detected with a peak-to-peak amplitude of mag; they are seen both for AGB stars (using the mode of their luminosity function) and for RGB stars (using the tip of their luminosity function), and are seen consistently in all three of the photometric bands in both surveys. The inferred viewing angles are and (defined such that the near side of the LMC is at ). The inclination angle is consistent with previous estimates. However, the line-of-nodes position angle is not. Photometric and kinematic studies have generally found that the major axis position angle of the spatial distribution of tracers on the sky, and also the position angle of the line of maximum gradient in the LMC velocity field, fall somewhere in the range –. For a circular disk one would expect that . Consequently, the LMC disk cannot be circular, but must be elongated.
The present paper addresses the nature and origin of the intrinsic elongation of the LMC disk. Section 2 presents a map of the stellar number density of RGB and AGB stars on the projected plane of the sky. Section 3 presents a quantitative analysis of this map using ellipse fitting to the number density contours. Section 4 presents a deprojected face-on map of the LMC, obtained with the viewing angles from Paper I; this map too is analyzed using ellipse fitting. Section 5 describes the influence of viewing perspective on the appearance of the LMC on the projected plane of the sky. Section 6 discusses the inferred intrinsic elongation of the LMC, and the evidence that it might have been tidally induced. Section 7 address the observed kinematics of the LMC in the context of our new knowledge of LMC structure. Section 8 summarizes the main findings.
2 Sky Maps of the Stellar Number Density
2.1 Coordinates and Map Creation
I use the near-IR stellar catalogs compiled by the 2MASS and DENIS surveys to create maps of the stellar number density on the sky. There are many ways to project the surface of the celestial sphere onto a plane (e.g., Calabretta 1992). The present analysis uses the so-called ‘zenithal equidistant projection’. The projection origin with celestial coordinates is chosen to be at RA = and DEC = (here and henceforth all coordinates are J2000.0). This corresponds roughly to the center of the outer number density contours of the LMC; however, the exact choice of the projection origin is fairly arbitrary and does not affect any of the subsequent analysis at a significant level. Angular coordinates are defined on the celestial sphere, where is the angular distance between a point and the origin , and is the position angle of the point with respect to the origin; by convention, is measured counterclockwise starting from the axis that runs in the direction of decreasing RA at constant declination . The coordinates can be calculated for any using the formulae of spherical trigonometry (see Paper I). Cartesian projection coordinates are defined according to
| (1) |
The positive -axis points West, and the positive -axis points North, in agreement with the usual astronomical convention.
For each star in a given list the projection coordinates can be calculated from the known celestial coordinates . The stars are then binned into square pixels of size . The solid angle that a pixel subtends on the sky is the integral over , which can be approximated as . The number of stars in a pixel is divided by its solid angle to obtain , the observed number density of stars per square degree. The resulting maps are smoothed using a Gaussian with a dispersion of 1 pixel () to reduce noise.
2.2 Correction for Distance Bias
Stellar surveys are generally complete only to a certain limiting magnitude. This causes a distance bias in number density maps, especially for large nearby galaxies such as the LMC. The plane of the LMC is inclined with respect to the plane of the sky, and stars on the near side of the LMC plane appear brighter than those on the far side (see Paper I for a detailed analysis of this effect). Consequently, a catalog that is limited to a fixed apparent magnitude contains intrinsically fainter stars on the near side of the LMC than on the far side. This artificially boosts the observed number density on the near side.
The LMC viewing angles determined in Paper I can be used to correct for this bias. Let a star be observed at position with apparent magnitude . If it is assumed that the star resides in the plane of the LMC, then the formulae of Paper I allow one to calculate the ratio of the distance to the star and the distance to the LMC center. One can then also calculate the ‘distance-corrected apparent magnitude’ . This is the apparent magnitude that the star would have had at the distance . In the following I correct for distance biases by restricting the samples to stars for which the distance-corrected apparent magnitude is brighter than some fixed cutoff magnitude . The cutoff magnitude is chosen such that is brighter than the survey magnitude limit for the entire LMC area (within which mag, cf. Figure 1 of Paper 1).
While the correction for distance bias in the sample selection improves the quality of the analysis, the results were not found to be critically dependent on this correction. Even without application of the correction all the main results of the present paper still hold.
2.3 Selection of RGB and AGB stars
Both the 2MASS and DENIS survey obtained data in three near-IR bands. The color-magnitude diagrams that can be constructed from these data allow one to select stars in particular evolutionary phases. Weinberg & Nikolaev (2000) used 2MASS data to show star count maps for various groups of stars in the CMD. Cioni, Habing & Israel (2000b) used DENIS data to show star count maps for various groups of stars in the CMD. The primary goal of the present paper is to quantitatively study the structure of the LMC. In this context one is not so much interested in young stars and the regions of star formation, but more in the underlying mass distribution. The latter is best traced by intermediate-age and old stars, and in particular stars in the RGB and AGB evolutionary phases. The analysis is therefore restricted to these stars.
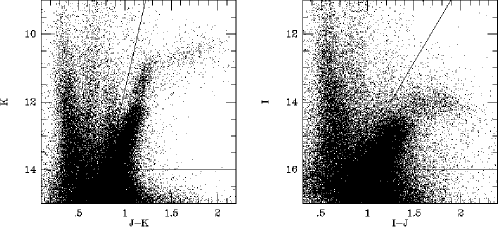
Separate LMC number density maps were created from the 2MASS and DENIS data. For 2MASS I used the Second 2MASS Incremental Data Release. Sources were extracted from the 2MASS Point Source Catalog that are in the LMC region of the sky, restricting the extraction to those stars detected in all three of the 2MASS bands with no special error flags. Figure 1a shows the CMD. Nikolaev & Weinberg (2000) presented a detailed discussion of the general features of this CMD. They divided the CMD in disjunct areas, and discussed the stellar types that contribute most to each area. The solid lines in Figure 1a mark the boundary of the region within which I used stars to create an LMC number density map. This region encompasses the regions named E, F, G, J, and K by Nikolaev & Weinberg (2000), plus small parts of D and L. It consists almost exclusively of RGB and AGB stars in the LMC, with at the faintest magnitudes possibly a small contamination by Galactic dwarfs and background galaxies. A distance-corrected apparent magnitude limit was applied.
For DENIS I used the DENIS Catalog towards the Magellanic Clouds (DCMC; Cioni et al. 2000a), with the improved photometric zeropoint calibration discussed in Paper I. Sources were extracted that were detected in the and bands, independent of whether or not they were detected in . Sources with non-optimal values of any of the DCMC data-quality flags were not excluded, to optimize the statistics of the sample. Figure 1b shows the CMD, which was discussed previously in Cioni et al. (2000a,b,c) and Paper I. The solid lines mark the boundary of the region within which I used stars to create an LMC number density map. This region encompasses the regions named B and C by Cioni et al. (2000b), in which RGB and AGB stars are again believed to be the main contributors. A distance-corrected apparent magnitude limit was applied. RGB stars with have (see Figure 2 of Paper I), so the samples extracted from the 2MASS () and DENIS data () have roughly similar depth.
2.4 Resulting Maps
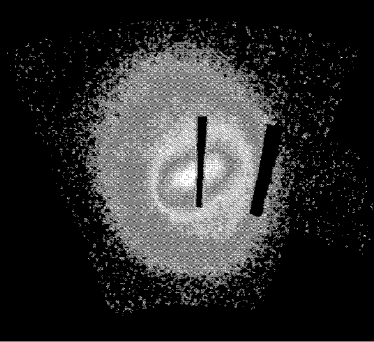
Figure 2a shows the number density distribution inferred from the 2MASS data. The two dark vertical rectangles are regions for which no data is available in the 2MASS Second Incremental Data Release. Otherwise the 2MASS map looks very smooth and regular, with no evidence for obvious artifacts.
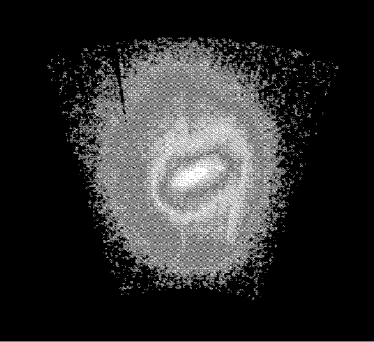
Figure 2b shows the surface number density distribution inferred from the DENIS data. There are no missing regions for this data set, but the map does show some artifacts in the form of features along lines of constant declination (which run close to vertical). The LMC area in the DCMC consists of 119 individual scan strips that are 12 arcmin wide in RA and long in declination (e.g., Cioni et al. 2000a). The artifacts in the map are the result of imperfections in the catalog data for some (%) of the individual scan strips.
The Galactic foreground contribution was estimated for each map by fitting a linear number density distribution to the data in areas of approximately one square degree in the four corners of each map. These foreground contribution models were subtracted.
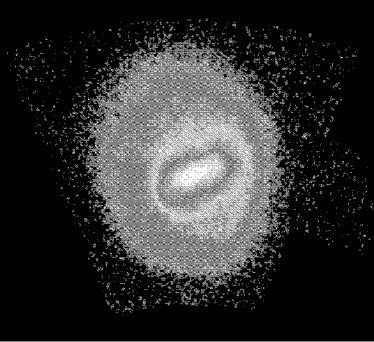
The foreground-subtracted LMC maps from the 2MASS and DENIS surveys agree very well, despite the somewhat different CMD selection criteria for the two surveys. Blinking of the two maps on a computer screen shows good agreement in both large-scale and small-scale features (with the exception of the missing regions and artifacts discussed above). It is therefore justified to combine the two maps into one higher quality map. To create such a map I started from the 2MASS map, which appears to have the highest cosmetic quality. The regions with missing 2MASS data were then filled in using the data in the DENIS map. The latter were first scaled to the same average surface number density as the 2MASS data, which is necessary because the CMD selection criteria were different for the two maps (cf. Figure 1). Figure 2c shows the combined map, which forms the basis for the subsequent discussions.
2.5 Near-IR Morphology of the LMC
The morphology of the LMC has been discussed by many previous authors (e.g., Westerlund 1997). The most obvious structure is of course the central bar, which is clearly visible in the near-IR map in Figure 2c. de Vaucouleurs & Freeman (1973) identified various morphological features in the LMC from deep optical images, and listed several irregular, asymmetric and ‘embryonic’ spiral arms, and an outer loop. Some of these features are also visible in the near-IR map (especially when viewed in various contrasts on a computer screen). At the eastern end of the bar there is a feature, termed ‘B3’ by de Vaucouleurs & Freeman, which winds counterclockwise by around the center. At the western end of the bar there is a weaker but longer feature termed ‘B1’ that winds counterclockwise by . These and other fainter features give the LMC morphology some hints of spiral structure. However, all of these features have very low contrast with respect to their surroundings, and there is certainly no well organized spiral pattern in the LMC. In fact, the most noticeable feature of the near-IR map in Figure 2c is really the smoothness of the LMC number density distribution for these intermediate-age and old stars. This was noticed previously by e.g., Cioni et al. (2000b) and Weinberg & Nikolaev (2000), and stands in stark contrast with the much more irregular and clumpy distribution of, e.g., younger stars and HII regions in the LMC (Westerlund 1997). This property makes the near-IR AGB/RGB map well-suited for quantitative analysis.
3 Ellipse Fit Analysis of the Sky Map
To analyze the observed number density distribution I used the task ‘ellipse’ in the IRAF STSDAS package, which fits ellipses to the isodensity contours. The task is based on the algorithm described in Jedrzejewski (1987). It assumes that each contour can to lowest order be well approximated by an ellipse, which was found to be an adequate assumption (the higher-order Fourier coefficients for the LMC are no larger than a few percent). The ellipse center was not kept fixed, but was fit separately for each contour; so it is not assumed that the LMC is symmetric (which it is not). Figure 3 shows the parameters of the best-fitting ellipses for the combined 2MASS+DENIS map shown in Figure 2c. The radius along the abscissa is the semi-major axis length of an ellipse in the projected coordinates defined by equation (1).
The subsequent discussions and analysis are restricted to the combined 2MASS+DENIS map. However, a similar ellipse fit analysis was also performed for the 2MASS and DENIS maps separately. Although these analyses are complicated by the missing regions (2MASS) and artifacts (DENIS) in these maps, they do yield results that are fully consistent with each other and with the results from the combined map (especially for the outer contours, for which small scale irregularities tend to have little influence). All main the results reported in this paper are robust, and are seen in both surveys.
3.1 The Radial Number Density Profile
Figure 3a shows the radial number density profile, which declines monotonically with radius. The dashed line shows the best fitting exponential profile, , which has scale length . At the distance of the LMC (), 1 degree on the sky corresponds to , so that this corresponds to .
While an exponential model can be fit to the data, it does not provide a very good description. The data show clear deviations from the best fit model. At intermediate radii, , the brightness profile falls steeper than at both smaller and larger radii. An exponential model fit to this radial range yields . At a radius the number density has an upturn, and beyond this radius falls slower than at smaller radii. An exponential model fit to the radial range yields . At radii the number density starts falling more steeply again. At the density has fallen to one-third of the Galactic foreground contribution that was subtracted from the map (dotted line in Figure 3a).
3.2 The Ellipticity and Position Angle Profiles
Figures 3c,e show the radial profiles of the ellipticity (defined as , where is the axial ratio) and the major axis position angle (measured counterclockwise from North, defined modulo ). Both profiles show pronounced variations as function of distance from the LMC center.
The morphology out to is dominated by the bar, which has a position angle that falls from at to at , before it starts to rise again. The ellipticity of the bar first rises from at to at , and then falls again to lower values.
The region marks the smooth transition between the bar and the outer morphology. In this region the ellipticity shows a pronounced drop, and twists by .
At radii the contour shapes converge to an approximately constant position angle and ellipticity. The RMS variations in position angle and ellipticity at are and , respectively. The average values and their formal errors over this radial range are and .
3.3 The Drift of the Contour Center
The center of a fitted ellipse is denoted . Figures 3b,d show the radial profiles of and . Figure 3f shows how drifts in the projected plane of the sky as the semi-major axis length of the contours changes.
The center is measured with respect to the origin of the zenithal equidistant projection defined by equation (1), which was chosen to be at RA = and DEC = . The maximum surface density, determined as the average center of the inner few contours, occurs at , with an error of approximately in both coordinates. This corresponds to RA = and DEC = .
The bar does not have a fixed center, and nor do the outer contours. Starting from the position of maximum surface density, the center of the bar first drifts West by until the semi-major axis length has increased to , and it then drifts back East by a similar amount until the semi-major axis length has increased to . For the outer contours the center drifts to the North-North-East. The drift of the outer contours can be explained as the result of viewing perspective, as discussed in Section 5. The center of the outermost contour at is displaced by from the center of the bar.
3.4 Comparison to previous work
A large number of results on the morphology and structure of the LMC are available from previous work, using a variety of tracers (see references in Section 1). While every tracer has its pros and cons, none of these previous studies has had all the important positive attributes of the present study, namely: (a) insensitivity to dust due to the use of near-IR data; (b) clear separation of the intermediate-age and old stellar populations that are most likely to trace the underlying mass distribution of the LMC disk; and (c) superb statistics with approximately a quarter of a million individual tracers. The present analysis therefore allows us to address the LMC morphology and its radial dependence in a way that few if any previous studies could.
Previous authors have generally found the major axis position angle and ellipticity of tracer distributions in the main body of the LMC to be in the ranges – and –. These results are not inconsistent with those presented here, which yield at radii that and (cf. Section 3.2). Figure 3 shows that the LMC has considerable radial gradients in both its position angle and ellipticity, so the sizeable differences between the results from different authors may well be due to the fact that they studied tracers at different radii. de Vaucouleurs & Freeman (1973) found the optical center of the bar to be at RA = and DEC = (J2000.0). This agrees with the center inferred in Section 3.3 to within , i.e., less then three pixels in our map. Bothun & Thompson (1988) determined an exponential scale length from a -band surface brightness profile, not dissimilar to the value found in Section 3.1.
Weinberg & Nikolaev (2000) previously used the same 2MASS data that are used here to study the structure of the LMC. Their estimates of the center, ellipticity, position angle and exponential disk scale length agree in some globally averaged sense with the ones obtained here. However, a detailed comparison is not possible because they restricted their analysis to fits of either circular exponential disks models or spherical power-law models. Such models yield only limited insight because they have fixed centers, projected ellipticities and position angles. Instead, it is evident from Figure 3 that all of these quantities actually have large gradients in the LMC. In addition, I will show that the LMC is quite non-circular (Section 4.3 below).
4 The Deprojected Stellar Number Density
In addition to studying the number density distribution in the plane of the sky, as done in the preceding sections, one can also deproject the data to obtain the number density distribution in the plane of the LMC itself.
4.1 Coordinate Systems
As in Paper I, I define a cartesian coordinate system such that the -plane contains the LMC disk and the -axis is along the line of nodes (the intersection of the -plane and the plane of the sky). The LMC plane is inclined with respect to the sky plane by an angle (with face-on viewing corresponding to ), and the position angle of the line of nodes (measured counterclockwise from North) is . The near side of the LMC plane lies at and the far side at .
To calculate the position of a star in the coordinate system one needs both the position on the sky and the distance . However, one does not know the distances to individual stars. On the other hand, the LMC disk is believed to be thin (see the discussion in Section 9.3 of Paper I) so that one can assume approximately that . Combination of equations (7) and (8) from Paper I then yields
| (2) |
where is the distance to the LMC center. In practice it is useful not to use the coordinate system in the LMC disk plane, but a new system that is rotated by an angle :
| (3) |
For completeness, I define a coordinate that is identical to . With these definitions the line of nodes lies at the same angle in the plane of the LMC as in the projected plane of the sky (defined in Section 2.1). The coordinates and all scale linearly with the galaxy distance .
4.2 Map Creation and Results
For the creation of a face-on map of the LMC I proceeded similarly as in Section 2. The same stars were selected from the DENIS and 2MASS surveys as before. For each star, equations (4.1) and (4.1) were used to obtain the coordinates in the plane of the LMC, given the angular coordinates on the plane of the sky (calculated from as in Section 2.1) and the viewing angles that were determined in Paper I. The stars were then binned into square pixels of size . In the limit of small , and along the line-of-nodes, this choice yields the same pixel size as for the sky maps discussed in Section 2. For the pixel size is . The number of stars in a pixel was divided by its area to obtain , the number density of stars per unit area. Since it was assumed that all stars have , whereas in reality the LMC disk has a finite thickness, is best thought of as the three-dimensional density of the LMC projected perpendicular to the disk plane, and viewed from that same direction.
As before, maps were smoothed using a Gaussian with a dispersion of 1 pixel to reduce noise. A linear fit to the data in the corners of each map was used to estimate and subtract the Galactic foreground contribution. A combined map was created from the 2MASS and the DENIS data as before, by using the DENIS data (scaled appropriately) to fill in the regions that are missing from the 2MASS data.
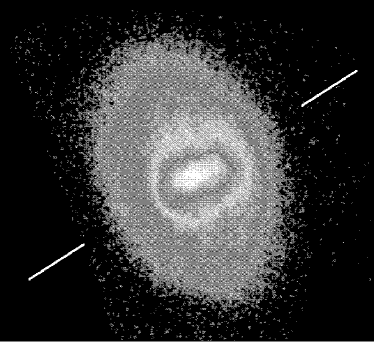
Figure 2d shows the resulting face-on map of the LMC. The most obvious characteristic of the map is that the LMC is quite elongated in its disk plane, and is not close to circular at all. This is further discussed below.
To understand the relation of the face-on map to the sky projection map shown next to it in Figure 2c, note that the line of nodes (indicated by white line segments) lies at the same angle in both panels. The sky projection map is obtained conceptually from the face-on map by rotating the latter around the line of nodes through an angle , such that the top left part of the map is tilted out of the paper.
4.3 Ellipse Fit Analysis
For quantitative interpretation of the face-on deprojected map I used the same procedure of ellipse fitting as before. Figure 4 shows the parameters of the best-fitting ellipses. The radius along the abscissa is the semi-major axis length of an ellipse in the coordinates of the LMC plane defined in Section 4.1.
Figure 4a shows the radial number density profile. The dashed line shows the best fitting exponential profile, which has scale length . As before, an exponential model does not provide a very good description of the LMC. In the range the surface density shows a pronounced deficit compared to the best exponential fit, and for there is an excess number density compared to the fit.
Figures 4c,e show the radial profiles of the ellipticity and the major axis position angle (measured counterclockwise from the -axis, defined modulo ). These profiles have the same qualitative behavior as the quantities and that describe the sky-projection map. At radii the contour shapes converge to an approximately constant position angle and ellipticity. The RMS variations in position angle and ellipticity at are and , respectively. The average values and their formal errors111The quoted errors do not include the propagated influence of errors in the adopted LMC viewing angles. Changes in the viewing angles will cause changes in both and . However, the errors in the viewing angles are small enough that they do not influence any of the main results of this paper in a qualitative sense. over this radial range are and .
The center of a fitted ellipse is denoted . Figures 4b,d show the radial profiles of and . Figure 4f shows how drifts in the plane of the LMC as the semi-major axis length of the contours changes. At radii the qualitative behavior is similar as for the quantities that describe the sky-projection map. However, at larger radii the behavior is different. In the face-on map the contour centers in the region are all quite close together (RMS positional difference ), indicating that the outer contours have more or less a common center in the LMC disk plane. By contrast, in the sky-projection map the center of the outer contours drifts to the North-North-East. This can be explained as the result of viewing perspective, as discussed below.
5 The Influence of Perspective on the Sky Map
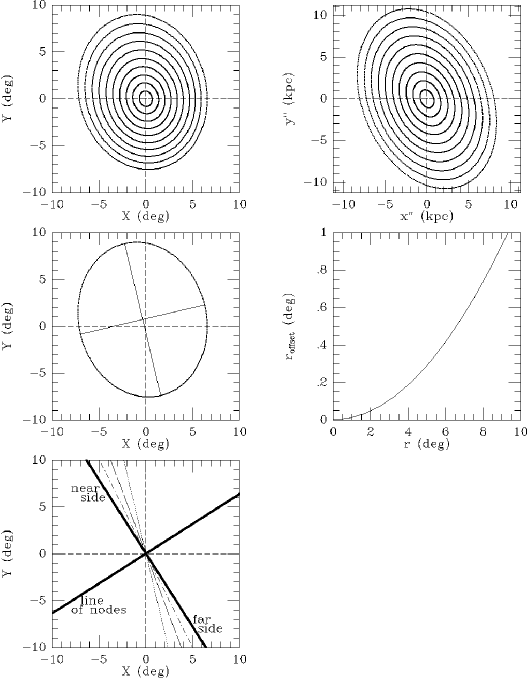
Perspective plays an important role in our view of the LMC, due to its large angular extent on the sky. To illustrate this, consider a set of ellipses in the plane of the LMC, centered on the origin. The ellipses are chosen to be concentric, and to have a fixed position angle and ellipticity , as appropriate for the outer contours in the LMC disk plane (cf. Section 4.3). Figure 5b shows the ellipses for a range of semi-major axis lengths. The discussions in Sections 2.1 and 4.1 showed how the coordinates are obtained from the projected coordinates on the plane of the sky. The resulting formulae can be inverted numerically to obtain for given . Figure 5a shows the sky projection of the ellipses shown in Figure 5b, obtained using this inversion.
The projections in the sky plane are well fitted by pure ellipses without higher-order deviations. The major axis position angle and ellipticity are and , with negligible dependence on the semi-major axis length. However, the projections are not concentric on the plane of the sky, due to the effect of perspective. The near side of an ellipse in the plane of the LMC subtends a larger angle on the sky than the far side. This causes a distortion in the projected shape that manifests itself as an apparent shift of the center towards the near side. This is clearly seen in Figure 5c, which shows the projection of the outermost ellipse in the plane, together with the major and minor axis of the ellipse that best describes it. The center is offset from the center of the inner contours by . Figure 5d shows how the distance by which the center shifts depends on the semi-major axis length. The offset is in the direction of , with almost negligible dependence on the semi-major axis length. This is between the position angle towards the near side of the LMC (Paper I) and the position angle to which the intrinsic major axis of the LMC projects. Note that the latter is not identical to the major axis of the ellipse projections on the sky, which is at . Figure 5e schematically shows the directions of these variations position angles.
In practice one does not study the projected shape of elliptical rings in the LMC plane, but the shapes of contours of equal number density. There is then a second effect that plays a role. A fixed area on the near side of the LMC disk plane subtends a larger solid angle on the sky than an area of the same size on the far side of the disk plane. As a result, the projected number density per square degree is boosted on the far side of the disk relative to the near side of the disk. This ‘solid-angle effect’ tends to shift the center of the projected contours of in the opposite direction as the perspective effect discussed above. Which of the two effects dominates depends on the detailed radial dependence of the number density (per square kpc) in the LMC disk plane. In simple approximation one may assume that follows an exponential distribution with a scale length of (cf. Section 4.3). Calculations then show that the perspective effect and the solid-angle effect approximately cancel each other for contours with semi-major axis length . The perspective effect dominates at large radii, with an expected shift in the center of the projected number density contours by about in the direction of when the semi-major axis length increases from to .
In practice there is no need to model these effects in approximate fashion, since the position of each star can be deprojected individually, as was done in Section 4. However, the above arguments do provide valuable insight into the details of the ellipse fits results shown in Figures 3 and 4. In particular, at radii the contour center stays more or less fixed in the deprojected face-on map. At the same radii, the contour center on the sky drifts in a direction that is consistent with the value predicted by the perspective effect (this direction is indicated with an arrow in Figure 3f).
At radii the contour centers drift in a qualitatively similar way in the projected sky map and the deprojected face-on map. The size of this drift is considerably more than can be attributed to the perspective effect, independent of the assumed viewing angles of the LMC. It must therefore be intrinsic, and hence, the bar region of the LMC is lopsided, both intrinsically and in projection. This lopsidedness is due primarily to the faint spiral arm features named ‘B1’ and ‘B2’ by de Vaucouleurs & Freeman (1973), which extend in opposite directions from the western end of the bar. These features cause an overall movement of the contour centers in the westward direction for semi-major axis lengths increasing up to , followed by a return in the eastward direction for larger contours that are not affected by the B1 and B2 features.
It is a generic prediction of models for the LMC that the center of the outermost number density contours on the sky should drift in the general direction of the near side of the LMC disk plane. As discussed in Paper I, many previous authors have believed that the LMC is approximately circular with the line of nodes coincident with the observed major axis position angle () and the near side of the LMC plane at position angle . If this were true, then the center of the outermost number density contours on the sky should have drifted approximately Eastward, which is not observed. While one could assume that the outer LMC is intrinsically lopsided in such a way as to counterbalance this, Occam’s razor suggests that this is not the preferred solution. Instead, the observed drift is exactly in the direction suggested by the viewing angles in Paper I, and therefore is best interpreted as an independent confirmation of those viewing angles.
6 The Elongation of the LMC Disk
6.1 The Intrinsic Shapes of Disk Galaxies
While the line of nodes for the LMC lies at position angle (cf. Paper I), the major axis position angle of the outer number density contours lies at (cf. Section 3.2). The fact that the major axis doesn’t coincide with the line of nodes implies that the LMC is not intrinsically circular at large radii. Indeed, deprojection shows that the outer contours have an intrinsic ellipticity (cf. Section 4.3).
The conclusion that the LMC is elongated is in itself not surprising. It is generally expected that disk galaxies are elongated rather than circular. It is possible to construct self-consistent dynamical models for elliptical disks (e.g., Teuben 1987), and it is known that bars and other planar non-axisymmetric structures are common in disk galaxies. The dark matter halos predicted by cosmological simulations are generally triaxial (e.g., Dubinski & Carlberg 1991), and the gravitational potential in the equatorial plane of such halos does not have circular symmetry.
The ellipticity of disk galaxies has been a subject of increasing study in recent years. Studies of the apparent axis ratio distribution of spiral galaxy disks (Binney & de Vaucouleurs 1981; Lambas, Maddox & Loveday 1992) of individual galaxies (Rix & Zaritsky 1995; Schoenmakers, Franx & de Zeeuw 1997; Kornreich, Haynes & Lovelace 1998; Andersen et al. 2001) and of the scatter in the Tully-Fisher relation (Franx & de Zeeuw 1992) indicate that the average (deprojected) ellipticity of spiral galaxy is –10%. So while spiral galaxies are generally elongated, their elongation is usually smaller than inferred here for the LMC. Note however that Andersen et al. (2001) found two spiral galaxies in their sample with fairly large elongations (); interestingly, both these galaxies are reported to show faint interacting companions. Also, it should be kept in mind that galaxies of type Sm and Im are (by definition) more irregular and lopsided than spirals (de Vaucouleurs & Freeman 1973). So it is not a priori clear whether or not the LMC is atypically elongated for its Hubble type.
6.2 Evidence for Tidal Effects in the LMC
The most logical explanation for the large elongation of the LMC appears to be that its shape has been distorted through its tidal interactions with the Galaxy and/or the SMC, for which there is a variety of evidence. In its central the LMC has a pronounced bar, and it is well known that bar formation can be triggered by interactions (e.g., Gerin, Combes & Athanassoula 1990; Barnes 1998). The bar is significantly lopsided, cf. Figure 4f. Observational studies have demonstrated that lopsidedness is not uncommon in spiral galaxies (Baldwin, Lynden-Bell & Sancisi 1980; Rix & Zaritsky 1995), and that this lopsidedness is generally caused by lopsidedness of the underlying mass distribution, and not merely by recent star formation (Rudnick & Rix 1998; Swaters et al. 1999). Interactions are believed to be the dominant mechanism for triggering this lopsidedness (Zaritsky & Rix 1997). At large radii the Magellanic Stream (e.g., Brüns, Kerp & Staveley-Smith 2000) and the more recently discovered Leading Arm (Putman et al. 1998) provide ample evidence for the tidal interaction between the Milky Way and the Magellanic Clouds (e.g., Gardiner & Noguchi 1996).
It is worth noting in this context that the LMC number density profile shown in Figure 4a has an upturn at , beyond which the density shows an excess over the best-fit exponential model. This may well be another tidally induced feature of the LMC. Numerical simulations of satellite tidal disruption naturally produce upturns that are qualitatively similar to that seen in the LMC (e.g., Johnston, Spergel, & Hernquist 1995).
6.3 The Tidal Influence of the Milky Way
Weinberg (2000) has recently stressed the importance of the Galactic tidal field for the structure of the LMC. He estimates that the tidal radius of the LMC is , but that at from the center the ratio of the tidal force to the self-force has dropped by only %. Tidal effects are therefore expected to influence LMC structure well inside the tidal radius. Weinberg stressed primarily the fact that vertical thickening of the disk results from tidal forces, but one would also expect an in-plane elongation to be induced. Quantitative estimates for the induced elongation are not readily available. However, to lowest order one would expect the main body of the LMC to become elongated in the direction of the tidal force, i.e., towards the Galactic Center. Material that is tidally stripped will phase mix along the orbit (e.g., Johnston, Hernquist & Bolte 1996). For an orbit that is not too far from being circular, the direction along the orbit is perpendicular to the direction towards the Galactic Center. Hence, one expects the elongation of the main body to be perpendicular to any tidal streams that emanate from it. This generic feature of satellite disruption is often seen both in numerical simulations (e.g., figure 3 in Johnston 1998; figure 2 in Helmi & White 2001) and in observations (e.g., figure 3 of Odenkirchen et al. 2001, for the case of the globular cluster Pal 5). Of course, in reality matters are complicated for the LMC by the fact that its orbit is not circular (Weinberg (2000) estimates that the ratio of the apogalactic and perigalactic distance is , with the LMC currently being near pericenter) and by the fact that the Galactic Center does not lie in the plane of the LMC disk (see below). Nonetheless, it appears reasonable to assume that one should generically expect in any model in which the LMC elongation is induced by the tidal force of the Milky Way that: (a) the disk elongation should point roughly towards the Galactic Center (or its projection onto the disk plane); and (b) the disk elongation should be roughly perpendicular to any tidal streams from the LMC (or their projection onto the disk plane).
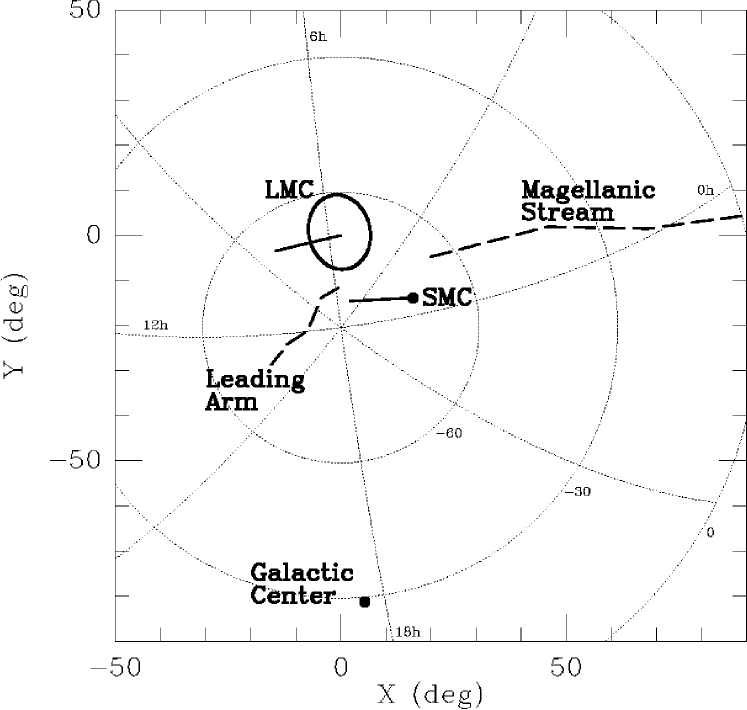
Figure 6 shows a schematic representation of the main features of the Magellanic system as seen on the projected plane of the sky. The LMC is represented as an ellipse with the size, ellipticity and position angle of the outermost contour in the near-IR map shown in Figure 2c. The proper motion vectors for the LMC and the SMC show that these galaxies move in more or less parallel directions (Kroupa & Bastian 1997). The Magellanic Stream trails the LMC and the SMC, and as expected, is aligned roughly parallel with their proper motions. The Leading Arm makes an angle with the Magellanic Stream in agreement with model predictions for the tidal origin of both features (Gardiner & Noguchi 1996). On the sky, as seen from the center of the LMC, the Galactic Center lies at a position angle of (at a distance from the LMC). The outer contours of the LMC near-IR starcount map have major axis position angle , cf. Section 3.2. The projected elongation of the LMC is therefore aligned to within with the projected direction to the Galactic Center. The proper motion of the LMC is in the direction of position angle , which is also more or less the direction of the Magellanic Stream. This is perpendicular to within the errors. Given the above arguments, these results are consistent with the hypothesis that the elongation of the LMC is induced by the tidal force of the Milky Way.
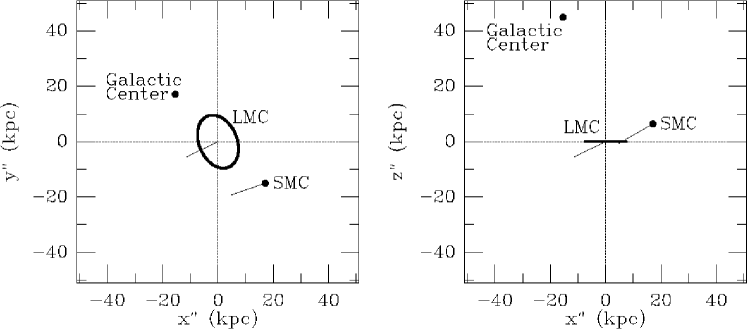
More comprehensive insight can be obtained from a three-dimensional analysis. To this end I use the coordinate system defined in Section 4.1, where the plane is the plane of the LMC disk. The positions of the LMC, the SMC and the Galactic Center can be calculated in this coordinate system with the help of equation (4.1) and the formulae in Paper I, using the known distances , (e.g., Cioni et al. 2000c) and . Figure 7a shows the projection of the three-dimensional space. The Galactic Center lies at position angle , measured counterclockwise from the -axis. The outer contours of the LMC near-IR starcount map have major axis position angle (defined modulo ), cf. Section 4.3. Thus, the elongation of the LMC is aligned to within with the direction to the projection of the Galactic Center onto the disk plane. While this alignment is less accurate than the projected alignment on the sky (which is therefore somewhat misleading), the alignment is still better than what one would expect in a randomly drawn situation. The LMC velocity vector in the plane lies at position angle . As in the sky-projection view of Figure 6, this is perpendicular to within the errors. If one assumes that the direction of the Magellanic Stream follows the velocity vector (as it does in projection on the sky), then the disk elongation is perpendicular to the direction of the Magellanic Stream as projected onto the LMC disk plane. As before, these results are consistent with the hypothesis that the elongation of the LMC is induced by the tidal force of the Milky Way.
Figure 7b shows the projection of the three-dimensional space. The Galactic Center does not lie in the plane of the LMC, but lies at an angle of from the plane as seen from the LMC center. The component of the tidal force parallel to the LMC disk plane is therefore considerably less than the total tidal force. However, the calculations of Weinberg (2000) show that the LMC disk is expected to precess and nutate through large angles as it moves around the Galaxy. The angular distance of the Galactic Center from the LMC disk plane therefore varies as function of position along the orbit, and the average tidal force parallel to the LMC disk plane may be larger than what it currently is.
6.4 The Tidal Influence of the SMC
The tidal force due to a massive body is proportional to its mass divided by the cube of the distance. The mass of the SMC is (Gardiner & Noguchi 1996) and the mass of the Milky Way enclosed within the LMC orbit is (Kochanek 1996). The positions in the coordinate system shown in Figure 7 yield for the distance between the LMC and the SMC and for the distance between the LMC and the Galactic Center. As a result, the tidal force from the Milky on the LMC is times larger than that from the SMC. So this would appear to indicate that the tidal effect of the SMC on the LMC is negligible compared to the that of the Milky Way. However, it cannot be ruled out that the LMC and the SMC had a significant interaction in the past. This depends sensitively on the poorly known relative orbit of these galaxies. It may even be that the SMC originated in a tidal disruption event of the LMC. If the SMC were ever as close as from the center of the LMC, essentially touching the outer contours of the LMC, its tidal influence would definitely have exceeded that of the Milky Way.
On the projected plane of the sky (Figure 6), as seen from the center of the LMC, the SMC lies at a position angle of (at a distance from the LMC). The outer contours of the LMC near-IR starcount map have major axis position angle , cf. Section 3.2. The projected elongation of the LMC is therefore aligned only to within with the projected direction to the SMC. On the other hand, the alignment is better in the plane of the LMC (see Figure 7a). The SMC lies at position angle , measured counterclockwise from the -axis. The outer contours of the LMC near-IR starcount map have major axis position angle , cf. Section 4.3. Thus, the elongation of the LMC is aligned to within with the direction to the projection of the SMC onto the disk plane. This is only marginally worse than the alignment with respect to the projected position of the Galactic center. In addition, the SMC lies close to the plane of the LMC disk (see Figure 7b), at an angle of as seen from the LMC center. So currently, most of the tidal force of the SMC acts parallel to the LMC disk plane.
Upon assessing all the above arguments, it appears most likely that the elongation of the LMC is due to the tidal force from the Milky Way, and not that from the SMC. This is suggested in particular by the facts that the elongation of the LMC disk is perpendicular to the Magellanic Stream, and that the tidal force from the Milky Way currently exceeds that from the SMC by a large factor.
7 Kinematics of the LMC
Many previous investigations have studied the kinematics of tracers in the LMC disk. The results have generally been interpreted under the assumption that the LMC disk is circular, and that the tracers move on circular orbits. In such models the line of maximum gradient in the velocity field coincides with the line of nodes, and this method has therefore often been used to estimate the viewing geometry of LMC, as reviewed in Paper I. However, as demonstrated here, the LMC disk is not circular but elongated. It is therefore worthwhile to rediscuss the observed kinematics in light of this finding.
7.1 Gas kinematics
The gas kinematics of the LMC have been studied primarily using HI (e.g., Rohlfs et al. 1984; Luks & Rohlfs 1992; Kim et al. 1998). Kim et al. (1998) analyzed data from the Australia Telescope Compact Array HI survey using a standard circular tilted-ring algorithm. At the outermost available radii in their study (–) they obtained for the position angle of the line of maximum velocity gradient. This differs considerably from the position angle of the line of nodes inferred in Paper I, .
In an elliptical disk one does not expect and to be equal. The kinematical properties of an elliptical gas disk can be approximated using epicyclic theory (e.g., Gerhard & Vietri 1986; Franx, van Gorkom & de Zeeuw 1994; Schoenmakers et al. 1997). The cold gas is expected to move along stable closed orbits in a symmetry plane (Tohline, Simonson & Caldwell 1982). In general the predicted velocity field depends on many unknown factors, such as the ellipticity of the gravitational potential in the disk plane, the radial slope of the circular velocity curve, and whether or not gravitational potential is tumbling or not. However, analytical results can be obtained in the simple case in which the gravitational potential is stationary, and corresponds to a flat rotation curve (Franx et al. 1994). One then obtains
| (4) |
where is the position angle of the line of zero line-of-sight velocity, the angles on the left hand side are in degrees, is the ellipticity of the gas disk, and is the angle in the plane of the gas disk from its major axis to the line of nodes. The equations are correct only to lowest order in , and therefore formally apply only to nearly-circular disks.
Use of equations (4) is not straightforward in the context of the LMC, since the HI gas distribution is very filamentary (Kim et al. 1998), and it is not easy to assign a unique ellipticity and major axis position angle. So let us consider merely what the maximum misalignment is that one could possibly expect, obtained when . This yields, with the inclination angle from Paper I, that and . The line of maximum velocity gradient and the line of zero velocity are not perpendicular; in this maximum misalignment case . The observed difference (using the Kim et al. 1998 data at radii –) would clearly not generally be expected in the simple model described above unless the gas disk had an unrealistic elongation, , and even then only in the most favorable situation ().
Although the observed misalignment between the line of maximum HI velocity gradient and the line of nodes cannot be easily explained with a simple model of non-circular motion in an elliptical disk, the HI data presented by Kim et al. (1998) certainly do not support the idea that the gas disk would be in circular motion. The value of shows a statistically significant twist of from small to large radii, indicating that the HI disk cannot have an intrinsically constant ellipticity and position angle (not surprising, given that this is not true for the stellar disk either; cf. Figure 4). The lines of maximum velocity gradient and of zero velocity are not perpendicular, as generically expected in a non-circular disk. The inclination derived from the shape of the HI brightness contours under the assumption of circular symmetry is inconsistent with the value derived from fits to the velocity field, which also argues for a non-circular gas disk. In addition, the gas disk may not even be close to equilibrium. The center of the HI rotation velocity field (RA = and DEC = , Kim et al. 1998) does not coincide with either the center of the bar, or the center of the outer contours of the stellar distribution. It is offset from both by , as indicated in Figures 3f and 4f. Also, the LMC and the SMC are enshrouded in a common HI envelope, and they are connected by a bridge of HI gas. This bridge connects to the LMC disk at a distance of only from the LMC center (Putman et al. 1998). Consequently, even at small radii the LMC gas disk appears to be subject to tidal disturbances that probably also affect the velocity field. This makes it unlikely that any simple equilibrium model for the gas kinematics, such as that leading to equation (4), may provide much insight into the structure of the LMC.
7.2 Kinematics of Discrete tracers
Not only HI gas, but also a variety of discrete tracers have been used for kinematical studies of the LMC. These include star clusters (Freeman et al. 1983; Schommer et al. 1992), planetary nebulae (Meatheringham et al. 1988), HII regions and supergiants (Feitzinger et al. 1977), and carbon-rich AGB stars (Kunkel et al. 1997; Graff et al. 2000; Alves & Nelson 2000). The line of maximum velocity gradient has generally been found to be in the range –. The large variation between different studies can be attributed in part to the small number statistics of some studies. The most recent and accurate determinations have come from studies of carbon stars. Alves & Nelson (2000) find that222The position angles in Table 1 of Alves & Nelson (2000) are measured from North over East, in the usual astronomical convention (Alves, priv. comm.). for carbon stars at radii . This is roughly the same radial range used in Paper I to determine the position angle of the line of nodes, which yielded . However, Alves & Nelson (2000) find that increases with distance from the center of the LMC, and reaches in their outermost ring, for which the mean distance to the LMC center is . Hence, increases from at intermediate radii to in the outer parts of the LMC disk. Graff et al. (2000) find from a study of carbon stars that averaged over all radii, consistent with the results of Alves & Nelson (2000).
For a gas disk one can assume that the gas moves on closed orbits, since shocks rapidly depopulate self-intersecting orbits (Tohline et al. 1982). This leads to simple formulae such as those in equation (4). By contrast, discrete tracers behave as a collisionless population, and can populate any of a large number of rosetta orbits. Hence, there is no simple method to predict the misalignment between the line of nodes and the line of maximum velocity gradient for discrete tracers in an elliptical disk. However, if one uses equation (4) as a rough guide, it doesn’t seem a priori impossible get a misalignment of in a disk with an elongation of . On the other hand, it seems hard to believe that a misalignment as large as could be generated naturally as a result of rotation in a somewhat elongated disk. In view of this it seems worthwhile to investigate whether there could be any systematic uncertainties or errors in previous interpretations and modeling of the observed LMC velocity field.
7.3 Correction for the Center of Mass Motion of the LMC
One complication in the interpretation of the velocity field of the LMC arises from the motion of its center of mass. As one moves away from the LMC center, the transverse component of this motion ceases being perpendicular to the line of sight. This causes a spurious solid-body rotation component in the observed line-of-sight velocities of the form , where is the angular distance from the LMC center, is the position angle on the sky, and and are the size and position angle of the transverse velocity vector. This spurious solid-body component yields an angular offset between the true and observed position angle of the line of maximum velocity gradient. Initially this effect was used to estimate under the assumption (appropriate for a circular disk) that the line of maximum velocity gradient should be equal to the photometric major axis (Feitzinger et al. 1977; Meatheringham et al. 1988). More recently, actual measurements of the transverse motion of the LMC have become available from proper motion studies. The average from a variety of studies as quoted in Kroupa & Bastian (1997) is and (note that these values are not corrected for the reflex motion of the sun, by contrast to those shown in Figures 6 and 7).
Most recent studies of the velocity field of the LMC disk, including e.g. the HI study by Kim et al. (1998) and the carbon star study by Alves & Nelson (2000) discussed above, corrected their data for the spurious component using existing proper motion results. However, it should be kept in mind that this correction is somewhat uncertain. The observed rotation curve, corrected for the spurious component, peaks at from the LMC center, and then is approximately flat at (Alves & Nelson 2000). By contrast, at , the mean distance to the LMC center for the outermost ring in the study of Alves & Nelson (2000), peaks at . So in the outer parts of the LMC the spurious component in the velocity field exceeds the intrinsic velocity field by almost a factor . The inferred properties of the intrinsic velocity field at large radii are therefore very sensitive to small errors in the transverse motion quantities and . This is important, since some measurements of these quantities are quite inconsistent with the results quoted in Kroupa & Bastian (1997). For example, Anguita, Loyola & Pedreros (2000) find and . Also, the motion measured by Kroupa & Bastian (1997) is smaller than predicted by models for the origin of the Magellanic Stream (Lin, Jones & Klemola 1995). If is larger in reality than inferred by Kroupa & Bastian (1997), then the inferred values of would have to be revised downward (Feitzinger et al. 1977), which would bring the observed values more in line with the position angle of the line of nodes inferred in Paper I. So it is not inconceivable that some or all of the discrepancies between and discussed in Sections 7.1 and 7.2 are due to uncertainties in the correction for the center-of-mass motion of the LMC.
7.4 Precession and Nutation of the LMC Disk
Previous authors have interpreted the velocity field of the LMC as a sum of two components, the motion of the center of mass of the LMC around the galaxy, and a differential rotation of the LMC disk in its plane. However, there are almost certainly other components of motion in the center of mass system. In particular, the N-body calculations of Weinberg (2000) show that the disk of the LMC is expected to precess and nutate as the LMC moves along its orbit. This is due to torquing by the time-variable tidal force from the Milky Way. It is of interest to assess whether the expected wobbling of the disk might form a significant component of the observed velocity field. Figures 3 and 4 of Weinberg (2000) show for his calculations the variations in the azimuthal and polar angles of the vector normal to the disk plane. The rate of change of the three-dimensional angle is largest near the end of his simulation (time Gyr), when it is per Gyr. If this angular velocity is seen along the line of sight at , the mean distance to the LMC center for the outermost ring in the study of Alves & Nelson (2000), it corresponds to a line of sight velocity of . This exceeds the observed velocities, which peak at (Alves & Nelson 2000). This is the most extreme disk-wobbling velocity that can be obtained with Weinberg’s calculations, and on average the precession/nutation velocity may well be less by a factor of a few. In addition, this velocity need not be aligned with the line of sight. Nonetheless, it is clear that precession and nutation could have a significant influence on the observed velocity field. So it is not inconceivable that some or all of the discrepancies between and discussed in Sections 7.1 and 7.2 are due to possible precession and nutation of the LMC disk plane, which has not been accounted for in any previous analysis.
8 Conclusions
I have used the data from the near-IR 2MASS and DENIS surveys to create star count maps of the LMC on the projected plane of the sky. These data are perfectly suited for a study of the structure of the LMC, because of the large statistics and insensitivity of near-IR data to dust absorption. The analysis is restricted to RGB and AGB stars selected from their position in the near-IR CMDs. The limiting magnitude that is applied to the sample is corrected for the inclination of the LMC, to avoid distance-induced biases. Galactic foreground stars make a small contribution to the maps that can be adequately subtracted. The 2MASS map has some small regions with no data in the 2MASS Second Incremental Data Release, and the DENIS map shows some minor residual artifacts of the DENIS scan pattern. However, the maps from the separate surveys can be combined into a single map that is free from any obvious blemishes or artifacts.
The RGB and AGB stars selected for the star count map are part of the intermediate-age and old stellar populations that are expected to trace the underlying mass distribution of the LMC disk. The map clearly shows the well-known bar of the LMC, but is otherwise remarkably smooth. This contrasts sharply with optical images of the LMC which show pronounced star forming regions, HII regions, and spatial variations in dust absorption. There are small hints of spiral structure, but only at a very low level. There is certainly no well organized spiral pattern in the LMC. The LMC disk can be traced out to from the center.
Ellipse fitting can be used for quantitative analysis of the star count map. The radial number density profile to lowest-order follows an exponential profile with a scale-length . However, there are clear deviations from an exponential profile at large radii, where there is an excess of stars over the best-fitting exponential. This may be due to the tidal effect of the Milky Way on the LMC. The position angle and ellipticity profile both show large variations as function of radius, but converge to approximately constant values for . In the outer parts, and . These results are consistent with previous studies of the distributions of tracers in the LMC disk, but most of those were of lower accuracy than the results presented here.
The center of the star count contours on the sky shows considerable variations as function of radius. At small radii , this is due to intrinsic lopsidedness of the LMC: the contours are not centered on the center of the bar. At large radii the effect of viewing perspective (one side of the LMC being closer to us than the other) is the dominant source of drift in the contour center. One expects on the basis of simple geometry that the contour center should drift in the direction of the near side of the LMC plane. Indeed, at large radii the data show a drift in the contour center that is fully consistent with the LMC viewing angles inferred in Paper I. This provides an important, independent confirmation of the latter.
The line of nodes position angle inferred in Paper I, , differs by as much as from the major axis position angle of the outer LMC star count contours. This implies that the LMC is not intrinsically circular at large radii. To study the intrinsic structure of the LMC one can deproject the data using the viewing angles from Paper I. The best-fitting exponential disk scale length is now , but again, there are considerable deviations from an exponential profile at large radii. The position angle and ellipticity again converge to approximately constant values at large radii. The intrinsic ellipticity of the LMC disk at large radii is . The outer contours have a more-or-less common center, which lies from the center of the bar. Neither agrees with the center of rotation of the HI gas disk, which is offset by from both.
The ellipticity of the LMC disk is considerably larger than the typical ellipticities of disk galaxies, which are believed to be in the range –. This suggests that the elongation of the LMC disk is the result of tidal forces. The Milky Way is the most likely cause, given that its tidal force is currently times larger than that of the SMC. Indeed, Weinberg (2000) has recently stressed the large effect that the tidal force of the Milky Way is expected to have on LMC structure. An analysis of the projected structure of the Galaxy-LMC-SMC triple system on the sky shows that the projected elongation of the LMC is aligned to within with the projected direction to the Galactic Center. The elongation is perpendicular to the LMC proper motion and the Magellanic Stream to within the errors. A three-dimensional analysis shows that the Galactic Center lies at an angle of from the plane of the LMC, as seen from the LMC center. The projection of the Galactic Center onto the disk plane is aligned to within with the major axis of the disk. The elongation is perpendicular to within the errors to the projection of the three-dimensional LMC center of mass velocity vector onto the LMC disk plane. These results are qualitatively consistent with the hypothesis that the elongation of the LMC disk is due to the tidal force from the Milky Way. Quantitative predictions for the induced LMC disk elongation currently do not exist.
The kinematics of the LMC have been studied previously using both HI gas and discrete tracers. In the past, the position angle of the line of maximum gradient in the velocity field has generally been used to estimate the position angle of the line of nodes, which assumes that the LMC disk is circular. However, the results of the present investigation show that the LMC disk is not circular, and as result, and need not agree. It is found that is somewhere in the range –, depending on the type or tracer and the radial distance to the LMC center. While values at the lower end of this range can conceivably be induced by non-circular motions in a slightly elongated disk, it is hard to believe that this could cause misalignments as large as . However, the misalignment may be due to velocity components other than rotation of tracers in the disk plane itself, namely: (a) uncertainties in the space of motion of the LMC center of mass; and (b) possible motion of the LMC plane in an inertial frame attached to its center of mass. The former causes a spurious solid body component in the observed velocity field that is generally corrected for. However, the correction is large, and the space motion of the LMC is not known very accurately. So the corrections that are generally made may be in error. The latter has not been taken into account in any study of the LMC kinematics, but is predicted to occur naturally as the disk plane precesses and nutates when it moves around the galaxy (Weinberg 2000). In either case there could be a solid body component in observed line-of-sight velocity fields that has not been corrected for, and is large enough to cause the difference between and the inferred values of . Note that the LMC has an approximately flat rotation curve, whereas solid body rotation increases linearly with radius. So if this is the correct explanation, then the difference between and should increase as one moves further out into the LMC, exactly as observed (Alves & Nelson 2000).
The main result of the present paper is that the structure of the LMC disk is considerably more complicated than has been assumed previously. The LMC disk is not circular at larger radii, tidal effects may have considerably distorted its shape, and previously unmodeled velocity components may be contributing to the observed velocity field. These results should serve as a warning to any attempts at modeling the LMC as a simple equilibrium system. This may be particularly important in the context of microlensing studies, where the structure of the LMC features prominently in ongoing discussions over the contribution of LMC self-lensing to the inferred microlensing event rates (e.g., Sahu 1994; Weinberg 2000; Alcock et al. 2000).
References
- (1) Alcock, C., et al. 2000, ApJ, 542, 281
- (2) Alvarez, H., Aparici, J., & May, J. 1987, A&A, 176, 25
- (3) Alves, D. R., & Nelson, C. A. 2000, ApJ, 542, 789
- (4) Andersen, D. R., Bershady, M. A., Sparke, L. S., Gallagher III, J. S., & Wilcots, E. M. 2001, ApJ, 551, L131
- (5) Anguita, C., Loyola, P., & Pedreros, M. H. 2000, AJ, 120, 845
- (6) Baldwin, J. E., Lynden-Bell, D., & Sancisi, R. 1980, MNRAS, 193, 313
- (7) Barnes, J. E. 1998, in Galaxies: Interactions and Induced Star Formation, R. C. Kennicutt, Jr., F. Schweizer, & J. E. Barnes, Saas-Fee Advanced Course 26 (New York: Springer)
- (8) Binney, J. J., & de Vaucouleurs, G. 1981, MNRAS, 194, 679
- (9) Bothun, G. D., & Thompson, I. B. 1988, AJ, 96, 877
- (10) Brüns, C., Kerp, J., & Staveley-Smith, L. 2000, to appear in The Hidden Universe, R. C. Kraan-Korteweg, P. A. Henning, & H. Andernach, eds., ASP Conference series [astro-ph/0011546]
- (11) Calabretta, M. 1992, AIPS++ Implementation Memo 107, (Washington: Associated Universities Inc.) [http://aips2.nrao.edu/docs/memos/107/107.html]
- (12) Cioni, M. R., et al. 2000a, A&AS, 144, 235
- (13) Cioni, M. R., Habing, H. J., & Israel, F. P. 2000b, A&A, 358, L9
- (14) Cioni, M. R., van der Marel, R. P., Loup, C., & Habing, H. J. 2000c, A&A, 359, 601
- (15) de Vaucouleurs, G., & Freeman, K. C. 1973, Vistas Astron., 14, 163
- (16) Dubinski, J., & Carlberg, R. G. 1991, ApJ, 378, 496
- (17) Epchtein, N., et al. 1997, Messenger, 87, 27
- (18) Feitzinger, J. V., Schmidt-Kaler, T., & Isserstedt, J. 1977, A&A, 57, 265
- (19) Franx, M., & de Zeeuw, P. T. 1992, ApJ, 392, L47
- (20) Franx, M., van Gorkom, J. H., & de Zeeuw, P. T. 1994, ApJ, 436, 642
- (21) Freeman, K. C., Illingworth, G., & Oemler, A. 1983, ApJ, 272, 488
- (22) Gardiner, L. T., & Noguchi, 1996, MNRAS, 278, 191
- (23) Gerhard, O. E., & Vietri, M. 1986, MNRAS, 223, 377
- (24) Gerin, M., Combes F., & Athanassoula E. 1990, A&A, 230, 37
- (25) Graff, D. S., Gould, A. P., Suntzeff, N. B., Schommer, R. A., & Hardy, E. 2000, ApJ, 540, 211
- (26) Helmi, A., & White, S. D. M. 2001, MNRAS, 323, 529
- (27) Jedrzejewski, R. I. 1987, MNRAS, 226, 747
- (28) Johnston, K. V., 1998, ApJ, 495, 297
- (29) Johnston, K. V., Hernquist, L., & Bolte, M. 1996, ApJ, 465, 278
- (30) Johnston, K. V., Spergel, D. N., & Hernquist, L. 1995, ApJ, 451, 598
- (31) Kim, S., Staveley-Smith, L., Dopita, M. A., Freeman, K. C., Sault, R. J., Kesteven M. J., & McConnell, D. 1998, ApJ, 503, 674
- (32) Kochanek, C. S. 1996, ApJ, 457, 228
- (33) Kontizas, M., Morgan, D. H., Hatzidimitriou, D., & Kontizas, E. 1990, A&AS, 84, 527
- (34) Kornreich, D. A., Haynes, M. P., & Lovelace, R. V. E. 1998, AJ, 116, 2154
- (35) Kroupa, P., & Bastian, U. 1997, New Astronomy, 2, 77
- (36) Kunkel, W. E., Demers, S., Irwin, M. J., & Albert, L. 1997, ApJ, 488, L129
- (37) Lambas, D. G., Maddox, S. J. & Loveday, J. 1992, MNRAS, 258, 404
- (38) Lasserre, T., et al. 2000, A&A, 355, L39
- (39) Lin, D. C. N., Jones, B. F., & Klemola, A. R. 1995, ApJ, 439, 652
- (40) Luks, Th., & Rohlfs, K. 1992, A&A, 263, 41
- (41) Lynga, G., & Westerlund, B. E. 1963, MNRAS, 127, 31
- (42) McGee, R. X., & Milton, J. H. 1966, AuJPh, 19, 343
- (43) Meatheringham, S. J., Dopita, M. A., Ford, H. C., & Webster, B. L. 1988, ApJ, 327, 651
- (44) Moore, B., & Davis, M. 1994, MNRAS, 270, 209
- (45) Nikolaev, S., & Weinberg, M. D. 2000, ApJ, 542, 804
- (46) Odenkirchen, M., et al. 2001, ApJ, 548, L165
- (47) Putman, M. E., et al. 1998, Nature, 394, 752
- (48) Rix, H.-W., & Zaritsky, D. 1995, ApJ, 447, 82
- (49) Rohlfs, K., Kreitschmann, J., Siegman, B. C., & Feitzinger, J. V. 1984, A&A 137, 343
- (50) Rudnick, G., & Rix, H.-W. 1998, AJ, 116, 1163
- (51) Sahu, K. C. 1994, Nature, 370, 275
- (52) Schmidt-Kaler, T., & Gochermann, J. 1992, in Variable Stars and Galaxies, B. Warner, ed., ASP Conf. Series Vol. 30, 203
- (53) Schoenmakers, R. H. M., Franx, M., & de Zeeuw, P. T. 1997, MNRAS, 292, 349
- (54) Schommer, R. A., Suntzeff, N. B., Olszewski, E. W., & Harris, H. C. 1992, AJ, 103, 447
- (55) Skrutskie, M. 1998, in The Impact of Near-Infrared Sky Surveys on Galactic and Extragalactic Astronomy, Proc. of the 3rd Euroconference on Near-Infrared Surveys, N. Epchtein., ed., Astrophysics and Space Science Library, Vol. 230, 11 (Dordrecht: Kluwer)
- (56) Swaters, R. A., Schoenmakers, R. H. M., Sancisi, R., & van Albada, T. S. 1999, MNRAS, 304, 330
- (57) Teuben, P. 1987, MNRAS, 227, 815
- (58) Tohline, J. E., Simonson, G. F., & Caldwell, N. 1982, ApJ, 252, 92
- (59) Udalski, A., Soszynski, I., Szymanski, M., Kubiak, M., Pietrzynski, G., Wozniak, P., & Zebrun, K. 1999, Acta Astronomica, 49, 223
- (60) van der Marel, R. P., & Cioni, M.-R. 2001, AJ, submitted (Paper I)
- (61) van der Marel, R. P. 2001, in preparation (Paper III)
- (62) Weinberg, M. D., & Nikolaev, S. 2000, ApJ, 548, 712
- (63) Weinberg, M. D. 2000, ApJ, 532, 922
- (64) Westerlund, B. E. 1997, The Magellanic Clouds (Cambridge: Cambridge University Press)
- (65) Zaritsky, D., & Rix, H.-W. 1997, ApJ, 477, 118
- (66) Zaritsky, D., & Lin, D. N. C. 1997, AJ, 114, 2545
- (67) Zaritsky, D., Harris, J., & Thompson, I. 1997, AJ, 114, 1002
- (68) Zaritsky, D. 1999, AJ, 118, 2824
- (69) Zaritsky, D., Shectman, S. A., Thompson, I., Harris, J., & Lin, D. N. C. 1999, AJ, 117, 2268
- (70) Zhao, H. S., & Evans, N. W. 2000, ApJ, 545, L35