Shape of the 4.438 MeV -ray line of 12C from proton and -particle induced reactions on 12C and 16O
Abstract
We calculated in detail the angular distribution of -rays and the resulting shape of the -ray line produced by the nuclear deexcitation of the 4.439 MeV state of 12C following proton and -particle interactions with 12C and 16O in the energy range from threshold to 100 MeV per nucleon, making use of available experimental data. In the proton energy range from 8.6 to 20 MeV, the extensive data set of a recent accelerator experiment on -ray line shapes and angular distributions was used to deduce parametrizations for the -ray emission of the 2+, 4.439 MeV state of 12C following inelastic proton scattering off 12C and proton induced spallation of 16O. At higher proton energies and for -particle induced reactions, optical model calculations were the main source to obtain the needed reaction parameters for the calculation of -ray line shapes and angular distributions. Line shapes are predicted for various interaction scenarios of accelerated protons and -particles in solar flares.
pacs:
23.20.En, 25.40.Ep, 25.55.Ci, 96.60.RdI Introduction
The -ray line at 4.438 MeV from the deexcitation of the first excited state of 12C is one of the strongest nuclear lines, clearly visible in several energetic solar flares, which were observed in particular by the Gamma Ray Spectrometer aboard the SMM satellite [1] and one of the best candidates for an observation at -ray energies of the interaction of low energy cosmic rays in nearby molecular clouds [2]. It is mainly produced by inelastic scattering of energetic protons and -particles off 12C and by the spallation of 16O by the same particles [3]. This line is also produced in reverse kinematics by accelerated 12C and 16O bombarding the ambient hydrogen and helium nuclei, with however a large Doppler broadening due to the high velocities of the emitting 12C nucleus, which makes its detection much more difficult. In the following we will refer to -ray lines produced by light ion bombardment of the ambient gas as the narrow component and to -rays produced by accelerated heavy ions as the broad component.
Accordingly, the intensity and shape of the narrow component of the 4.438 MeV line depend on the properties of the accelerated light particle spectrum and the 12C and 16O abundances in the interaction site. The narrow line intensities from various isotopes can be used to derive accelerated particle and ambient gas abundances, as it has been done for example by Murphy et al. [4] for the solar flare of 1981, April 27. More detailed information on the energy spectrum of the accelerated particles and their directional distribution at the interaction site may however only be obtained by a detailed line shape analysis.
Murphy, Kozlovsky and Ramaty [5] investigated the impact of different accelerated particle angular distributions on the narrow component of the 4.438 MeV -ray line produced by the p + 12C reaction. The shape of the broad component has been discussed by Bykov, Bozhokin and Bloemen [6] and by Kozlovsky, Ramaty and Lingenfelter [7]. These studies are based on the experimentally well-known excitation functions, some available experimental data on differential cross sections, few published results on measured line shapes, and theoretical arguments. For the spallation reaction, the situation is similar with respect to available experimental data. The excitation function is experimentally determined from threshold up to over 100 MeV, but few data are available on differential cross sections and line shapes.
In order to put the calculations for the 4.438 MeV line on a firmer basis, we use additionally to the already published data the extensive data set on -ray angular distributions and -ray line shapes for the 12C(p,p) and 16O(p,p) reaction, obtained in a recent accelerator experiment at Orsay [8]. For the spallation reaction, the reproduction of the observed line shapes for proton energies between 16 and 20 MeV proved to be only sensitive to the mean excitation energy of the -particle emitting intermediate states of 16O. Estimations of the mean excitation energy for higher proton energies and for the differential cross sections are based on published data in the proton energy range 40-50 MeV and optical model (OM) calculations.
For proton inelastic scattering, we adopted a method similar to that of Murphy, Kozlovsky and Ramaty [5] for line shape calculations. Two independent amplitudes for the magnetic substate population of the 2+ level and a phase shift were adjusted to reproduce both the experimental line shapes and the laboratory -ray angular distributions in the proton energy range from 8.6 MeV to 19.75 MeV. The extrapolations to higher energies are based on OM calculations using phenomenological potential parameters, which proved to give an excellent reproduction of measured differential cross sections for nucleon elastic and inelastic scattering off 12C at projectile energies E 20 - 100 MeV [9].
-particle inelastic scattering off 12C and spallation of 16O suffer from a complete absence of published data on line shapes. Therefore, estimations of the mean excitation energy in 16O for the spallation reaction were entirely based on OM calculations and an experimental -particle spectrum at = 60 MeV. For the inelastic scattering reaction, differential cross sections d/d and some laboratory -ray angular distributions have been used to find the parameters for the -ray emission based on the population amplitude method at -particle energies below 20 MeV, while at higher energies the needed parameters were obtained from OM calculations.
In the last section we discuss the production of the 4.438 MeV line in solar flares and show some calculated shapes for the narrow component of the 4.438 MeV line induced by proton and -particle interactions in the solar atmosphere as it may be observed by the HESSI spacecraft [10].
II The spallation reaction
Total cross section data are reported by Dyer et al. [11] for = 14-23 MeV, Lesko et al. [12] for = 20, 30, 33, 40 and 50 MeV, Lang et al. [13] at = 40 MeV, Zobel et al. [14] at = 12.1, 28.2, 48.3 and 145 MeV and by Foley et al. [15] at = 146 MeV. From threshold to 23 MeV, we used the data of Ref. [11], which are in agreement with those of Refs. [12] and [14]. There is, however, some disagreement between the different data in the energy interval = 40-50 MeV. The cross section values at = 40 MeV of Ref. [13] and Ref. [12] differ by more than a factor of two. The same holds for the values around 50 MeV of Ref. [12] and Ref. [14]. As no systematic deviation of one of the data sets can be observed, no cross section value was discarded. We therefore fitted the excitation function curve above 23 MeV. Assigning the same weight to each data point, the overall shape of the excitation function curve from 23 MeV to 146 MeV could be best fitted by a power law plus a constant. The fit is very close to the curve in Fig.3 of Ref. [3] for this reaction. The obtained cross sections values are given in Table I.
For proton energies below 50 MeV, that reaction should proceed principally from a sequential process with the excitation of intermediate states of 16O, decaying subsequently to + 12C. Reactions with other particles than the -particle in the outgoing channel, like 3He + n or 3H + p have thresholds 20 MeV higher, around = 35 MeV, and should be negligible for the production of 12C in solar flares. The sequential character can be deduced from a study of the 16O(p,p)12C reaction at a proton energy of 46.8 MeV, where no evidence for quasi-elastic p- scattering was found [16]. Still other reaction paths, such as 16O(p,)13N⋆ p + 12C were also found negligible. At lower energies these reaction mechanisms should be still weaker. We adopted in the following exclusively the sequential process 16O(p,p’)16O⋆ + 12C.
Parameters entering into the line shape determination are therefore the relative contribution of the different excited states in 16O and for each excited state the differential cross section with respect to the recoiling 16O⋆ scattering angle, the 12C⋆-16O angular correlation and the -12C angular correlation. Given the scarcity of experimental data and the number of excited states involved, it is highly impracticable if not impossible to undergo a full and correct calculation for numerous proton energies from threshold to 100 MeV. One can, however, reasonably assume that the average angular distribution of the -12C⋆ decay in the recoiling 16O⋆ system and the angular distribution of the -ray emission in the 12C⋆ system are isotropic, because of the contribution of many 16O levels with different spin and parity (see the discussion in Ref. [13]).
A = 16 - 20 MeV
In this energy range, experimental line shapes are available from a recent accelerator experiment at Orsay [8] at six different -ray detection angles, ranging from 45∘ to 145∘ with respect to the incoming beam direction and at four proton energies. These experimental line shapes were compared with calculated ones obtained with the use of a Monte-Carlo type program. In this program reaction parameter inputs were the differential cross section with respect to the proton center-of-mass scattering angle and the mean excitation energy in 16O. As mentionned above, the vector of the -12C⋆ decay in the 16O⋆ system and the -ray emission in the 12C⋆ system were taken isotropically. Slowing down of the carbon in the target with exponentially decaying -ray emission probability corresponding to the lifetime of the 4.439 MeV state, as well as the full detector geometry and resolution were taken into account to generate theoretical detector spectra. Stopping powers were taken from the code TRIM [17].
Optical-model calculations of inelastic proton scattering off 16O to states from 12.75 MeV to 17 MeV, with optical potential parameters from the compilation of Perey and Perey [19] were performed to obtain the differential inelastic scattering cross sections d/d. The calculated cross sections were found to be roughly isotropic in this proton energy range. As furthermore the calculated line shapes proved to be not very sensitive to the details of the differential cross section, we simply used a constant d/d. The mean excitation energy x in 16O was then the only parameter that has been adjusted to reproduce the experimental -ray spectra.
Figure 1 shows the result of a line shape calculation at = 20 MeV for the six detection angles of the experiment. Position, line shape and relative intensities of the experimental lines are fairly well reproduced by the calculation, which gives credit to the validity of the assumption of essentially isotropic angular distributions. We also checked that calculations with a Gaussian distribution of the excitation energy centered at x resulted in practically identical line shapes. Those calculations have been made at the four proton energies where experimental spectra were extracted. The obtained mean excitation energies are presented in Table I.
B = 20-100 MeV
In this proton energy range, some experimental information on line shapes and on inelastic cross sections of excited levels in 16O are available at = 40, 45 and 46.8 MeV [13] [18] [16]. Lang et al. [13] deduced relative contributions to the 12C production for 16O states ranging from = 12.53 MeV to 28 MeV from the cross sections at = 40∘ and = 45 MeV of Buenerd et al. [18]. For excitation energies above 28 MeV, virtually no contribution has been observed in the 16O(p,p’)16O reaction at = 45 MeV [18] and in the 16O(p,p)12C reaction at = 46.8 MeV [16].
We used as the basis of our calculations eight representative states for the 16O levels, with the relative contribution to the 12C production :
| (1) |
given by Lang et al. [13] in their table I for = 45 MeV. Here, and mean the partial decay width to the + 12C channel and the total width of the state , respectively. In detail, we chose the following representative states with excitation energy :
(1) = 12.75 MeV, 2+, representing the 12.53, 13.02 and 13.26 MeV levels of Ref. [13].
(2) = 15.1 MeV, 2+, representing the 13.97, 15.27 and 15.50 MeV levels of Ref. [13]
(3) = 17, 19, 21, 23, 25 and 27 MeV, 2+, representing the respective excitation energy range = 1 MeV of Ref. [13].
The choice of exclusively l=2 excitations to 2+ states has two reasons. First, calculations of inelastic proton scattering to the giant resonance region at = 21-28 MeV indicate good agreement of l=2 excitation with the experimental data [18]. Second, the dependence of the cross section on the proton energy proved to be not very sensitive to the multipolarity, and the angular dependence of the cross section for l=2 excitations is somehow intermediate between l=1 and l=3 excitations, simulating fairly well an averaged angular distribution for the three multipolarities. Non-natural parity states and excitations with l3 are believed not to change much the overall trends.
We also assumed that the total cross section for each state is proportional to the differential cross section at 40∘. This was supported by OM calculations for = 45 MeV, where the ratio of the inelastic scattering cross section to the differential cross section at 40∘ was found constant to within 20% for the different excited states.
The mean excitation energy for = 45 MeV is then simply defined as:
| (2) |
To obtain the mean excitation energy at other proton energies, we made extensive OM calculations with the code Ecis94 [20], using the optical potential parameters of the compilation of Perey and Perey [19]. For each proton energy we calculated the inelastic scattering cross section for the eight representative states of 16O. All calculations were restricted to direct one-step excitation of the respective state in 16O, which should be the main excitation mechanism for the states of interest at these proton energies.
Calculations were done for the following proton energies: = 22.5, 25, 30, 40, 45, 66 and 100 MeV. The mean excitation energy as a function of proton energy was calculated in the following way,
| (3) |
The differential cross sections have been obtained in the same way by averaging over the eight representative states. In order to facilitate line shape calculations for a wide range of proton energies, we parametrized the differential cross section by a simple function:
| (4) |
where is the proton diffusion angle in the center-of-mass system. It was checked that this simple function produced essentially the same line shapes as the differential cross sections from the OM calculations. The values of x and p are presented in Table I.
III The inelastic scattering reaction
The cross section excitation function was taken from the measurements of Dyer et al. [11] from threshold to 23 MeV, above that from the data of Lang et al. [13] and Lesko et al. [12] up to 85 MeV, then from the curve of Ramaty, Kozlovsky and Lingenfelter [3] up to 100 MeV. Cross section values are reported in Table II.
Production of 4.438 MeV -ray emission by inelastic scattering off 12C originates mainly from direct excitation of the 2+, 4.439 MeV level. All higher-lying levels of 12C are particle-unbound and have small to very small -branching ratios to the 4.439 MeV state [21], making -ray cascade contributions negligible. The -ray line shape and the -ray angular distribution are in this case completely determined by the double differential inelastic cross section d/dd. It can be expressed as a product of the differential cross section d/d and the angular correlation function W (see for example Satchler [22]):
| (5) |
where and are the wave vectors of the incoming and outgoing proton, respectively, and is the vector of the emitted -ray.
Although a wealth of differential cross sections are available for this reaction, proton- correlation measurements exist only for few proton energies. The angular correlation function must therefore be extracted either from experimental data, for example by fitting of -ray angular distributions and line shapes or be obtained from OM calculations. The excitation function for the 4.438 MeV -production cross section exhibits pronounced fluctuations from threshold up to 15 MeV (see Ref. [8] or Ref. [11]). This indicates strong contributions of compound nucleus resonances 12C+p 13N⋆ p+12C to the inelastic scattering.
Because OM calculations are only suited for the direct reaction mechanism, their use in this energy range was discarded. We used the measured line shapes and -ray angular distributions of the Orsay experiment [8] and published data for d/d for = 8.6 - 20 MeV to adjust the parameters of the correlation function. Some available -ray angular distributions of the Washington experiment [11] were also used for comparison. The parameter adjustment was achieved by reproducing as closely as possible the experimental data in extensive calculations with the Monte-Carlo type program simulating the reaction and the detection setup of the Orsay experiment.
At higher proton energies, Meigooni et al. [9] provide a phenomenological optical potential for neutron and proton scattering off 12C, which reproduces fairly well elastic and inelastic scattering angular distributions. The OM calculations were used to obtain the necessary input parameters for the calculation of the double differential cross section d/dd.
A = 8.6 - 20 MeV
We adopted the formalism used in Refs. [3] and [7] for the proton- angular correlation and the calculation of the -ray line shape. In this formalism, the angular correlation function W is expressed in the rest frame of the recoiling excited 12C nucleus, whose recoil angle and velocity is kinematically fixed by the incoming and outgoing proton wave vectors and . The correlation function W then reduces to the -ray angular distribution in the carbon rest frame. It is proportional to the radiation pattern , which depends on the magnetic substate population amplitudes of the 4.439 MeV, 2+ state of 12C (see e.g. Jackson [23]):
| (6) |
where the are the vector spherical harmonics for quadrupole radiation, and , the polar and azimuthal angles of the -ray emission in the rest frame of the excited carbon. The aim was to find a set of population amplitudes for each proton energy of the Orsay experiment, which gives simultaneously a good reproduction of the experimental line shapes and the laboratory -ray angular distribution.
Kozlovsky, Ramaty and Lingenfelter [7] obtained reasonable fits of the six experimental line shapes at = 23 MeV from ref. [24] by adjusting only two independent real amplitudes, which furthermore were independent of the proton diffusion angle. We started our search with the same simple basis and adjusted the two independent relative amplitudes / and / (with real, = and = 1), independent of the carbon recoil angle. However, these two parameters were not sufficient and it proved to be necessary for a simultaneous reproduction of the line shapes and the -ray angular distribution to introduce a third independent parameter. We found that a phase shift for the azimuthal angle improved considerably the fits and gave a satisfactory reproduction of the Orsay data at most proton energies.
Practically, for the search of the population amplitudes, we used as in the case of the spallation reaction a Monte-Carlo type program simulating the nuclear reaction and the detection system of the Orsay experiment. For each proton center-of-mass diffusion angle, the 12C recoil direction and energy were calculated in the laboratory system. For the -ray emission, we chose a coordinate system with origin in the recoiling carbon nucleus, the z-axis perpendicular to the scattering plane and the x-axis in the direction of the carbon velocity vector. defines the angle between the -ray vector and the z-axis, while is defined as the angle between the x-axis and the projection of the -ray vector on the scattering plane, counted counterclockwise from the x-axis. Subsequently, the -ray vector was calculated in the laboratory system and the energy of the -ray was stored when it was in the solid angle of one of the detectors. Again, slowing down of the recoiling excited 12C in the target and decay of the 4.439 MeV state with half-life = 42 fs were taken into account.
Because of the presence of multiple compound nucleus resonances in this energy range, calculations were done in narrow proton energy steps between 8.6 and 20 MeV. For each energy, population amplitudes were adjusted to reproduce the -ray line shapes of the six detectors and special care was taken to obtain a simultaneously good reproduction of the laboratory -ray angular distribution. For d/d, experimental cross sections of Peelle [25] for = 14 - 19.4 MeV and of Barnard, Swint and Clegg [26] for = 8.6 - 11.6 MeV were used. For = 11.6 - 14 MeV we interpolated between the differential cross sections of Ref. [26] at 11.6 MeV and Ref. [25] at 14 MeV.
B = 20 - 100 MeV
Experimental data in this energy domain are relatively scarce, and no systematic measurements of differential cross sections d/d and d/d or line shapes are available. However, Meigooni et al. [9] performed a systematic study of nucleon elastic and inelastic scattering off 12C and found an energy dependent optical potential parameter set, which provides good fits to measured differential cross sections in a wide angular range and for energies above the pronounced compound nucleus contributions ( 15 MeV) up to approximately 100 MeV. We therefore based our calculations entirely on OM calculations with their parameter set.
These calculations were done with the program Ecis94 [20] to obtain the scattering amplitudes () necessary for the construction of the correlation function W (Eq. 5). () and () are the z-components of the 12C and the proton spin in the incoming (outgoing) channel, respectively. Choosing the z-axis along the incoming proton direction , the amplitudes, correlation function and consequently the proton and -emission angle are directly given in a space-fixed system with respect to the beam direction of the experiment. The correlation function for emission of the -ray in the direction is given by:
| (7) |
where denotes the polarization tensor. It is constructed from the scattering amplitudes and contains all information on the state of polarization of the excited carbon after scattering (see Satchler [22], section 10.3.3). are the radiation tensors:
| (8) |
where are the gamma radiation parameters and the spherical harmonics.
Introducing this correlation function in a program similar to the Monte-Carlo type program described above, we calculated theoretical line shapes and -ray angular distributions in the laboratory, using the differential cross sections d/d obtained from OM calculations. Comparison with the Orsay data for = 16-20 MeV gave fairly good reproductions of the line shapes and -ray angular distributions. An example is shown in Fig. 3 for = 19.75 MeV. Given the tendency that the differential cross sections are better reproduced with increasing proton energy (see Ref. [9]), the calculated line shapes and -ray angular distributions should be fairly realistic above 20 MeV.
Those calculations are, however, quite complex, involving for each proton energy the input of five complex scattering amplitudes depending furthermore on the proton center-of-mass scattering angle. In order to facilitate line shape calculations for proton spectra covering a wide energy range as in solar flares or cosmic rays, the line shapes and -ray angular distributions from the OM calculations for 20 MeV, were adjusted with the population amplitude method described in subsection III.A. The population amplitudes and phase shifts from these adjustments are reported in Table II.
IV alpha-particle induced reactions
As in the case of proton induced reactions, the main source of 4.438 MeV -rays by accelerated -particles is inelastic scattering off 12C and spallation of 16O. The cross section excitation functions being quite similar for both projectiles, reactions with -particles should generally not contribute significantly to the -ray line due to their low abundance, e.g. an observed /p ratio of 0.035 and 0.0076 in the energetic particle spectrum of two solar flares [27].
However, /p ratios in excess of 0.1 for the accelerated particle spectrum were shown to be necessary for an acceptable fit of the -ray spectrum of the 1981 April 27 flare [4]. -particle reactions are furthermore favored in the case of a very soft particle spectrum, because the thresholds for inelastic scattering off 12C and spallation of 16O are lower for -particles ( 2 and 5 MeV per nucleon, respectively) than for protons ( 6 and 14 MeV, respectively). In such cases, an important fraction of the -ray production may be due to reactions with -particles. Therefore, a treatment of -particle reactions similar to the above described studies on proton reactions seems worthwhile.
Unfortunately, experimental line shapes are practically absent for -particle inelastic scattering off 12C and do not exist for -particle induced spallation of 16O. Concerning spallation of 16O, this may not be very problematic because of the excitation of many intermediate levels in 16O resulting in essentially isotropic -ray angular distributions as for 16O(p,p). Optical model calculations should then provide as for proton induced spallation a reasonable estimation of the mean excitation energy in 16O and approximate differential inelastic cross sections. On the contrary, inelastic -particle scattering off 12C is certainly dominated at energies below 30 MeV by compound nucleus resonances due to the pronounced -particle structure of 12C and 16O, making OM calculations very hazardous in this energy range.
A The spallation reaction 16O(,x)12C
We made the same assumptions as for the case of proton induced spallation of 16O. Only the sequential process of excitation of intermediate levels in 16O with subsequent decay in and 12C was considered. The angular distributions of the excited carbon in the system of the excited oxygen and of the -ray in the system of the excited carbon were both considered isotropic.
Because of the absence of experimental line shapes, the estimation of the mean excitation energy in 16O was entirely based on OM calculations and the -particle energy spectrum of Lang et al. [13], obtained at = 60 MeV and at a scattering angle of 12.5∘. Contrary to proton scattering, the ratio of the total inelastic scattering cross section to the differential cross section at 12.5∘ shows a systematic dependance on the excitation energy in the considered range = 12.53 - 28 MeV. Therefore, the relative contributions extracted from the spectrum of Ref. [13], were multiplied by this ratio to obtain the relative inelastic scattering cross sections at = 60 MeV. Finally, for the partial -production probability Pi at 60 MeV, the inelastic scattering cross sections were multiplied with the branching ratios /, proposed by Ref. [13].
Extensive OM calculations were done for -particle energies = 18 - 400 MeV and the same eight representative excited 16O-states as in subsection II.B to estimate their relative contribution Pi at other projectile energies. As in the proton case, we restricted the calculations to direct one-step excitations. The energy-dependent phenomenological optical potential of Michel et al. [28], which gives good to very good fits of elastic differential cross sections from about 20 MeV to 146 MeV, were used in the entire energy range. From the same calculations, averaged differential cross sections were constructed and their angular distributions fitted by a parameterization as in subsection II.B, but with the addition of a term cos4() to take account of the backward enhancement of the differential cross sections:
| (9) |
For this reaction, the -ray production cross section has only been measured at five -particle energies by Dyer et al. [29] from 22 to 26 MeV and by Zobel et al. [14] at = 52 MeV. An estimated cross section curve is given in Ref. [3], however based on the then only available cross section data of Ref. [14] and limited to -particle energies below 20 MeV per nucleon. We therefore made a new estimation extending the energy range from threshold to 100 MeV per nucleon. Our best guess, based on the energy dependence of the (,4pxn) spallation data of Lange et al. [30] and the OM calculations is a linear interpolation between the cross sections at 26 MeV and 52 MeV. Below 22 MeV and above 52 MeV, we take the energy dependence of the OM calculations.
The results of the calculations for the mean excitation energy, the inelastic scattering angular distributions and the -ray production cross sections are presented in Table III.
B The inelastic scattering reaction 12C(,)
As already mentionned, practically no line shapes are available for this reaction and OM calculations at low -particle energies are not believed to be very realistic. To get anyway an idea of the magnetic substate population amplitudes, we employed two different methods at energies below 30 MeV. From = 8 - 17 MeV, we used the systematic measurements of differential cross sections d/d and laboratory -ray angular distributions d/d of Mitchell, Carter and Davis [31] and Ophel et al.[32]. We then used the Monte-Carlo type program described in subsection III.A to find a set of population amplitudes (with =, and here throughout =0 for 0+ 2+ excitations induced by inelastic -particle scattering on spin-0 targets like 12C) and phase shifts which reproduces the measured -ray angular distributions.
Morgan and Hobbie [33] measured in small energy steps between = 19-30 MeV inelastic differential cross sections. However, no -ray angular distributions or line shape measurements are available in that energy range. Therefore, we used OM calculations despite the fact that compound nucleus resonances are probably important below = 30 MeV. In order to reduce the effect of individual compound nucleus resonances, we averaged several differential cross sections of Ref. [33] centered around the -particle energies of 21 and 25 MeV. Between 30 MeV and 200 MeV, we used the inelastic scattering data of Burdzik and Heymann at 32.5 MeV [34], of Baron, Leonard and Stewart [35] at 41 MeV, of D’Agostino et al. at 90 MeV [36], of Smith et al. at 139 MeV [37] and of Tatischeff and Brissaud at 166 MeV [38]. With these differential cross sections OM fits were then done, again with the optical potential of Michel et al [28]. Results of the OM fits in the energy range = 17 - 166 MeV are shown in Fig. 4. Above 200 MeV, no inelastic differential cross sections are published. We continued to use the optical potential shape of Michel et al. for the inelastic scattering calculations, extrapolating up to 400 MeV the optical potential found at 166 MeV by following the energy dependence of the potential parameters given by Michel et al. for -particle scattering off 16O.
Again, as for proton inelastic scattering off 12C, the line shapes and -ray angular distributions predicted by the OM calculations were used to deduce population amplitudes and phase shifts for a consistent parameterization of the -ray emission in proton and -particle inelastic scattering off 12C in the energy range of interest for solar flares and low energy cosmic rays. The cross section excitation function is taken from Dyer et al. [29] for = 8-26 MeV, from the data of Refs. [34, 35, 36, 37, 38] at 32.5, 41, 90, 139 and 166 MeV, respectively, and from our OM calculations at 250 and 400 MeV. Results for the population amplitudes, phase shifts and total cross sections are presented in Table IV.
V Predicted line shapes in solar flares and discussion
With the above deduced reaction parameters, the line shape of the 4.438 MeV -ray emitted from the first excited state of 12C for proton and -particle interactions with 12C and 16O can be calculated for energies from threshold up to 100 MeV per nucleon. To illustrate the line shapes that can be expected from solar flares, we use a simple model of -ray production by energetic particle interactions in a thick target. For the accelerated particle energy distribution , we choose a spectrum as it results from diffuse shock acceleration [27]:
| (10) |
where and are the particle velocity and the momentum per nucleon, respectively; and are the spectral index and cutoff energy, specific to a given acceleration site. The energies labelled , , , in Eqs. (10,11) and in the following are expressed in energy per nucleon. The total number of 4.438 MeV -rays produced by interactions of projectiles of type (p or ) with target nuclei of type is then given by:
| (11) |
where is the abundance of isotope with respect to hydrogen and the density of hydrogen atoms at the interaction site; is the -ray production cross section and is the stopping power of particle . We made the simplifying assumption that the energy loss is only due to the electronic stopping power in a neutral gas, consisting of hydrogen and helium with = 0.1. The Bethe formula was used for the energy loss calculation.
We adopted two sets of and : = 3.3; = 30 MeV and = 2.4; 300 MeV corresponding to the fit of interplanetary proton observations of two distinct solar flares [27]. We set = 0.068%, = 0.042% as in Ref. [27], = 2 and an /p-ratio of 0.1.
In both cases, proton interactions dominate; they account for 82% and 84% of the -ray production with the softer and harder spectrum, respectively. With the softer spectrum, the -ray production is dominated by proton inelastic scattering off 12C (57%), of which in particular 85% of the -rays are produced by interactions at proton energies below 20 MeV. In order to get an overall impression of the quality of reproduction of the -ray lines from the important low energy proton inelastic scattering reactions, energy integrated data from the Orsay experiment were produced and compared with the calculations. Line shapes and -ray angular distributions for energy integrated experimental and calculated data between 8 MeV and 20 MeV for proton inelastic scattering off 12C, are represented in Fig. 5.
For the relatively hard spectrum with = 2.4 and setting = 300 MeV, proton induced spallation of 16O is the strongest channel, accounting for 46% of the 4.438 MeV -rays. Here, proton interactions at energies below 20 MeV are responsible for 24% of the total -ray production, and proton interactions at energies below 100 MeV account for 83% of the produced -rays. These values, however, have to be regarded as lower limits only, because secondary protons of low and intermediate energy produced by high energy proton and -particles and escape of accelerated particles into interplanetary space are not taken into account.
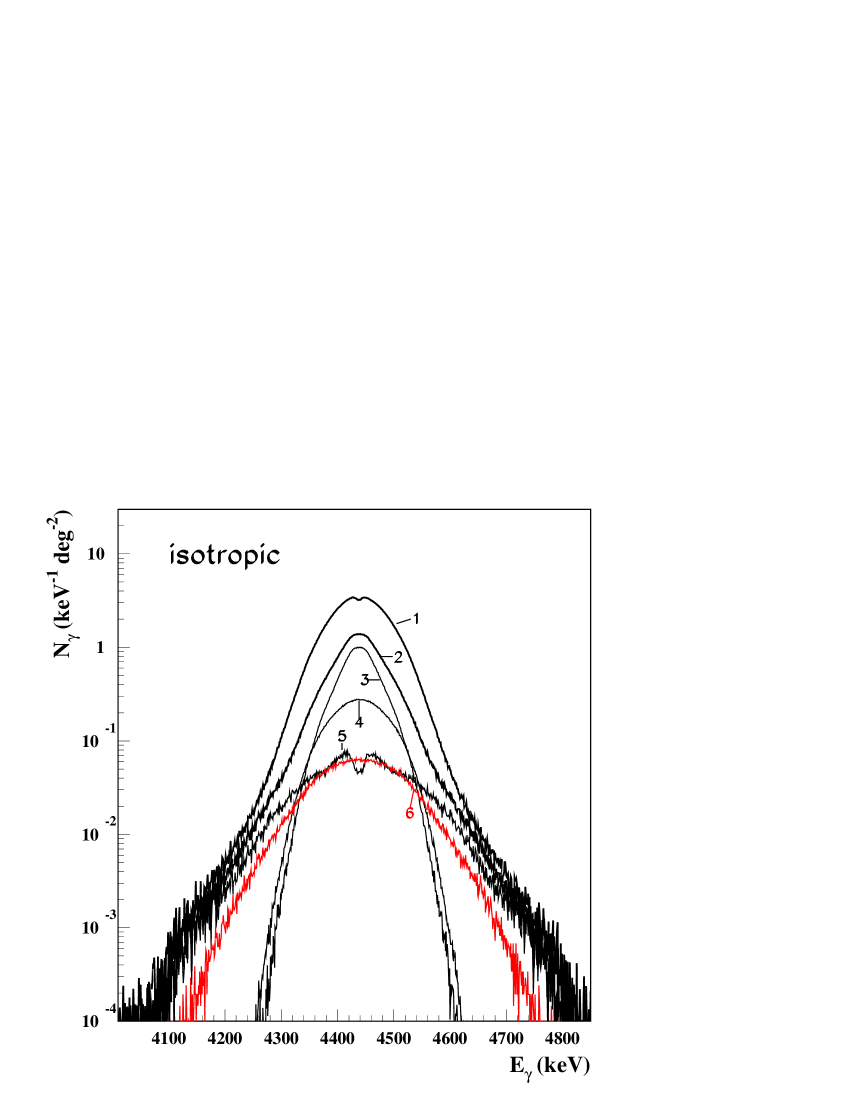
For the prediction of -ray line profiles from solar flares we calculate the interaction probability as in Eq. (11). No absorption or Compton scattering of the produced 4.438 MeV -ray in the solar atmosphere is taken into account. Three different energetic particle angular distributions have been investigated, similar to the distributions investigated by Murphy, Kozlovsky and Ramaty [5]: an isotropic angular distribution, a fan-beam flare and a downward flare. The narrow component of the 4.438 MeV -ray is shown in Figs. 6, 7 and 8 for the different energetic particle angular distributions and energy spectra, all with an /p-ratio of 0.1. All curves are arbitrarily normalized to a total kinetic energy in proton and -particles with 1 MeV of 108 erg.
The narrow component is clearly dominated by the p+12C reaction for the soft particle spectrum. Comparing curves 1 and 2 of Fig. 6, which shows the predicted line shapes for isotropic incident particle spectra, it seems possible to estimate the spectral hardness by the width of the line and the characteristic drop around 4.438 MeV only visible for the hard spectrum. This drop, also seen in curve 5 of Fig. 6 is not predicted by other parameterizations, as for example in Ref. [5].
Figure 7 shows the line profiles resulting from a downward directed energetic particle distribution at the solar limb. The parameterization of Ref. [5] for the population amplitudes reproduces qualitatively the characteristic line shape with two intensity maxima above and below the minimum at 4.438 MeV, but it underestimates slightly the maximum-to-minimum ratio and overestimates the intensity (by 10%) emitted at 90∘. Line-shapes produced by fan-beam distributions and an isotropic distribution as in Fig. 8 will be difficult to distinguish, showing only small differences in the overall line profile.
In summary, with the extracted nuclear reaction parameters in this work, line shape calculations for proton and -particle induced reactions on 12C and 16O can be done for all possible energetic particle angular distributions and for particle energies from threshold to about 100 MeV per nucleon, which is the important energy domain for solar flares and low energy cosmic rays. These parameters can also be straightforwardly used for the inverse reactions, energetic 12C and 16O bombarding proton and -particles.
It is the first parameterization for line shape calculations, which is largely based on experimental data and optical model calculations. Especially, the calculation of -ray line shapes from proton induced reactions is certainly very close to reality, as illustrated by the good reproductions of experimental line shapes in Figs. 1 and 4; at higher energies, the optical potential of Ref. [9] is believed to provide line shape reproductions of the same quality. Only line shapes from -particle induced inelastic scattering below 10 MeV per nucleon have to be regarded with some caution because of the only moderately successfull OM fits of differential inelastic cross sections. Here, new experimental data for -ray line shapes and angular distributions could greatly improve the parameterization. For -particle induced spallation of 16O above = 26 MeV, -ray production cross sections are needed.
This study confirms qualitatively older parameterizations for proton induced reactions, constructed with much less experimental data input [3] [5], but some of its predictions of line-profile details are slightly different. It shows, that extreme particle angular distributions, like isotropic or unidirectional ones can be nicely characterized, with even some hope to get an idea of the spectral hardness of the accelerated particle spectrum. High resolution detectors, like the Ge detectors on the HESSI spacecraft [10] and on the INTEGRAL observatory [39], could be able to resolve the fine structures in the line profiles which carry this information. Together with other -ray lines, one may then be able to extract most flare parameters, like the spectrum, composition and the angular distribution of the accelerated particles, as well as the isotopic composition of the ambient medium.
REFERENCES
- [1] W.T. Vestrand, G.H. Share, R.J. Murphy, D.J. Forest, E. Rieger, E.L. Chupp, and G. Kanbach, Astrophys. J. Suppl. Ser. 120, 409 (1999).
- [2] M. Cassé, R. Lehoucq, and E. Vangioni-Flam, Nature 373, 318 (1995); E. Parizot and L. Drury, Astron. Astrophys. 349, 673 (1999).
- [3] R. Ramaty, B. Kozlovsky, and R.E. Lingenfelter, Astrophys. J. Suppl. Ser. 40, 487 (1979).
- [4] R.J. Murphy, R. Ramaty, B. Kozlovsky, and D.V. Reames, Astrophys. J. 371, 793 (1991).
- [5] R.J. Murphy, B. Kozlovsky, and R. Ramaty, Astrophys. J. 331, 1029 (1988).
- [6] A.M. Bykov, S.V. Bozhokin, and H. Bloemen, Astron. Astrophys. 307 L37 (1996).
- [7] B. Kozlovsky, R. Ramaty, and R.E. Lingenfelter, Astrophys. J. 484, 286 (1997).
- [8] J. Kiener, M. Berheide, N.L. Achouri, A. Boughrara, A. Coc, A. Lefebvre, F. de Oliveira Santos, and Ch. Vieu, Phys. Rev. C 58, 2174 (1998).
- [9] A.S. Meigooni, R.W. Finlay, J.S. Peter, and J.P. Delaroche, Nucl. Phys. A445, 304 (1985).
- [10] http://www.hessi.ethz.ch/; http://hesperia.gsfc.nasa.gov/hessi/.
- [11] P. Dyer, D. Bodansky, A.G. Seamster, E.B. Norman, and D.R. Maxson, Phys. Rev. C 23, 1865 (1981); R. Ramaty (private communication).
- [12] K.T. Lesko, E.B. Norman, R.-M. Larimer, S. Kuhn, D.M. Meekhof, S.G. Crane, and H.G. Bussell, Phys. Rev. C 37, 1808 (1988).
- [13] F.L. Lang, C.W. Werntz, C.J. Crannell, J.L. Trombka, and C.C. Chang, Phys. Rev. C 35, 1214 (1987).
- [14] W. Zobel, F.C. Maienschein, J.H. Todd, and G.T. Chapman, Nucl. Sci. Eng. 32, 392 (1968).
- [15] K.J. Foley, G.L. Salmon, and A.B. Clegg, Nucl. Phys. 31, 43 (1962).
- [16] M.B. Epstein, J.R. Quinn, S.N. Bunker, J.W. Verba, and J.R. Richardson, Nucl. Phys. A169, 337 (1971).
- [17] J.F. Ziegler, “TRIM”, http://www.research.ibm.com/ionbeams/.
- [18] M. Buenerd, P. Martin, P. de Saintignon, and J.M Loiseaux, Phys. Rev. C 14, 1316 (1976).
- [19] C.M Perey and F.G. Perey, At. Data Nucl. Data Tables 17, 1 (1976).
- [20] J. Raynal, Notes on Ecis94, Note CEA-N-272, 1994 (unpublished).
- [21] R.B. Firestone, V.S. Shirley, C.M. Baglin, S.Y. Frank Chu, and J. Zipkin, Table of isotopes, (John Wiley & Sons, New York, 1996).
- [22] G.R. Satchler, Direct Nuclear Reactions, (Clarendon Press, Oxford, Oxford University Press, New York, 1983).
- [23] J.D. Jackson, Classical Electrodynamics, (John Wiley & Sons, New York, 1975).
- [24] J.J. Kolata, R. Auble, and A. Galonsky, Phys. Rev. 162, 957 (1967).
- [25] R.W. Peelle, Phys. Rev. 105, 1311 (1957).
- [26] A.C.L. Barnard, J.B. Swint, and T.B. Clegg, Nucl. Phys. 86, 130 (1966).
- [27] R.J. Murphy, C.D. Dermer, and R. Ramaty, Astrophys. J. Suppl. Ser. 63, 721 (1987).
- [28] F. Michel, J. Albinski, P. Belery, Th. Delbar, Gh. Grégoire, B. Tasiaux, and G. Reidemeister, Phys. Rev. C 28, 1904 (1983).
- [29] P. Dyer, D. Bodansky, D.D. Leach, E.B. Norman, and A.G. Seamster, Phys. Rev. C 32, 1873 (1985).
- [30] H.J. Lange, T. Hahn, R. Michel, T. Schiekel, R. Rösel, U. Herpers, H.-J. Hofmann, B. Dittrich-Hannen, M. Suter, W. Wölfli, and P.W. Kubik, Appl. Radiat. Isot. 46, 93 (1995).
- [31] G.E. Mitchell, E.B. Carter, and R.H. Davis, Phys. Rev. 133, B1434 (1964).
- [32] T.R. Ophel, Ph. Martin, S.D. Cloud, and J.M. Morris, Nucl. Phys. A173, 609 (1971).
- [33] J.F. Morgan and R.K Hobbie, Phys. Rev. C 1, 155 (1970).
- [34] G.F. Burdzik and G. Heymann, Nucl. Phys. A185, 509 (1972).
- [35] N. Baron, R.F. Leonard, and W.M. Stewart, Phys. Rev. C 4, 1159 (1971).
- [36] P. d’Agostino, G. Fazio, G. Giardina, O.Yu. Goryunov, M. Sacchi, A.A. Shvedov, I.N. Vishnevsky, and I.Yu. Zaiatz, Nucl. Phys. A583, 437 (1995).
- [37] S.M. Smith, G. Tibell, A.A. Crowley, D.A. Goldberg, H.G. Pugh, W. Reichart, and N.S. Wall, Nucl. Phys. A207, 273 (1973).
- [38] B. Tatischeff and I. Brissaud, Nucl. Phys. A155, 89 (1970).
- [39] C. Winkler, Astron. Astrophys. Suppl. 120, 637 (1996); http://astro.estec.esa.nl/SA-general/Projects/Integral/integral.html.
( = 16 - 20 MeV): Mean excitation energies x in 16O from the adjustment of the 4.438 MeV -ray lines of the Orsay experiment [8]. Isotropic inelastic scattering angular distributions were used (=0).
( = 22.5 - 100 MeV): Mean excitation energies x in 16O and fit-parameter of the inelastic scattering angular distributions 16O(p,p’) obtained by OM calculations. For 16 MeV, the values of 16 MeV were used.
| (MeV) | (mb) | x (MeV) | (deg-1) |
|---|---|---|---|
| 14 | 3 | 12.75 | .0 |
| 15 | 16 | 12.75 | .0 |
| 16 | 40 | 12.75 | .0 |
| 17 | 64 | 13.25 | .0 |
| 18 | 85 | 14.0 | .0 |
| 20 | 140 | 14.75 | .0 |
| 22.5 | 156 | 14.7 | .001 |
| 25 | 137 | 15.5 | .008 |
| 30 | 95 | 17.1 | .009 |
| 40 | 55 | 18.0 | .027 |
| 45 | 44 | 18.3 | .030 |
| 66 | 24 | 18.5 | .057 |
| 100 | 14 | 18.5 | .078 |
( = 8.6 - 19.75 MeV): Result of the adjustment of the population amplitudes and the phase shift to measured line shapes from the Orsay experiment [8] and -ray angular distributions from the Orsay experiment and from the Washington experiment [11].
( = 25 - 100 MeV): Result of the adjustment of the population amplitudes and the phase shift to line shapes and -ray angular distributions resulting from OM calculations. Population amplitudes below 8.6 MeV are an average of the extracted values from 8.6-10.6 MeV.
The amplitudes are normalized such that and .
| (MeV) | (mb) | (deg) | |||
|---|---|---|---|---|---|
| 5 | 51 | .64 | .27 | .47 | 30 |
| 6 | 55 | .64 | .27 | .47 | 30 |
| 7 | 108 | .64 | .27 | .47 | 30 |
| 8 | 240 | .64 | .27 | .47 | 30 |
| 8.6 | 270 | .57 | .28 | .51 | 35 |
| 9.0 | 290 | .66 | .26 | .46 | 30 |
| 9.6 | 275 | .71 | .35 | .35 | 30 |
| 10.0 | 265 | .70 | .28 | .42 | 30 |
| 10.6 | 296 | .59 | .21 | .53 | 20 |
| 11.0 | 317 | .55 | .33 | .49 | 35 |
| 11.4 | 298 | .56 | .34 | .45 | 30 |
| 12.0 | 270 | .55 | .22 | .55 | 25 |
| 12.6 | 277 | .42 | .08 | .63 | 25 |
| 13.0 | 282 | .40 | .12 | .64 | 25 |
| 13.6 | 281 | .42 | .13 | .63 | 25 |
| 14.0 | 281 | .42 | .13 | .63 | 25 |
| 14.4 | 255 | .42 | .13 | .63 | 25 |
| 15.2 | 217 | .42 | .13 | .63 | 25 |
| 16.25 | 188 | .33 | .03 | .66 | 20 |
| 17.25 | 166 | .27 | .03 | .68 | 20 |
| 18.25 | 153 | .27 | .16 | .66 | 15 |
| 19.75 | 130 | .29 | .20 | .64 | 15 |
| 25 | 99 | .25 | .025 | .68 | 112.5 |
| 35 | 69 | .37 | .0 | .66 | 100 |
| 49.5 | 23 | .43 | .0 | .64 | 100 |
| 75 | 14 | .51 | .0 | .61 | 95 |
| 100 | 11 | .58 | .0 | .58 | 90 |
| (MeV) | (mb) | (deg-1) | / | x (MeV) |
|---|---|---|---|---|
| 18 | 0.22 | .020 | .12 | 12.8 |
| 20 | 19 | .017 | .01 | 12.8 |
| 22 | 44 | .012 | -.08 | 13.0 |
| 24 | 102 | .009 | .06 | 13.8 |
| 26 | 125 | .008 | .27 | 14.2 |
| 28 | 124 | .005 | .51 | 14.5 |
| 30 | 123 | .003 | .61 | 14.8 |
| 35 | 120 | .001 | 1.91 | 15.7 |
| 40 | 117 | .010 | .94 | 16.3 |
| 50 | 111 | .019 | .99 | 16.6 |
| 60 | 139 | .015 | .42 | 17.1 |
| 100 | 223 | .074 | .0 | 18.4 |
| 150 | 172 | .125 | .0 | 18.8 |
| 250 | 100 | .31 | .0 | 19.0 |
| 400 | 53 | .51 | .0 | 19.0 |
| (MeV) | (mb) | (deg) | |||
|---|---|---|---|---|---|
| 8 | 48 | .0 | .0 | .71 | -5 |
| 9 | 72 | .0 | .0 | .71 | -5 |
| 10 | 231 | .0 | .0 | .71 | -5 |
| 11 | 347 | .0 | .0 | .71 | -5 |
| 12 | 393 | .0 | .0 | .71 | -5 |
| 13 | 361 | .0 | .0 | .71 | -10 |
| 14 | 431 | .14 | .0 | .70 | -22.5 |
| 15 | 381 | .0 | .0 | .71 | -12.5 |
| 16 | 371 | .17 | .0 | .70 | -22.5 |
| 17 | 306 | .27 | .0 | .68 | -32.5 |
| 21 | 276 | .68 | .0 | .52 | -102.5 |
| 25 | 292 | .65 | .0 | .54 | -90 |
| 32.5 | 141 | .61 | .0 | .56 | -90 |
| 41 | 94 | .37 | .0 | .66 | -55 |
| 90 | 45 | .37 | .0 | .66 | -70 |
| 139 | 27 | .45 | .0 | .63 | -70 |
| 166 | 26 | .40 | .0 | .65 | -75 |
| 250 | 18 | .37 | .0 | .66 | -80 |
| 400 | 6 | .58 | .0 | .58 | -80 |


(Lower part): Laboratory -ray angular distribution from that reaction. Full squares: data from the Orsay experiment, full triangles: experimental data of the Washington experiment [11] at = 20 MeV, normalized to the Orsay data, full line: calculated distribution with the population amplitude method.


(Lower part): Summed laboratory -ray angular distributions. The summed experimental distributions are constructed from Legendre-polynom fits of the Orsay data and are shown by the full line, while the dashed line shows the angular distribution resulting from the population amplitudes method.