NH3 in the Central 10 pc of the Galaxy I: General Morphology and Kinematic Connections Between the CND and GMCs
CAPTIONS
Abstract
New VLA images of NH3 (1,1), (2,2), and (3,3) emission in the central 10 parsecs of the Galaxy trace filamentary streams of gas, several of which appear to feed the circumnuclear disk (CND). The NH3 images have a spatial resolution of and have better spatial sampling than previous NH3 observations. The images show the “southern streamer,” “50 km s-1 cloud,” and new features including a “western streamer”, 6 parsecs in length, and a “northern ridge” which connects to the CND. NH3(3,3) emission is very similar to 1.2 mm dust emission indicating that NH3 traces column density well. Ratios of the NH3(2,2) to (1,1) line intensities give an estimate of the temperature of the gas and indicate high temperatures close to the nucleus and CND. The new data cover a velocity range of 270 km s-1, including all velocities observed in the CND, with a resolution of 9.8 km s-1. Previous NH3 observations with higher resolution did not cover the entire range of velocities seen in the CND. The large-scale kinematics of the CND do not resemble a coherent ring or disk. We see evidence for a high velocity cloud within a projected distance of 50′′ (2 pc) which is only seen in NH3(3,3) and is likely to be hot. Comparison to 6 cm continuum emission reveals that much of the NH3 emission traces the outer edges of Sgr A East and was probably pushed outward by this expanding shell. The connection between the northern ridge (which appears to be swept up by Sgr A East) and the CND indicates that Sgr A East and the CND are in close proximity to each other. Kinematic evidence for these connections is presented in this paper, while the full kinematic analysis of the central 10 pc will be presented in Paper II.
1 Introduction
At a distance of kpc (Reid, 1993), the center of the Milky Way provides an excellent laboratory for high resolution studies of galactic nuclei. Images of radio continuum emission from the region are dominated by a strong point source, Sgr A*, which is most likely a M⊙ black hole located at the dynamical center of the Galaxy (Morris & Serabyn, 1996; Eckart & Genzel, 1997; Genzel et al., 1997; Ghez et al., 1998; Reid et al., 1999). Sgr A* is surrounded by a “mini-spiral” composed of arcs of ionized gas that are falling towards and orbiting the black hole (Lo & Claussen, 1983; Roberts & Goss, 1993). A ring of molecular material at a radius of 2 pc from the Galactic Center surrounds the mini-spiral and is referred to as the circumnuclear disk (CND) (Genzel et al., 1985; Harris et al., 1985; Serabyn et al., 1986; Gatley et al., 1986; Güsten et al., 1987; Sutton et al., 1990; Marr, Wright , & Backer, 1993; Marshall et al., 1995). The name was inspired by early observations of HCN and HCO+ which showed signatures of a single rotating disk with the center swept clear of material (Güsten et al., 1987). The western arc of the mini-spiral traces the ionized inner edge of the CND, while the northern and eastern arms, which extend towards Sgr A*, may be the result of cloud-cloud collisions in the CND (Lo & Claussen, 1983; Serabyn & Lacy, 1985; Genzel et al., 1985; Güsten et al., 1987; Roberts & Goss, 1993).
However, with the recent increase in sensitivity and resolution of instruments, the morphology and kinematics of the gas near the Galactic Center now appear to be much more complicated than originally thought. The CND is composed of many clumps with an average density of cm-3. Wide-field interferometric mosaics of the region in HCN(1-0) and HCO+(1-0) (Wright et al., 2001) show that the CND has a distinct outer edge at from the nucleus, making it resemble a ring more than a disk. Güsten et al. (1987) observe that the northeast and southwest lobes of the CND appear to have different angles of inclination. While the northeastern sections of the CND are best fit by an inclination of 70-75∘, the southwestern lobe of the CND seems to be at an inclination of . This observation led Güsten et al. (1987) to the conclusion that the CND is warped. The southeastern side of the CND is weak in many tracers (including HCN and HCO+) suggesting that this part of the “ring” may be missing altogether. Jackson et al. (1993) propose that the two bright lobes of the CND are in fact distinct clouds on independent orbits around the nucleus and do not compose a single ring of gas. Wright et al. (2001) find kinematic evidence that the CND is composed of at least three distinct clouds which are orbiting the black hole. In addition, the northern arm of the mini-spiral actually appears to originate outside the CND and cross through on its way towards the Galactic Center (Wright et al., 2001). The idea that the CND and the mini-spiral are composed of multiple distinct clouds under the gravitational influence of the nucleus easily explains the observed “warping” as well as the complex kinematics and clumpy morphology observed in the region (Dent et al., 1993; Jackson et al., 1993; Wright et al., 2001).
Past observations of the central regions of the Galaxy also provide insight into questions about the origin of the CND and the clouds which compose it. If the CND is composed of many distinct clouds, then it should be possible to trace where the clouds come from and determine the origin of the CND. Many attempts have been made to detect connections between two nearby giant molecular clouds (GMCs) and the CND. Okumura et al. (1989), Ho et al. (1991), and Coil & Ho (1999, 2000) detect a long filamentary “streamer” in NH3 (1,1) and (2,2) emission that connects the “20 km s-1 cloud” (M-0.13–0.08, Güsten, Walmsley , & Pauls (1981)) to the southeastern edge of the CND. A small velocity gradient along this “southern streamer” as well as heating and increased line widths as the streamer approaches the Galactic Center indicate that gas is flowing from the 20 km s-1 cloud towards the circumnuclear region. This connection has also been observed in HCN(3-2) (Marshall et al., 1995), 13CO(2-1) (Zylka, Mezger , & Wink, 1990) and 1.1 mm dust (Dent et al., 1993). An extension of the 20 km s-1 cloud towards the southwest lobe of the CND was also seen in NH3 (1,1) and (2,2). Due to the lack of pointings to the west of the CND, Coil & Ho (1999, 2000) could not search for a connection between this extension and the CND. However, the morphological connection between the 20 km s-1 cloud and the southwest lobe of the CND is observed in dust (Zylka, 1998). Other signs of connections between the GMCs and the CND include a possible connection between the northeastern edge of the CND and the “50 km s-1 cloud” (M-0.03–0.07, Güsten, Walmsley , & Pauls (1981)) observed in HCN(1-0) (Ho, 1993).
We present maps of the central 10 parsecs of the Galaxy in the (1,1), (2,2), and (3,3) transitions of NH3. Unlike previous NH3 observations, our new data cover the entire velocity range seen in molecules at the Galactic Center and have improved spatial sampling which provide a more complete picture of NH3 in the central 10 pc of the Galaxy and enable a more reliable comparison of NH3 emission to other tracers. With this data, we can probe the morphology and kinematics of all of the CND as well as the surrounding molecular material. Paper I focuses on the general morphology of velocity integrated NH3 emission from the region, including comparisons to HCN(1-0), HCN(3-2), 1.2 mm dust, and 6 cm continuum emission. New features to the north and west of the CND are observed, producing a complete picture of NH3 (1,1), (2,2), and (3,3) emission in the central 10 parsecs. At least three physical connections between the GMCs and the CND are observed, with kinematic information presented for these features. A detailed discussion of kinematics of the entire central 10 pc, including temperatures, opacities, and cloud masses, will be presented in a following paper.
1.1 Observations
We observed the (1,1), (2,2), and (3,3) rotation inversion transitions of NH3, at 23.694495, 23.722633, and 23.870129 GHz, respectively, with the National Radio Astronomy Observatory’s Very Large Array111The National Radio Astronomy Observatory is a facility of the National Science Foundation operated under cooperative agreement by Associated Universities, Inc. (VLA) telescope in 1999 March. Observations were made in the D-northC array which provides the shortest baselines and the most circular synthesized beam possible for this low declination source (). A five-pointing mosaic was used to fully sample the central 4′ (10 pc) of the Galaxy. The full width at half maximum (FWHM) of the primary beam is 125′′ at 23 GHz for the 25 m VLA antennas. To ensure the field was properly sampled, one pointing was centered on Sgr A* (17h45m40, ) while the other four pointings were offset by 1′ to the northeast, northwest, southeast, and southwest. At least one hour on source was obtained for each pointing at each frequency. The data consist of 31 channels with a width of 9.8 km s-1 (0.78 MHz) centered on a of –10.6 km s-1 and covering km s-1.
Coil & Ho (1999,2000) imaged the circumnuclear region in NH3 (1,1) and (2,2) with a total velocity coverage of km s-1 and a velocity resolution of 5 km s-1. In their mosaics, fields on the CND were centered on km s-1 while fields to the south and east of the CND were centered on km s-1. The narrow velocity coverage excluded high velocity emission which is seen up to 110 km s-1 in the CND. In addition, Coil & Ho (1999, 2000) focused on the southern streamer and the 50 km s-1 cloud and had no pointings to the north or west of the CND. The images presented in this paper represent the first time that the (1,1), (2,2), and (3,3) transitions of NH3 have been fully sampled over the central 4′ with a velocity coverage that includes all of the emission from the CND.
2 Data Reduction
Each pointing was calibrated separately using NRAO’s Astronomical Imaging Processing System (). Anomalously high points and large closure errors were removed. Calibration of the amplitudes and phases were performed using 1331+305 (3C286) and 1733–130. Since Sgr A* is a strong source at 23 GHz and within the primary beam of each pointing, self-calibration was successfully applied to each of the fields. The calibrator 1229+020 was used for bandpass calibration to correct instrumental phase offsets across the band and to remove the roll-off in sensitivity at the edge of the band. Channels 1, 30, and 31 could not be fully corrected and were removed from the dataset resulting in a velocity coverage of –140 to +130 km s-1. Once the data were calibrated, line-free channels were used to model the continuum emission and remove it from the data.
The fully calibrated, continuum-free data cubes were imaged in MIRIAD (Sault, Teuben , & Wright, 1995), which offers superior tools for making mosaics and analyzing the spectral information. The five pointings were combined into a single mosaic in the plane. For the maps presented in this paper, we used the maximum entropy method (MEM) to deconvolve the images. Previous NH3 mosaics were deconvolved using the CLEAN algorithm in which the field is assumed to be composed of points sources. As a result, negative bowls surround bright extended features, possibly obscuring faint connections between clouds (see Coil & Ho (1999, 2000)). MEM is better suited to handle fields of extended emission and does not produce these negative bowls. However, MEM does not conserve the integrated flux density in the map. To check our deconvolution, we deconvolved the data using both CLEAN and MEM. The two images agree on every main feature with the only difference in the low-level emission surrounding bright features. The integrated flux densities in both maps are also equal indicating that MEM did not add substantial flux to the image. In order to recover the low-level emission in the map, the mosaic was imaged using a Gaussian taper applied to the data resulting in a synthesized beam of at a position angle of in all three maps.
3 Morphology of the Central 10 pc
The NH3 (1,1), (2,2), and (3,3) velocity integrated (270 km s-1) images are shown in Figures NH3 in the Central 10 pc of the Galaxy I: General Morphology and Kinematic Connections Between the CND and GMCs, NH3 in the Central 10 pc of the Galaxy I: General Morphology and Kinematic Connections Between the CND and GMCs, and NH3 in the Central 10 pc of the Galaxy I: General Morphology and Kinematic Connections Between the CND and GMCs. In all three images, the approximate location of the CND (Marr, Wright , & Backer, 1993) is represented by two ellipses and the location of Sgr A* is marked by a cross. If a straight summation of each channel map is used to create the velocity integrated image, emission from narrow-line features, which appear in only a small fraction of the channels, is diluted by the increased noise in the summed map. In order to avoid this problem and present a map showing all of the emission in the region, each channel map was clipped below before the channels were summed. This procedure was performed in AIPS using the IFLUX parameter in MOMNT. The resulting image had features on the size scale of single pixels as a result of the blanking process. To remove these artifacts, the image was convolved with a gaussian beam with FWHM=. Since the gaussian was significantly narrower than the image beam, the final beam size for our images was only slightly increased to .
If the noise in one channel is known, then the noise in the velocity integrated image (in Jy beam-1 km s-1) is simply , where is the number of channels in the summation, is the channel width in km s-1, and is the noise in one channel. Since the maps were clipped below in each channel, varies for each pixel in our maps. However, we assume most features show emission in of the channels and adopt , where km s-1 and is measured in the individual channels. The resulting noise in our images is Jy beam-1 km s-1, Jy beam-1 km s-1, and Jy beam-1 km s-1 for the NH3 (1,1), (2,2) and (3,3) velocity integrated images, respectively. For features with emission in a very narrow velocity range, the signal-to-noise (S/N) will be underestimated in our map by a factor of where is the true number of channels in which the feature appeared. Thus, a feature with emission in only one channel will have and the S/N underestimated by a factor of 2.6. The S/N of broad velocity features is overestimated in our images by a factor of and the S/N for a feature with emission in all channels is overestimated by a factor of 2. There are few examples of these extremes in our data and the contours presented here are a reliable indicator of the significance of the detections. The additional complication in the noise analysis is well worth the benefits of being able to see all of the emission from the Galactic Center without losing narrow-line features due to the increased noise of a straight summed map.
For reference, we also present the NH3 (3,3) channel maps in Figure NH3 in the Central 10 pc of the Galaxy I: General Morphology and Kinematic Connections Between the CND and GMCs. No clipping has been performed on these maps and the noise should be constant at all pixels (ignoring any effect of MEM deconvolution). The maps were not convolved by the gaussian beam and have a resolution of . Narrow-line features such as the northern ridge are clearly visible.
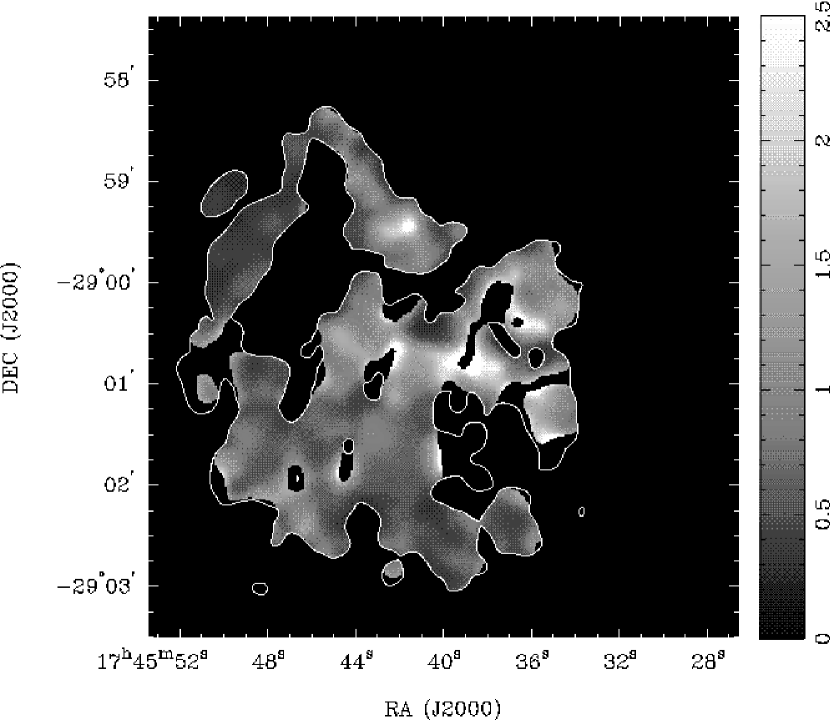
In addition to the velocity integrated images, a line ratio map of NH3 (2,2) to (1,1) emission is shown in Figure NH3 in the Central 10 pc of the Galaxy I: General Morphology and Kinematic Connections Between the CND and GMCs. Line ratios of the NH3 transitions are reliable indicators of gas temperatures (Ho & Townes, 1983; Walmsley & Ungerechts, 1983; Danby et al., 1988) and can be helpful in understanding conditions near the Galactic Center. Only points with NH3(1,1) emission and NH3(2,2) emission are included in the map, and the single contour marks a detection of NH3(2,2) emission. Thus, regions inside this contour and with no greyscale were excluded on the basis of low NH3(1,1) brightness and may be very hot with high line ratios.
Gas at the location of the CND is seen in all three velocity integrated images although it is best traced by NH3 (3,3). NH3(3,3) is expected to be brighter than NH3(1,1) and (2,2) by a factor of 2 due to a quantum mechanical degeneracy of the states in the ortho species of NH3 (Ho & Townes, 1983). The southern half of the CND is much stronger in NH3 (2,2) than (1,1) and Figure NH3 in the Central 10 pc of the Galaxy I: General Morphology and Kinematic Connections Between the CND and GMCs shows the increased line ratio in the region. Assuming the CND is optically thin in NH3 (1,1) and (2,2) (consistent with the results of Coil & Ho (1999, 2000)), the observed ratio of NH3 (2,2) to (1,1) emission of 1.5 implies a rotational temperature of 50 K and a kinetic temperature of 60 K in the southeastern half of the CND (Danby et al., 1988; Ho & Townes, 1983). This is hotter than material farther from the nucleus. Emission to the south and east of the CND has a typical line ratio indicating a rotational temperature of no more than K for gas more than 2 pc to the south or east of the Galactic Center
The NH3 images contain many long filamentary features which we refer to as streamers. The “southern streamer” (Okumura et al., 1989; Ho et al., 1991; Coil & Ho, 1999, 2000), labeled in Figure NH3 in the Central 10 pc of the Galaxy I: General Morphology and Kinematic Connections Between the CND and GMCs, can be seen beginning at moving to the northeast to , and intersecting the CND at . Two clouds, previously observed by Ho et al. (1991), are located to the east of the southern streamer and are labeled as “SE1” and “SE2”. These clouds appear to connect to the southern streamer in all three images. The bright, “y”-shaped cloud in the northeast centered on is the “50 km s-1” giant molecular cloud which is being impacted on the west by Sgr A East (see section 4.2). Emission from SE1, SE2, and the southern streamer connect the 20 km s-1 cloud in the south to the 50 km s-1 cloud in the east. In fact, SE2 is the southern half of the “molecular ridge” discussed by Coil & Ho (2000).
The detection of SE1 is a good example of the improved quality of our new images compared to previous NH3 mosaics. Although the new data still show mainly filamentary structures, there are more faint connections between clouds than in previous images by Coil & Ho (1999, 2000). Only faint emission was seen from SE1 in Coil & Ho (2000), while we find this feature to be as strong as SE2. Our ability to detect SE1 reflects the lack of negative bowls near bright structures when MEM is used to deconvolve the images, whereas only CLEAN was used by Coil & Ho (1999, 2000). Our improved spatial sampling and velocity coverage as well as the use of MEM deconvolution has resulted in more robust NH3 images.
A new ridge of NH3(3,3) emission is seen in Figure NH3 in the Central 10 pc of the Galaxy I: General Morphology and Kinematic Connections Between the CND and GMCs to the north of the CND from , to , and lies along the northern edge of Sgr A East. In the NH3(1,1) and (3,3) images, this “northern ridge” is connected to the CND at , by a narrow streamer . The northern ridge was not in the field of view of the Coil & Ho (1999, 2000) mosaic. Finally, there is a long “western streamer” running approximately north-south from to . Multiple faint connections between the western streamer and the CND are seen at , , , , and , and are discussed in more detail in Section 5.
4 Comparison to Other Tracers
The large velocity coverage and uniform spatial sampling of our NH3 images present a unique opportunity to compare NH3 emission in the Galactic Center to emission from other tracers. In the following sections, NH3 (3,3) emission is compared to HCN(1-0), HCN(3-2), 1.2 mm dust, and 6 cm continuum emission.
4.1 Comparison to HCN(1-0)
Comparison of NH3(3,3) to HCN(1-0) has proved difficult with the two molecules apparently tracing different features at the Galactic Center (Coil & Ho, 1999, 2000; Wright et al., 2001). However, the images that were compared were often unevenly sampled or had very different velocity coverage and resolution. Figure NH3 in the Central 10 pc of the Galaxy I: General Morphology and Kinematic Connections Between the CND and GMCs shows the velocity integrated NH3 (3,3) image in contours overlaid on a HCN(1-0) mosaic of the central 12.5 pc by Wright et al. (2001). The NH3(3,3) image has been convolved with a Gaussian taper to a resolution of and the HCN(1-0) image has a resolution of . Although the NH3 mosaic was made from VLA data and the HCN(1-0) image was made from a 19-pointing BIMA mosaic, these two images are similar in their velocity and spatial coverage. The NH3(3,3) image is fully sampled out to 4′ with a velocity coverage of –140 km s-1 to +130 km s-1 while the HCN(1-0) image is fully sampled out to 5′ and has a slightly broader velocity coverage of km s-1. The velocity resolution of the HCN(1-0) image is 5 km s-1 whereas the NH3 resolution is 10 km s-1. The high quality of these two datasets enables the most robust comparison of emission from NH3(3,3) and HCN(1-0).
4.1.1 Comparison of emission from the CND
The ring-like structure of the CND is clearly seen as the backwards “C” in the center of the HCN(1-0) image. Both molecules show peaks in the northeast and southwest of the CND, but the peaks are not in the same location. Although the relative intensities differ, there is emission from both molecules around the entire ring except in the southeast where there is a conspicuous lack of emission. A narrow, north-south gap in the northern part of the CND is observable in HCN(1-0), and there is a distinct edge in the NH3(3,3) emission coincident with the edge of the gap. While the HCN(1-0) emission appears to have been pulled into a long filament at the gap (, to ), the NH3 does not appear to be as extended towards the north. However, the resolution of the NH3 maps makes it difficult to trace small scale features which can be seen in the HCN(1-0) image. This gap may be the result of the northern arm crossing through the CND (see Section 4.3).
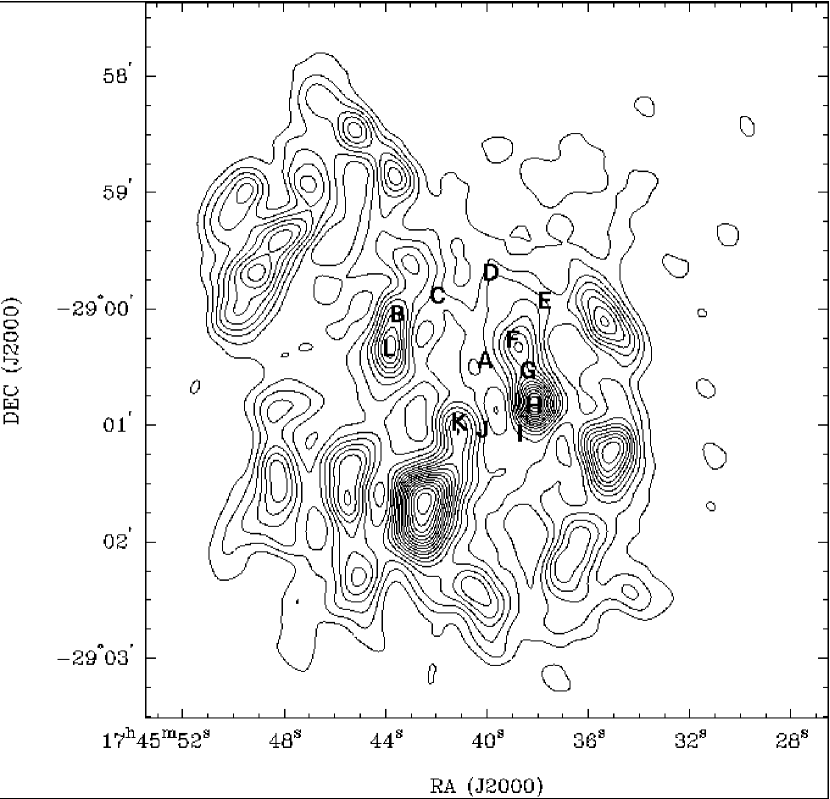
Kinematic information must be used to determine whether NH3(3,3) is tracing the same features of the CND observed in HCN(1-0). Figure NH3 in the Central 10 pc of the Galaxy I: General Morphology and Kinematic Connections Between the CND and GMCs shows the location of 12 spectra near the CND. The corresponding spectra are shown in Figure NH3 in the Central 10 pc of the Galaxy I: General Morphology and Kinematic Connections Between the CND and GMCs. Spectra A - J are at the same locations as the HCN(1-0) spectra in Wright et al. (2001); spectra K and L are located at two bright NH3 features. Spectra for these two features were not shown in Wright et al. (2001), but we include them here for comparison to NH3. The NH3(3,3) spectra are shown in thick lines with the HCN(1-0) spectra shown in thin lines, scaled down by a factor of 8.
Spectrum A is centered on Sgr A*. HCN(1-0) shows significant absorption from known clouds along the line-of-sight (Wright et al. (2001) and references therein). NH3(3,3) shows some weak absorption at 0 km s-1, but also some emission near 40 km s-1. Less absorption along the line-of-sight in NH3(3,3) is due to the low optical depth of NH3(3,3) compared to HCN(1-0) which is optically thick over most of the region (Wright et al., 2001).
Spectra E and G show features at the same velocity in NH3(3,3) and HCN(1-0). In spectrum E, both NH3(3,3) and HCN(1-0) show a feature at 70 km s-1, but HCN(1-0) shows an additional feature at –60 km s-1. In spectrum G, there are HCN(1-0) and NH3 features at both +50 and +80 km s-1. Although the dip in the profile looks like it could be the result of self-absorption, position-velocity cuts in NH3(3,3) through the western side of the CND indicate that this spectrum is the result of the superposition of two clouds along the line-of-sight. In the spectra that agree kinematically, the relative intensities of the lines are often different. NH3(3,3) is especially weak in high velocity gas. In HCN(1-0), spectrum I is dominated by a single feature at –110 km s-1. This feature is seen in NH3(3,3), but it is weak and surrounded by faint features at –20, 20, and 50 km s-1. In spectrum C, there is bright HCN(1-0) emission at +100 km s-1, but there is no significant detection of this feature in NH3(3,3).
Several NH3(3,3) spectra have a peak velocity 10-30 km s-1 less than HCN(1-0). Spectrum B peaks at 60 km s-1 in NH3(3,3) and 75 km s-1 in HCN(1-0). Spectrum F shows a similar difference and peaks at 50 km s-1 in NH3(3,3) and 60 km s-1 in HCN(1-0). In spectrum D, the NH3(3,3) emission is 30 km s-1 lower than the HCN(1-0) emission. While the HCN(1-0) emission peaks at 70 km s-1, we see the NH3 peak at km s-1. In Wright et al. (2001), spectrum B is nearly crossed by position-velocity cut (see Figure 13, position 25′′, Wright et al. (2001)). In this position-velocity diagram, absorption is seen at nearby positions from 60 to 80 km s-1. This absorption may affect spectrum B, causing the profile of this spectrum to have a sharp cut-off below 80 km s-1. If the low velocity emission has been absorbed, then the true distribution of HCN(1-0) emission may actually be centered at a lower velocity and agree with the peak velocity of 60 km s-1 seen in NH3(3,3) emission. Similar indications of absorption are seen in position velocity cuts of HCN(1-0) emission near Spectra D and F. In HCN(1-0), spectrum D appears to be affected by absorption at 60 km s-1 (see Figure 13, position 20′′, Wright et al. (2001)). Spectrum F has an asymmetric profile in HCN(1-0). Although this may be the result of a shock, it could also be attenuated at low velocities by HCN(1-0) absorption. There is absorption in HCN(1-0) from –60 to +50 km s-1 near the position of spectrum F (see Figure 13, position –50′′, Wright et al. (2001)).
Spectra H and J indicate self-absorption of HCN(1-0). In Wright et al. (2001), many HCN(1-0) features showed evidence for self-absorption, especially in the position-velocity diagrams. In spectrum H, NH3(3,3) appears to peak between the HCN(1-0) emission at +20 and –40 km s-1 indicating that the feature at –10 km s-1 may have been self-absorbed in HCN(1-0) leaving only the wings of the emission. In spectrum J, the two HCN(1-0) peaks at –40 and –70 km s-1 could be the wings of a self-absorbed spectrum.
Some of the brightest NH3(3,3) emission from the CND is seen in spectra K and L. There is little HCN(1-0) emission in K, while in L the HCN(1-0) is shifted to a higher velocity. The shift in L is similar to spectrum B which is near the same location in the CND. In NH3(3,3), both K and L have a very narrow profile in NH3 with a FWHM of km s-1. These profiles are much narrower than all other spectra in the CND.
The general agreement of the NH3(3,3) and HCN(1-0) spectra, especially when absorption along the line-of-sight and self-absorption are considered, shows that NH3(3,3) traces the main features of the CND. The complex spectra in both molecules are an indication of the complicated gas kinematics in the CND. When the NH3(3,3) data are considered, it becomes even more evident that the CND is not a coherent ring, but rather is composed of many distinct features. The difference in relative intensity of NH3(3,3) and HCN(1-0) may be explained by opacity or a variety of chemical effects including evaporation of NH3 off of dust grains (see Wright et al. (2001) for a more detailed discussion).
4.1.2 Comparison of emission outside the CND
It is also important to compare NH3(3,3) and HCN(1-0) emission outside the CND. Overall, the HCN(1-0) appears to have a more diffuse distribution with faint emission seen over most of the field. An exception is the northwest quadrant of the image which has little emission from either molecule. This region is also empty in dust (see Figure NH3 in the Central 10 pc of the Galaxy I: General Morphology and Kinematic Connections Between the CND and GMCs). There is emission from the 50 km s-1 cloud in HCN(1-0) and NH3 although it is concentrated in different places. HCN(1-0) peaks to the north of the NH3 cloud with the strongest emission at the connection between the 50 km s-1 cloud and the northern ridge at , . The most notable difference in this region of the 50 km s-1 cloud is the “hook” of HCN(1-0) emission which extends past the edge of the NH3 emission to , . This location is interior to the edge of Sgr A East in projection and has a velocity of –80 km s-1 in HCN(1-0).
The southern streamer is weak in HCN(1-0). There is almost no HCN(1-0) emission at the peak of the NH3 emission at , . Some HCN(1-0) emission is coincident with SE1 and SE2, but the features are not as connected as in NH3. The southern third of the western streamer is seen in both HCN(1-0) and NH3. This feature is the high velocity (–110 km s-1) “extension” of the southwest lobe of the CND seen by Güsten et al. (1987) and Wright et al. (2001). The northern two-thirds of the streamer may show some faint HCN(1-0) emission, but they do not form a single feature.
The lack of HCN(1-0) emission from the brightest NH3(3,3) features is due in part to self-absorption of HCN(1-0) in the GMCs as well as absorption of HCN(1-0) along the line of sight (Wright et al., 2001). Position-velocity cuts by Wright et al. (2001) along the southern streamer and 50 km s-1 cloud (see Figure 13 in Wright et al. (2001)) show strong self-absorption of HCN(1-0) in these features. Self-absorption of HCN(1-0) could weaken the intensity of the GMCs and result in apparently enhanced emission from the CND, where wide line widths make HCN(1-0) less susceptible to self-absorption. The NH3 is less affected by absorption because the transitions are of higher energies and are more optically thin than the HCN(1-0) lines.
4.2 Comparison to HCN(3-2)
Observations of the higher HCN (3-2) transition by Marshall et al. (1995) show good agreement with NH3(3,3) and support the idea that HCN(1-0) is highly affected by self-absorption and absorption along the line-of-sight. Channel maps by Marshall et al. (1995) of HCN(3-2) emission show strong emission at the location of both the 20 and 50 km s-1 clouds in addition to the CND (see Figure 2, Marshall et al. (1995)). The same figure also shows features to the west of the CND that agree kinematically and spatially with NH3 emission from the western streamer. Emission to the southwest begins at –110 km s-1 and continues to the north where it reaches positive velocities of +50 km s-1. The extension of the 20 km s-1 cloud towards the southwestern lobe of the CND, seen at , in Figure NH3 in the Central 10 pc of the Galaxy I: General Morphology and Kinematic Connections Between the CND and GMCs, is observed at 10 km s-1. Emission from the southern streamer is seen in the 30 km s-1 channel and is just as strong as emission from the CND. The 50 km s-1 and 20 km s-1 GMCs also dominate the channel maps that correspond to their central velocities. The northern ridge is easily observable in HCN(3-2) as the ridge to the north of the CND in the –10 km s-1 channel of Marshall et al. (1995). In conclusion, the NH3(3,3) and HCN(3-2) images agree on every main feature including the southern streamer, northern ridge, and western streamer which are completely absent in the HCN(1-0) image. This indicates that images made with HCN(1-0) must be carefully studied to determine the effects of absorption and excitation.
4.3 NH3 as a Column Density Tracer
The colorscale in Figure NH3 in the Central 10 pc of the Galaxy I: General Morphology and Kinematic Connections Between the CND and GMCs shows a 1.2 mm continuum image taken by Zylka (1998) using the IRAM 30 m telescope. This 1.2 mm image traces thermal dust emission in the region with additional free-free emission in the mini-spiral. Overlaid on the continuum emission is a primary beam corrected NH3 (3,3) velocity integrated map. The primary beam correction was performed by dividing the velocity integrated (3,3) emission by the gain of the interferometer at each point in the map. Only points with a gain 15% are plotted in Figure NH3 in the Central 10 pc of the Galaxy I: General Morphology and Kinematic Connections Between the CND and GMCs. Primary beam correction results in a map with varying noise characteristics across the field. Although the rms noise of this image near the field center is still 0.33 Jy beam-1 km s-1, the noise is scaled up by the reciprocal of the gain and is 2.2 Jy beam-1 km s-1 at the map edge.
There is a striking correspondence between the thermal dust and NH3 (3,3) emission. The southern streamer as well as SE1 and SE2 are clearly visible in both NH3 (3,3) and 1.2 mm dust. The 20 km s-1 GMC is the bright dust feature at , and is well traced by NH3 (3,3) to the edge of the mosaic. The 50 km s-1 cloud can be seen as the bright dust emission to the northeast from , to , . This GMC is also close to the edge of the NH3 image and can be seen as the bright NH3(3,3) feature on the northeastern edge of the mosaic. There is also striking agreement along the “northern ridge.” This feature is clearly present in the dust image from , to , where it intersects the 50 km s-1 cloud. Both tracers show little or no emission in the northwest quadrant of the image. There is also a lack of NH3(3,3) and thermal dust emission in the cavity of Sgr A East covering to and to . The degree of correlation between NH3 and dust emission in the CND is difficult to determine due to the free-free emission that dominates the dust image near Sgr A West.
Comparison of the 1.2 mm dust map to a 350 m map by Dowell et al. (1999) shows that the dust emission is approximately constant over this wavelength range. The similarity of the two maps implies that the 1.2 mm dust traces column density and is not strongly correlated with temperature in the region. The dust image has a beam size of 11′′, and as a single dish map it detects highly extended emission. Considering the lack of zero-spacing information in the NH3 data (shortest baseline 35 m), the agreement between the two maps is compelling, suggesting that NH3 is a relatively unbiased tracer of column density in the Galactic Center region.
A few features seen in the NH3(3,3) image are not observed in the thermal dust image. The “western streamer” is not strongly correlated with the dust, and there is almost no dust emission in the upper two-thirds of this streamer. Line ratios of more than 1 in this region (see Figure NH3 in the Central 10 pc of the Galaxy I: General Morphology and Kinematic Connections Between the CND and GMCs) indicate that the western streamer is heated to K. The narrow stream of gas connecting the northern ridge to the CND is also not strongly correlated with the dust and shows similar hints of high line ratios in Figure NH3 in the Central 10 pc of the Galaxy I: General Morphology and Kinematic Connections Between the CND and GMCs. The heating and absence of dust in these features indicate that they may be located physically closer to Sgr A* or may originate in a different way than the streamers that contain dust.
4.4 Interactions with Sgr A East
The velocity integrated NH3 (3,3) emission is overlaid on 6 cm continuum emission (Yusef-Zadeh & Morris, 1987) in Figure NH3 in the Central 10 pc of the Galaxy I: General Morphology and Kinematic Connections Between the CND and GMCs. The arms of the Sgr A West mini-spiral can be seen in blue in the center of the image. The eastern edge of Sgr A East extends to and the western edge is spatially coincident with the western edge of the CND and mini-spiral. Sgr A East is expanding with an energy more than an order of magnitude greater than a typical supernova remnant (Mezger et al., 1989; Genzel et al., 1990). The NH3 (3,3) emission closely follows the outer edge of Sgr A East. The shell is impacting the 50 km s-1 cloud in the east (Genzel et al., 1990; Ho et al., 1991; Serabyn, Lacy , & Achtermann, 1992; Zylka, 1999) where material forms a “ridge” on the western edge of the cloud. This ridge is seen in NH3(3,3) from , to , . The northern ridge and western streamer also lie along the outside edge of Sgr A East. Therefore, it appears that Sgr A East is expanding into material on all sides of the CND. We observe multiple connections between the CND and the ridges on the outside edge of Sgr A East (see Section 5). These connections are a strong indication that the CND and Sgr A East are in close proximity to each other.
The southern edge of Sgr A East is approximately coincident with the two southern clouds and the southern streamer. Since the “20 km s-1” giant molecular cloud (which appears to be the source of at least the southern streamer (Ho et al., 1991; Coil & Ho, 1999, 2000)) is thought to be located in front of Sgr A East (Coil & Ho, 1999, 2000), Sgr A East may be expanding into the back of these filaments. In addition, there is evidence that a SNR centered at (Coil & Ho, 2000, and references therein) may be impacting Sgr A East along its southeastern edge. This could account for the 1720 MHz OH masers detected by Yusef-Zadeh et al. (1999) on the boundary between this SNR and Sgr A East. The interaction of these two expanding shells could also produce filamentary structures like SE1, SE2, and the southern streamer.
Figure NH3 in the Central 10 pc of the Galaxy I: General Morphology and Kinematic Connections Between the CND and GMCs is also useful for studying the gap in NH3 (3,3) emission in the northern part of the CND at the location of the northern arm of the mini-spiral. As discussed in Section 4.1, this gap is also seen in HCN (1-0) emission. The lack of NH3 (3,3) emission in addition to the lack of HCN(1-0) emission and the observation of 1720 OH masers in this gap supports the idea that the northern arm of the mini-spiral originates outside the CND and is crossing over or through the CND on its way to the Galactic Center (Wright et al., 2001).
5 Connections between the CND and GMCs
Connections between the CND and features at larger distances such as the 20 and 50 km s-1 cloud can provide an explanation for the origin of the clouds that compose the CND. A connection must show more than morphological evidence to be considered a physical gas flow. The presence of a velocity gradient along a streamer indicates that the gas is being gravitationally affected by the central gravitational field. Line ratios can also determine whether gas is heated as it approaches the nucleus, thus providing a way to discriminate against chance projections of clouds along the line-of-sight. Finally, as the gas intersects clouds in the CND, the line widths should broaden. Streamers with these qualities are likely candidates for flows along which gas is transported towards the Galactic Center.
We detect at least three physical connections between the CND and gas at larger distances. These connections originate in the southern streamer, SE1, the northern ridge, and the western streamer and may represent inflow of material towards the nucleus. Figure NH3 in the Central 10 pc of the Galaxy I: General Morphology and Kinematic Connections Between the CND and GMCs shows the position of six position-velocity cuts along features which appear to be connecting the material to the CND overlaid on NH3(3,3) emission. The position velocity diagrams for NH3 (1,1), (2,2) and (3,3) are shown in Figures NH3 in the Central 10 pc of the Galaxy I: General Morphology and Kinematic Connections Between the CND and GMCs, NH3 in the Central 10 pc of the Galaxy I: General Morphology and Kinematic Connections Between the CND and GMCs, and NH3 in the Central 10 pc of the Galaxy I: General Morphology and Kinematic Connections Between the CND and GMCs. In each cut, position “0” corresponds to the labeled end of the cut.
In the velocity integrated images, the brightest emission is at 30-50 km s-1 mainly from the large GMCs. When performing MEM deconvolution, channels with bright emission may have “blooming” where plateaus of low-level flux are added around strong features. Artifacts of blooming were seen in NH3(3,3) position-velocity diagrams as narrow lines centered at km s-1 seen along most of the cut. To test the effects of blooming, we created CLEANed data cubes. The bright emission is identical in both diagrams, but the narrow ridges centered at 45 km s-1 disappear in the CLEANed diagrams. To be conservative, we present the CLEANed diagrams in Figures NH3 in the Central 10 pc of the Galaxy I: General Morphology and Kinematic Connections Between the CND and GMCs, NH3 in the Central 10 pc of the Galaxy I: General Morphology and Kinematic Connections Between the CND and GMCs, and NH3 in the Central 10 pc of the Galaxy I: General Morphology and Kinematic Connections Between the CND and GMCs.
5.1 The Southern Streamer
The southern streamer has previously been observed to connect the 20 km s-1 cloud to the southern lobe of the CND (Coil & Ho, 1999, 2000). Position velocity cut in Figures NH3 in the Central 10 pc of the Galaxy I: General Morphology and Kinematic Connections Between the CND and GMCs, NH3 in the Central 10 pc of the Galaxy I: General Morphology and Kinematic Connections Between the CND and GMCs, and NH3 in the Central 10 pc of the Galaxy I: General Morphology and Kinematic Connections Between the CND and GMCs show emission along the southern streamer. A small velocity gradient from 30 km s-1 at a position of 40′′ to 40 km s-1 at 70′′ can be seen as gas approaches the CND. With higher velocity resolution, Coil & Ho (1999) were able to detect a comparable shift of 10 km s-1 in this region of the southern streamer (see Fig. 8, cut in Coil & Ho (1999)). In addition, the line is seen to broaden dramatically when the gas reaches the CND. At a position of 90-100′′, NH3(3,3) emission is seen over a velocity range of almost 100 km s-1. This broadening is also seen in NH3(2,2) and to a lesser degree in NH3(1,1). The peak of the emission is located at km s-1 while broadening is seen in the lowest contours. The broadening in all three transitions seems to be biased towards lower velocities and ranges from –70 to +50 km s-1 instead of being symmetric on both sides of the line center.
An increase in the NH3(2,2) to (1,1) line ratio as the streamer approaches the CND can be seen in Figure NH3 in the Central 10 pc of the Galaxy I: General Morphology and Kinematic Connections Between the CND and GMCs and indicates that gas is being heated as it approaches the nucleus. This heating could result from shocks as the gas merges with the CND or from high-energy photons escaping from the nuclear region. The NH3(3,3) hyperfine satellite components may be seen bracketing the strong central component. Asymmetric broadening of the main component may explain why the satellite lines do not appear to have equal intensity on both sides of the main component in position-velocity cut .
In Figure NH3 in the Central 10 pc of the Galaxy I: General Morphology and Kinematic Connections Between the CND and GMCs, NH3(3,3) emission at 30 km s-1 and 110′′ to 140′′ appears to come from inside the CND. NH3(3,3) emission at 160′′ is associated with the northwestern side of the CND. In NH3(1,1) and (2,2) emission, however, the southern streamer stops sharply at the CND. This abrupt end is used by Coil & Ho (1999, 2000) as evidence that the southern streamer is interacting with the CND. The small amount NH3(3,3) gas inside the CND is probably hot since there is no emission in NH3(1,1) or (2,2).
5.2 The Northern Ridge
Faint NH3 emission can be seen in Figures NH3 in the Central 10 pc of the Galaxy I: General Morphology and Kinematic Connections Between the CND and GMCs and NH3 in the Central 10 pc of the Galaxy I: General Morphology and Kinematic Connections Between the CND and GMCs connecting the northern ridge to the northeastern lobe of the CND. Position-velocity cut in Figure NH3 in the Central 10 pc of the Galaxy I: General Morphology and Kinematic Connections Between the CND and GMCs shows the kinematic structure of this feature in NH3(3,3). Gas in the northern ridge at a position of 30′′ has a velocity of –10 km s-1 and connects to the CND with a smooth velocity gradient of 0.6 km s-1arcsec-1. This large velocity gradient covers 110′′ (4 pc) and reaches the CND at 60 km s-1. Position velocity cuts in NH3(1,1) and (2,2) show the same kinematic signature for this streamer connecting the northern ridge to the CND. The positive velocity increase as the gas approaches the CND places the northern ridge in front of the northeastern part of the CND. In addition, the low velocity of this streamer ( km s-1) makes it likely to be gravitationally bound by the nucleus. Since the velocity increases as projected distance decreases, we can eliminate a circular orbit for this cloud.
The northern ridge has high NH3(2,2) to (1,1) line ratios and may have been impacted and disrupted by Sgr A East (see section 4.3). Line ratios for most of the northern ridge and connecting stream are . Position-velocity cut can be used to better estimate the line ratios. At position 40′′, the ratio of NH3(2,2) to NH3(1,1) emission is . This ratio increases to where the streamer intersects the CND (position 140′′). Assuming that the streamer is optically thin along its entire length, this increase in NH3(2,2) to (1,1) line ratios corresponds to a temperature increase from K to K.
Although the upper part of the northern ridge is well traced in dust, there is little dust emission along the connection to the CND (see Figure NH3 in the Central 10 pc of the Galaxy I: General Morphology and Kinematic Connections Between the CND and GMCs). The northern ridge appears to have been swept up by the expansion of Sgr A East. Some of the disrupted gas may be falling towards the CND and it is possible that dust in the gas has been destroyed by photons from the nucleus.
5.3 SE1
Although it is faint, SE1 and the CND are connected in all three velocity integrated images. Analysis of the kinematic data shows a strong connection between SE1 and northeastern lobe of the CND. This connection can be easily seen in Figure NH3 in the Central 10 pc of the Galaxy I: General Morphology and Kinematic Connections Between the CND and GMCs. To the south, SE1 has a velocity of 40 km s-1 at 50′′. The velocity increases to the north until it reaches 50 km s-1 at 90′′. A connection to the CND at 50 km s-1 extends from 110′′ to 140′′ where it intersects the CND at the same velocity. SE1 is also connected to the CND by emission at 50 km s-1 in NH3(1,1) and (2,2). The connection is narrow and weaker than emission from either SE1 or the CND. It may be weak due to the intrinsic clumpiness of the clouds, or it also may have been disrupted by an interaction with another cloud.
Kinematic evidence from HCN (1-0) indicates that the northern half of the CND may be on a different orbit than the rest of the ring (Wright et al., 2001). The independence of this feature from the rest of the CND would also account for the different inclination angles observed for the two halves of the CND. Given the strong connection between the CND and SE1, it appears that some of the gas in the northern lobe originated in SE1 and is not part of a coherent rotating ring.
5.4 The Western Streamer
Position velocity cut in Figure NH3 in the Central 10 pc of the Galaxy I: General Morphology and Kinematic Connections Between the CND and GMCs shows a striking velocity gradient of 1 km s-1arcsec-1 along the entire 150′′ (6pc) length of the western streamer. The southern end of the streamer at 60′′ has a velocity of –70 km s-1 while the northern end has high velocity emission at +90 km s-1 at 220′′. The same velocity gradient is observed in NH3(1,1) and (2,2) in position-velocity diagrams NH3 in the Central 10 pc of the Galaxy I: General Morphology and Kinematic Connections Between the CND and GMCs and NH3 in the Central 10 pc of the Galaxy I: General Morphology and Kinematic Connections Between the CND and GMCs. The large velocity gradient along the length of the cloud could be due to intrinsic rotation or the cloud could be orbiting the nucleus. If we assume a circular orbit for the western streamer at a distance of 2′ (4.6 pc) the observed velocity gradient is consistent with a keplerian orbit around a central mass of 107 M⊙ (including Sgr A* and the stellar population, see Haller et al. (1996)) inclined by to the line of sight. Additionally, the impact of Sgr A East could enhance the gradient along this streamer.
The western streamer is not seen in 1.2 mm dust emission (see Figure NH3 in the Central 10 pc of the Galaxy I: General Morphology and Kinematic Connections Between the CND and GMCs). The dust may have been destroyed by photons from the nucleus or by interactions with Sgr A East. As seen in Figure NH3 in the Central 10 pc of the Galaxy I: General Morphology and Kinematic Connections Between the CND and GMCs, the curve of the western streamer follows the edge of Sgr A East. It is possible that this gas originated closer to the nucleus and was pushed outward. In this scenario, any dust that was in the gas was removed when it was close to the nucleus.
Three narrow filaments appear to connect the western streamer to the CND in the velocity integrated maps. The southern-most projected connection, at , , is visible in position-velocity cut at 20′′ with a velocity of 0 km s-1. This cloud is the same extension of the 20 km s-1 cloud towards the southwestern lobe of the CND that was seen by Coil & Ho (1999, 2000) in NH3(1,1) and (2,2). Kinematically, it is associated with the 20 km s-1 cloud and not the western streamer. Although the extension is spatially connected to the CND in NH3(3,3), HCN(1-0) and dust emission (see Figures NH3 in the Central 10 pc of the Galaxy I: General Morphology and Kinematic Connections Between the CND and GMCs and NH3 in the Central 10 pc of the Galaxy I: General Morphology and Kinematic Connections Between the CND and GMCs), there is no kinematic evidence for a physical connection between the 20 km s-1 cloud and this south-western part of the CND which has typical velocities of –110 km s-1. The use of CLEANed data for the position-velocity diagrams makes it difficult to see faint, extended connections between features. It is possible that features which show morphological connections but no obvious kinematic associations with the CND are connected to the CND by faint and extended gas.
The second possible connection between the western streamer and the southwest lobe of the CND is at , . In position velocity cut NH3 in the Central 10 pc of the Galaxy I: General Morphology and Kinematic Connections Between the CND and GMCs the bright clump at 20′′, centered at -20 km s-1, is the western streamer. Emission from the CND is is seen from 80′′ to 180′′. In the western-most part of the CND, there is bright emission at the same velocity as the western streamer (80′′), but any connection is tenuous. The line widths are extremely high in this region (FWHM up to 50 km s-1) indicating turbulence. NH3(1,1) and (2,2) show the same kinematics.
In NH3(3,3), the southwestern lobe of the CND at 80-100′′ shows two bright clumps centered at km s-1 and km s-1. In NH3(1,1) there is prominent emission at km s-1 at 110′′ which is either part of the “negative velocity lobe” of the CND observed in HCN(1-0) or high velocity gas at the nucleus. The features at –10 and +80 km s-1 are more prominent in NH3 and do not fit a rotation pattern. In particular, the feature at –10 km s-1 has a high line width which extends over 60 km s-1, especially in NH3(2,2).
Position-velocity cut follows northern-most possible connection to the CND at , . The western streamer is at a velocity of 30 km s-1 at position of 40′′. There is no obvious connection to the CND which is at 70 km s-1 and has a velocity gradient going to 30 km s-1 towards the east.
The two northern projected connections between the CND and the western streamer are seen as filaments in 6 cm continuum emission. The filamentary structures in the continuum emission are intriguing and may be the result of supernova remnants or expansion of Sgr A East through the CND.
Overall, we detect three physical connections to the CND. We confirm the presence of the southern streamer which connects the 20 km s-1 cloud to the CND. The northern ridge is also connected to the CND with a velocity gradient of 0.6 km s-1 arcsec-1 spanning 110′′ (4 pc). SE1 extends northwards and kinematically connects to the eastern lobe of the CND. The western streamer shows a velocity gradient of 1 km s-1 arcsec-1 along a length of 150′′ (6pc), but we do not see any definite physical connections to the CND.
6 A High Velocity Cloud Near the Nucleus
There is significant absorption in NH3(1,1) and (2,2) where cut passes close to Sgr A* at 120′′. The NH3(3,3) diagram, however, has little absorption and instead shows emission with a coherent velocity gradient from +80 km s-1 at 95′′ to 0 km s-1 at 145′′. This feature is within 2 pc in projected distance from Sgr A*. The positive velocity lobe of the CND is seen at 170′′ and is not a continuation of the gradient. A similar gradient is seen as cut passes through the interior of the CND (70-130′′). Unlike cut , the velocity gradient of gas near Sgr A* in cut is not constant. The velocity decreases from 75 km s-1 at 75′′ to 50 km s-1 at 90′′ and then is approximately constant at 35 km s-1 from 100-115′′. At 125′′, there is emission from –50 km s-1 to +40 km s-1. Although not shown in this paper, the same feature is seen over a range of position angles from 60-100∘. The feature must contribute to NH3(3,3) emission seen close to Sgr A* in the velocity integrated image (see Figure NH3 in the Central 10 pc of the Galaxy I: General Morphology and Kinematic Connections Between the CND and GMCs), but the resolution of the image is too coarse to outline its morphology. The observed velocity gradient may be the result of a cloud being tidally stripped by the central gravitational potential or may be a feature orbiting the black hole in the opposite sense as the CND. At the position of Sgr A* (125′′ in and 110′′ in ), the velocity is centered at 30 km s-1 making it unlikely that this feature is a counter-rotating inner disk around Sgr A*. If we assume this feature is within 2 pc of the Galactic Center, then its maximum velocity (100 km s-1) is well below the escape velocity for a gravitational potential of M⊙ and the cloud is likely to be gravitationally bound to the nucleus. However, considering projection effects and without the spatial morphology of this cloud, it is not possible to uniquely determine an orbit for this feature.
7 Conclusion
VLA mosaics of the central 10 pc of the Galaxy in NH3(1,1), (2,2), and (3,3) allow a detailed study of gas on all sides of the CND. The velocity integrated images show many filamentary features including the southern streamer, northern ridge, and western streamer as well as a high velocity cloud within 2 pc of the Galactic Center. There is a high correlation between NH3(3,3) emission and emission from dust and HCN(3-2), suggesting that NH3(3,3) traces column density. Line ratios of NH3(2,2) to (1,1) emission indicate that the CND and western streamer are hotter than GMCs which lie at a projected distance of pc. The CND is well-traced in NH3(3,3) although the relative intensity of features differs from HCN(1-0). Outside the CND, the 50 km s-1 cloud, northern ridge and western streamer are located around the edge of Sgr A East and appear to have been swept up by the expanding shell. Many of the filamentary features including the northern ridge, southern streamer and SE1 are kinematically connected to the CND indicating that GMCs are feeding the nucleus along many paths.
References
- Coil & Ho (1999) Coil, A.L. & Ho, P.T.P. 1999, ApJ, 513, 752
- Coil & Ho (2000) Coil, A.L. & Ho, P.T.P. 2000, ApJ, 533, 245
- Danby et al. (1988) Danby, G., Flower, D.R., Valiron, P., Schilke, P. , & Walmsley, C.M. 1988, MNRAS, 235, 229
- Dent et al. (1993) Dent, W.R.F, Matthews, H.E., Wade, R. , & Duncan, W.D. 1993, ApJ, 410, 650
- Dowell et al. (1999) Dowell, C.D., Lis, D.C., Serabyn, S., Gardner, M., Kovacs, A. , & Yamashita, S. 1999, in ASP Conf. Ser. 186, The Central Parsecs of the Galaxy, ed. H. Falke et al. (San Francisco: ASP), 453
- Eckart & Genzel (1997) Eckart, A. & Genzel, R. 1997, MNRAS, 284, 576
- Haller et al. (1996) Haller, J.W., Rieke, M.J., Reike, G.H., Close, P.T.L, & Melia, F. 1996, ApJ, 456, 194
- Gatley et al. (1986) Gatley, I., Jones, T.J., Hyland, A.R., Wade, R., Geballe, T.R. & Krisciunas, K. 1986, MNRAS, 222, 299
- Genzel et al. (1997) Genzel, R., Eckart, A., Ott, T. , & Eisenhauer, F. 1997, MNRAS, 291, 219
- Genzel et al. (1990) Genzel, R., Stacey, G.J., Harris, A.I., Geis, N., Graf, U.U., Poglitsch, A. , & Sutzki, J. 1990, ApJ, 356, 160
- Genzel et al. (1985) Genzel, R., Watson, D.M., Crawford, M.K. & Townes, C.H. 1985, ApJ, 297, 766
- Ghez et al. (1998) Ghez, A.M., Klein, B.L., Morris, M. , & Becklin, E.E. 1998, ApJ, 509, 678
- Güsten et al. (1987) Güsten, R., Genzel, R., Wright, M.C.H., Jaffe, D.T., Stutzki, J. , & Harris, A.I. 1987, ApJ, 318, 124
- Güsten, Walmsley , & Pauls (1981) Güsten, R., Walmsley, C.M. , & Pauls, T. 1981, A&A, 103, 197
- Harris et al. (1985) Harris, A.I., Jaffe, D.T., Silber, M. & Genzel, R. 1985, ApJ, 294, 93
- Ho (1993) Ho, P.T.P. 1993, in Proc. of the 2nd Cologne-Zermatt Symposium, The Physics and Chemistry of Interstellar Molecular Clouds, ed. G. Winnewisser & G. Pelz (New York: Springer), 33
- Ho et al. (1991) Ho, P.T.P., Ho, L.C., Szczepanski, J.C., Jackson, J.M., Armstrong, J.T. , & Barrett, A.H. 1991, Nature, 350, 309
- Ho & Townes (1983) Ho, P.T.P. & Townes, C.H. 1983, ARA&A, 21, 239
- Jackson et al. (1993) Jackson, J.M., Geis, N., Genzel, R., Harris, A.I., Madden, S., Poglitsch, A., Stacey, G.J. , & Townes, C.H. 1993, ApJ, 402, 173
- Lo & Claussen (1983) Lo, K.Y. & Claussen, M.J. 1983, Nature, 306, 647
- Marr, Wright , & Backer (1993) Marr, J.M., Wright, M.C.H. , & Backer, D.C. 1993, ApJ, 411, 667
- Marshall et al. (1995) Marshall, J., Lasenby, A.N. , & Harris, A.I. 1995, MNRAS, 277, 594
- Mezger et al. (1989) Mezger, P.G., Zylka, R. Salter, C.J., Wink, J.E., Chini, R. Kreysa, E. , & Tuffs, R. 1989, A&A, 209, 337
- Morris & Serabyn (1996) Morris, M. & Serabyn, E. 1996, ARA&A, 34, 645
- Okumura et al. (1989) Okumura, S.K., et al. 1989, ApJ, 347, 240
- Reid (1993) Reid, M.J. 1993, ARA&A, 31, 345
- Reid et al. (1999) Reid, M.J., Readhead, A.C.S., Vermeulen, R.C. , & Treuhaft, R.N. 1999, ApJ, 524, 816
- Roberts & Goss (1993) Roberts, D.A. & Goss, W.M. 1993, ApJS, 86, 133
- Sault, Teuben , & Wright (1995) Sault, R.J., Teuben, P.J. , & Wright, M.C.H. 1995, in ASP Conf. Ser. 77, Astronomical Data Analysis Software and Systems IV, ed. R.A. Shaw, H.E. Payne , & J.J.E. Hayes (San Francisco: ASP), 433
- Serabyn et al. (1986) Serabyn, E. Güsten, R. Walmsley, C.M., Wink, J.E. & Zylka, R. 1986, A&A, 169, 85
- Serabyn & Lacy (1985) Serabyn, E. & Lacy, J.H. 1985, ApJ, 293, 445
- Serabyn, Lacy , & Achtermann (1992) Serabyn, E., Lacy, J.H. , & Achermann, J.M. 1992, ApJ, 395, 166
- Sutton et al. (1990) Sutton, E.C., Danchi, W.C., Jamines, P.A. & Masson, C.R. 1990, ApJ, 348, 503
- Walmsley & Ungerechts (1983) Walmsley, C.M. & Ungerechts, H. 1983, A&A, 122, 164
- Wright et al. (2001) Wright, M.C.H.W., Coil, A.L., McGary, R.S., Ho, P.T.P. , & Harris, A.I. 2001, ApJ, in press
- Yusef-Zadeh & Morris (1987) Yusef-Zadeh, F. & Morris, M. 1987, ApJ, 320, 545
- Yusef-Zadeh et al. (1999) Yusef-Zadeh, F., Roberts, D.A., Goss, W.M., Frail, D.A. , & Green, A.J. 1999, ApJ, 512, 230
- Zylka (1998) Zylka, R. 1998, in IAU Symp. 184, The Central Regions of the Galaxy and Galaxies, ed. Y. Sofue (Dordrecht: Kluwer), 156
- Zylka (1999) Zylka, R., Güsten, R., Philipp, S., Ungerechts, H., Mezger, P.G. , & Duschl, W.J. 1999, in ASP Conf. Ser, 186, The Central Parsecs of the Galaxy, ed. H. Falcke et al. (San Francisco: ASP), 415
- Zylka, Mezger , & Wink (1990) Zylka, R. Mezger, P.G. , & Wink, P.E. 1990, A&A, 234, 133
For full resolution figures, see http://cfa-www.harvard.edu/$∼$rmcgary/SGRA/nh3_figures.html
Velocity integrated NH3 (1,1) emission. The rms noise of the map is Jy beam-1 km s-1 and the contour levels are in intervals of . In all three velocity integrated maps a primary beam response of 10, 30 and 50% is shown in dashed contours.
Velocity integrated NH3 (2,2) emission. The rms noise of the map is Jy beam-1 km s-1 and the contour levels are in intervals of .
Velocity integrated NH3 (3,3) emission with main features outside the CND labeled. The rms noise of the map is Jy beam-1 km s-1 and the contour levels are in intervals of .
Channel maps of NH3 (3,3) emission with the mean velocity labeled in each map. Contour levels are 3,6,10,15,23,30,40,55,70 and 90 where Jy beam-1. No clipping was performed on these maps and the noise should be equal across the map.
Ratio of NH3 (2,2) to (1,1) emission at all points where the (2,2) emission is and (1,1) emission is . The 3 contour of (2,2) emission is also plotted. A ratio of 0.5 corresponds to K while a ratio greater than 1.5 implies K (for , Ho & Townes (1983)).
Comparison of NH3(3,3) emission (in contours) and HCN(1-0) emission from Wright et al. (2001) (in color). The color scale ranges from .05 to 0.5 Jy beam-1 km s-1.
Positions of spectra near the CND. Spectra A-J are in the same positions as in Wright et al. (2001).
Spectra from Figure NH3 in the Central 10 pc of the Galaxy I: General Morphology and Kinematic Connections Between the CND and GMCs. The NH3(3,3) spectra are shown in solid lines. For spectra A-J, the HCN(1-0) spectra from Wright et al. (2001) are shown as dashed lines. The vertical scale is in Jy beam-1 for the NH3(3,3) spectra while the HCN(1-0) spectra have been scaled down by a factor of 8 to fit on the plot.
Primary beam corrected NH3(3,3) image overlaid on 1.2 mm emission (Zylka, 1998) Contour levels are 3,6,10,15,23,30,40,55,70,90, and 110 and the color scale runs from .3 to 1 Jy beam-1.
Velocity integrated NH3 (3,3) emission in yellow contours overlaid on 6 cm continuum emission showing Sgr A East (Yusef-Zadeh & Morris, 1987). Contour levels are in intervals of and the color scale ranges from 0 to 0.7 Jy beam-1. The positions of the 1720 MHz OH masers from Yusef-Zadeh et al. (1999) are labeled with green error ellipses scaled up by a factor of 15.
Positions of position-velocity cuts on NH3(3,3) emission.
Position-velocity diagrams for NH3(1,1) emission. Position 0 corresponds to the letter label in Figure NH3 in the Central 10 pc of the Galaxy I: General Morphology and Kinematic Connections Between the CND and GMCs. The contour levels are 0.01, 0.02, 0.03, 0.04, 0.05, 0.06, 0.07, 0.08, 0.1, 0.125, 0.15, 0.2, 0.25, 0.3, 0.35, 0.4, 0.45, 0.5, 0.55, and 0.6 Jy beam-1.
Position-velocity diagrams for NH3(2,2) emission. Position 0 corresponds to the letter label in Figure NH3 in the Central 10 pc of the Galaxy I: General Morphology and Kinematic Connections Between the CND and GMCs. The contour levels are 0.01, 0.02, 0.03, 0.04, 0.05, 0.06, 0.07, 0.08, 0.1, 0.125, 0.15, 0.2, 0.25, 0.3, 0.35, 0.4, 0.45, 0.5, 0.55, and 0.6 Jy beam-1.
Position-velocity diagrams for NH3(3,3) emission. Position 0 corresponds to the letter label in Figure NH3 in the Central 10 pc of the Galaxy I: General Morphology and Kinematic Connections Between the CND and GMCs. The contour levels are 0.01, 0.025, 0.04, 0.055, 0.075, 0.1, 0.125, 0.15, 0.2, 0.25, 0.3, 0.35, 0.4, 0.45, 0.5, 0.55, and 0.6 Jy beam-1.