Chandra Observations of Diffuse X-Rays from the Sagittarius B2 Cloud
Abstract
We present the first Chandra results of the giant molecular cloud Sagittarius B2 (Sgr B2), located about 100 pc away from the Galactic center. Diffuse X-rays are clearly separated from one-and-a-half dozen resolved point sources. The X-ray spectrum exhibits pronounced iron K-shell transition lines at 6.40 keV (K) and 7.06 keV (K), deep iron K-edge at 7.11 keV and large photo-electric absorption at low energy. The absorption-corrected X-ray luminosity is erg s-1, two orders of magnitude larger than the integrated luminosity of all the resolved point sources. The diffuse X-rays come mainly from the south-west half of the cloud with a concave-shape pointing to the Galactic center direction. These results strongly support the ASCA model that Sgr B2 is irradiated by an X-ray source at the Galactic center side.
1 Introduction
The central region of our Galaxy (here, GC) is behind the large extinction in the optical band, but visible with the radio and infrared bands. The GC has been revealed to exhibit highly complex features, which are possibly attributable to either a putative massive black hole (MBH) of M⊙ at the position of the radio non-thermal source Sgr A∗ (Ghez et al., 2000) or star burst activity in the GC.
The interstellar gas to the GC also becomes transparent at higher energy X-rays. Diffuse X-ray emission in the GC was discovered with the Einstein Observatory (Watson et al., 1981). The Ginga satellite then found K lines of highly ionized irons associated with a high temperature plasma in the central 100 pc region, the explosion energy of which is as large as ergs (Koyama et al., 1989; Yamauchi et al., 1990). The ASCA satellite, with the imaging capability in the wide energy X-ray band (0.5–10 keV) coupled to the reasonable energy resolution, has further found a hot plasma inside the Sgr A radio shell with an oval-shape of across (Koyama et al., 1996). Early results with the Chandra X-ray Observatory resolved out numerous X-ray structures from the central 20 pc () region of the GC, and found a weak point source of ergs s-1 at the position of Sgr A∗ (Baganoff et al., 2001). This is nearly one billion times lower than the Eddington luminosity for a MBH of M⊙.
This ”X-ray quiet” Sgr A∗ is in a sharp contrast to the high X-ray activity of the surrounding diffuse hot plasmas. A hint to connect these X-ray phenomena, the quiet Sgr A∗ and active environment, was obtained with the ASCA observations on Sgr B2, a giant molecular cloud located 100 pc away from Sgr A∗. Koyama et al. (1996) discovered diffuse emission of a K 6.4 keV line of neutral or low ionized irons from Sgr B2. The X-ray spectrum and morphology of Sgr B2 are well explained by an ”X-ray Reflection Nebula (XRN)” model; the X-rays are due to reflection, photo-electric absorption and fluorescence from iron atoms (Murakami et al., 2000). However, no adequately bright X-ray source was found in the vicinity of Sgr B2 to fully account for the diffuse X-ray flux. One likely scenario, despite its considerable distance from Sgr B2, is a past activity of Sgr A∗; an X-ray outburst of ergs s-1 possibly caused by a surge of accretion onto the MBH in the near past, and is currently in a quiescent accretion (Koyama et al., 1996; Murakami et al., 2000).
The limited spatial resolution of ASCA, however, could not exclude possible contamination of many point sources such as young stellar objects in Sgr B2, which might deform the spectrum and morphology of the diffuse emission. We hence performed a high resolution imaging spectroscopy on the Sgr B2 region with Chandra. We successfully detected diffuse X-rays, resolving many point sources in Sgr B2. In this paper, we focus on the diffuse X-rays, while the results of the point sources will be given in a separate paper. Throughout this paper, the distance to Sgr B2 is assumed to be 8.5 kpc, the same to Sgr A∗, and is within the error of estimated distance of 7.1 1.5 kpc (Reid et al., 1988).
2 Observation and Data Reduction
The Chandra deep exposure observation on Sgr B2 was carried out on 29–30 March 2000. The satellite and instrument are described by Weisskopf et al. (1996) and Garmire et al. (2001) respectively. Sgr B2 lies near the center of the ACIS imaging array (ACIS-I) of four front-side illuminated CCDs, each with array of pixels covering field of view. Data acquisition from ACIS was made in Timed-Exposure Faint mode with chip readouts of every 3.24 s.
The ACIS front-side illuminated CCDs have suffered from an increase of the parallel Charge Transfer Inefficiency (CTI), which decreases the detection efficiency, energy gain and resolution. Sgr B2 is located at the top of amplifier 2–3 on chip I0, a location to be heavily affected by the CTI. We therefore correct these effects using the software described by Townsley et al. (2000), then no significant variation is found in the energy of the instrumental Ni-K (7.5 keV) and Au-L (9.7 keV) lines (fluorescence due to particle bombardment on the satellite metals) at the chip location of Sgr B2 within % (90% confidence). The energy resolution, however still varies from row to row: 160 and 250 eV (FWHM) at the bottom and top of the chip I0, respectively. In the spectral analysis, we use a response matrix based on a nearly contemporaneous observation of reference lines from an on-board calibration source (OBSID62097), which are analyzed with the same CTI corrector. The effective area of the telescope mirrors and the detection efficiency of ACIS are calculated with the mkarf program in the Chandra Interactive Analysis of Observations Software (CIAO, Version 1.0). To remove background events, we selected the ASCA grades 0, 2, 3, 4, & 6. We also removed events from flaring pixels and artificial stripes caused probably by hot pixels in the frame-store region and by particles which hit on the CCD node boundaries.
The total count rate over the chip is increased by 30% in the middle of the observation due to a high background rate caused by the impact of solar energetic particles on the CCD chips. However, we do not exclude the data during the high background rate because it does not damage our imaging and spectroscopic studies. The effective exposure time is 100 ks.
3 Results and Analysis
3.1 Point Sources
We first search foreground X-ray sources using the soft (0.5-1.5 keV) band image. In the ACIS-I field of , we find four bright X-ray sources, which have Tycho-2 counterparts. The positions of the Tycho-2 sources have accuracy of 60 mas (Høg et al., 2000), hence the Chandra frame is fine-tuned using these four sources within an absolute error of 0.25 arcsec (1 sigma dispersion).
To highlight X-ray sources near or beyond the Sgr B2 distance, we use the 3.0–8.0 keV band image. The X-ray image near at Sgr B2 is complicated with diffuse emission and many faint point sources. For the point-source search, we execute the CIAO ‘wavdetect’ software of a wavelet method (Freeman et al., 2000). The threshold significances of the wavdetect are set at and 0.001 for the source list and the background estimation, respectively. The wavelet scales used are 1, , 2, , 4, , 8, , and 16 pixels. We then resolve about one-and-a-half dozen point sources in the 3.0–8.0 keV band from the central region of the Sgr B2 cloud. Neither radio nor infrared counterpart is found from these sources, except possible association of the two brightest sources to a compact HII complex near the center of the cloud, Sgr B2 Main (de Vicente et al., 2000).
X-ray photons are extracted from a circle of a radius of six times of the half power diameter (HPD) of point spread function (PSF) for each source. Since the photon numbers of individual sources are limited, we collect all the events from the point sources and make the combined point-source spectrum, where the background spectrum is taken from the point-source-free region in the Sgr B2 cloud shown in Figure 1. The background-subtracted combined spectrum is well fitted with an optically thin thermal plasma model with the best-fit parameters shown in Table 1. The integrated flux of all the point sources is 1.5 ph s-1 cm-2 in the 2–10 keV band, which is about 8% of the total diffuse flux (see §3.2). The mean value is estimated to be 1.9 H cm-2, larger than that of the Galactic absorption to Sgr B2 of H cm-2 (Sakano et al. 2000), but smaller than that through the Sgr B2 cloud of 8 H cm-2 in the central 2′ radius region (Lis & Goldsmith 1989, see also section 3.2). Therefore, we assume that most of the point sources are located near or in the cloud (distance is 8.5 kpc) and estimate the integrated luminosity (absorption corrected) in the 2–10 keV band to be 3 erg s-1. Further details of individual point sources will be given in a separate paper.
3.2 Diffuse X-rays
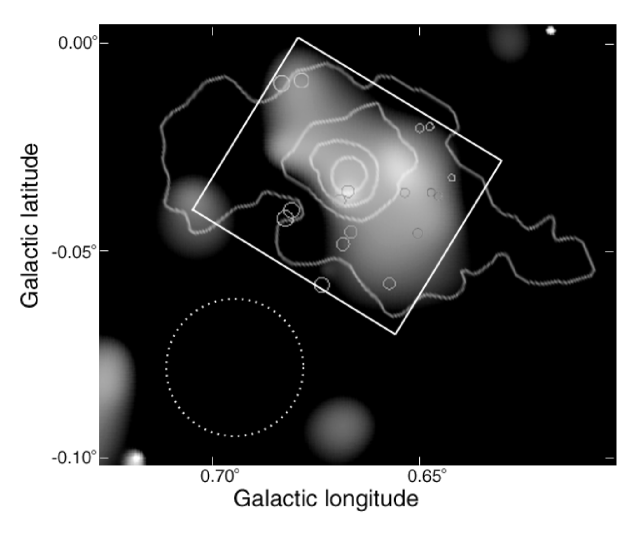
Since ASCA already found the strong 6.4 keV line from Sgr B2, we make the 6.4 keV-line (6.15-6.55 keV) image to highlight the most detailed structure. Using the procedure given in Baganoff et al. (2001) and the algorithm of Ebeling, White & Rangarajan (2000), the image is flat-fielded, and is smoothed adaptively with circular Gaussian kernels. Figure 1 is the 6.4 keV line image overlaid on the radio intensity contours of the molecule 13CO (Sato et al., 2000). The global morphology of the 6.4-keV emission is a concave-shape located at the south-west side (right hand side) of the molecular cloud pointing to the Galactic center direction (right hand side). The positions of the resolved point sources mentioned in the previous section are indicated by solid circles with radii of six times of the HPD of PSF. No significant excess of the point sources is found in this narrow band (6.15-6.55 keV) image, which indicates that the 6.4 keV line of normal point sources, unlike the diffuse emission, is not prominent. The local excess near the center and upper-left of the molecular cloud are possibly due to HII complexes, Sgr B2 Main at and North at . These two local excess occupy only 5 % flux in the total diffuse flux.
The X-ray spectrum of the diffuse emission is made using the data from the solid square and subtracting background taken from the dotted circle in Figure 1. We then fit the spectrum with a phenomenological model, a power-low function of photon index 2.0, adding K and K lines of neutral iron and absorption with the Bałucińska-Church & McCammon (1992) cross-sections for the solar abundances (Feldman, 1992). Iron abundance, which is sensitive to the edge depth, is treated separately as a free parameter. The center energy and flux of iron K line are free parameters, but those of K are linked to the K parameters by fixing the ratio to the laboratory values. Point source contamination is taken into account by adding the best-fit model of the combined point-source spectrum (see §3.1). The best-fit parameters are given in Table 2. We find that the iron K line energy is keV (errors adopted here and after are 90% confidence level unless otherwise noted), consistent with neutral irons of 6.40 keV. In order to examine whether highly ionized irons are present or not, we add 6.70 keV line, K of He-like iron, and constrain that the equivalent width is less than 0.07 keV, or at most 3 % of that of neutral irons. Column density of neutral iron () determined from the K-edge structure is cm-2, while determined from the low energy cutoff is cm-2. Both are nearly ten times larger than those of the Galactic interstellar absorption, hence are attributable to the gas in Sgr B2. The ASCA results, in spite of its poor spatial resolution, are roughly consistent with the Chandra best-fit parameters, supporting that the contribution of the point sources is almost negligible (Murakami et al. 2000).
4 Origin of the Diffuse X-rays
Koyama et al. (1996) and Murakami et al. (2000) have argued that the diffuse X-rays of Sgr B2 can be explained by an XRN model; the Sgr B2 cloud is irradiated by strong X-rays from an external source, absorbs the X-rays, then reflects (Thomson scattering) and/or re-emits fluorescent Fe lines. The discovery of diffuse 6.4 keV line from other giant molecular clouds near the Radio Arc (Koyama et al. 1996) and at Sgr C (Murakami et al. 2001) may indicate that the presence of XRNs at GC is common feature.
The present Chandra observation clearly detect diffuse X-rays from Sgr B2 by resolving underlying point sources. The diffuse X-rays are emitting from the south-west half (right side in Figure 1) of the cloud with a concave-shape morphology pointing to the Galactic center direction. The spectrum is characterized with the pronounced iron K line at keV, heavy absorption at iron K-edge and at low energy, which confirm the ASCA results (Koyama et al., 1996; Murakami et al., 2000). Furthermore, K line at keV is also discovered for the first time. These results give further confirmation of the XRN concept of Sgr B2. We, however, examine more critically for the origin of the diffuse X-rays based on the new observational facts.
4.1 Young Stellar Objects
The giant molecular cloud Sgr B2 is known to be one of the richest regions of ongoing star formation in the Galaxy (e.g., de Vicente et al. 2000). In fact, many compact HII regions as well as maser sources have been found from the cloud. These sources trace the star forming site in the cloud, and are found from the ridge running north to south. Since young stellar objects (YSO), regardless low mass or high mass stars, are rather strong X-ray sources with luminosity ranging from 1032-33 (massive YSO) to 1028-29 erg s-1 (low mass YSO) (e.g., Feigelson & Montmerle 1999), numerous unresolved YSOs in Sgr B2, if any, may mimic the diffuse X-rays. The spatial distribution of the diffuse X-rays, a concave-shape, however is largely different from that of the north-south ridge of star formation. The X-ray spectra of YSOs are generally consistent with optically thin thermal plasma of temperature ranging from 1 keV to a few keV, with the 6.7 keV line of He-like irons present in some cases. The spectrum of the Sgr B2 diffuse is completely different from that of typical YSOs, hence a YSO origin is ruled out for the bulk of the diffuse X-rays. Partial contribution of YSOs may still be conceivable in the two local enhancement at the cloud center and north, Sgr B2 Main and North (see Figure 1). We hence examine the X-ray spectrum from these two regions and find no essential difference from the total diffuse spectrum. We only see a hint of a weak 6.7 keV line with the equivalent width of 0.100.07 keV. Consequently, we can safely conclude that no significant contribution of YSOs is found in the spectrum and morphology of the diffuse X-rays of Sgr B2.
4.2 XRN Due to Internal Point Sources
It may be conceivable that the resolved point sources in Sgr B2 irradiate the surrounding gas and produce the XRN-like X-rays. These point sources, however, are uniformly distributed in the cloud (see Figure 1), which disagrees with the concave-shape of the diffuse X-rays. The integrated luminosity of all the resolved point sources is 3 1033 erg s-1, which is only 3% of the X-ray luminosity of the XRN. Therefore internal point sources can be ignored in the XRN scenario.
4.3 XRN Simulation by an External X-ray Source
The diffuse X-rays are located on the south-west half of Sgr B2, the Galactic center side with the concave-shape pointing to the Galactic center. These naturally lead us to suspect that an irradiating source should be located in the Galactic center direction. More quantitatively, we numerically simulate the XRN model with the assumption that the gas distribution of Sgr B2 is an elliptical cylinder-shape with the same radial dependence given in the model by Murakami et al. (2000) and is irradiated by an external source at the Galactic center direction.
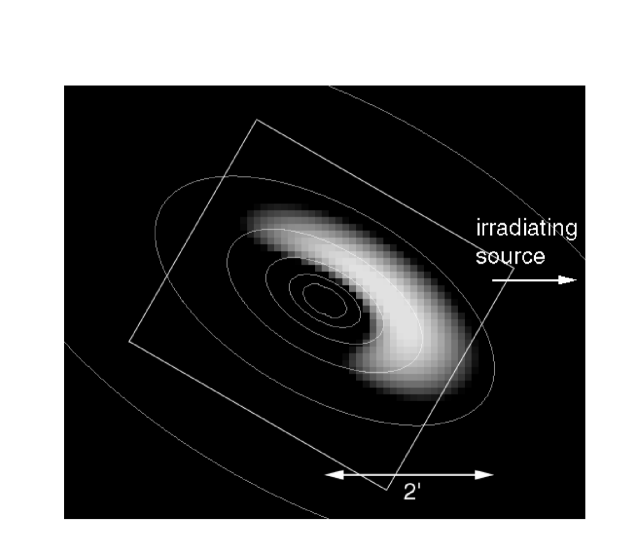
In the XRN scenario, X-rays above the 7.11 keV energy are absorbed mainly by iron atoms, while the lower energy X-rays are absorbed mainly by lighter elements such as carbon, nitrogen and oxygen. Continuum X-ray flux by the Thomson scattering is proportional to the number of electrons (hydrogen atoms). Accordingly, the ratio of absorption depth at 7.11 keV and low energy band is proportional to the abundance ratio of iron and the other elements. The equivalent width of the 6.40 keV line constrains the iron abundance. We thus simulate the spectrum with various abundance sets of iron and the lighter elements and compare with the observed spectrum. The best-fit spectrum is obtained with the reduced of 1.14 with 21 degrees of freedom (d.o.f.). The result is given in Figure 2 by solid histogram together with the data (crosses), where the dashed line is contribution of background point sources. The abundances of iron and lighter elements are 2.1 and 3.5 solar, respectively, consistent with, but more accurate than the ASCA results (Murakami et al. 2000).
Figure 3 is a simulated XRN image of the 6.4 keV line with the best-fit abundances. We see a clear concave-shape emission, similar to the observed result. For quantitative comparison, we clearly need more complicated assumption of gas distribution, which is beyond the scope of this paper.
Using the simulation, we estimate the luminosity of an irradiating source should be (/100pc)2 erg s-1, in order to fully account for the flux of the diffuse X-rays, where is a distance from the cloud center to the irradiating source. No adequately bright X-ray source, however has been found near the Sgr B2 cloud (this work) nor at the central 20 pc region from Sgr A∗ (e.g., Baganoff et al. 2001). This strengthens the idea proposed by Koyama et al. (1996) and Murakami et al. (2000) that a past activity of the Galactic center is responsible for the presence of reflected X-rays and absence of an irradiating source. The past activity of Sgr A∗ would be generated by an accretion surge on the MBH due, for example, to the passage of dense shell of a young supernova remnant Sgr A East as is discussed by Maeda et al. (2001) based on the new Chandra results of the GC.
5 Summary
1. Diffuse X-rays are clearly detected from the giant molecular cloud Sgr B2, by resolving one and half dozens of point sources.
2. The morphology of the diffuse X-rays is concave-shape at the Galactic center side and pointing to this direction.
3. The spectrum exhibits strong emission lines at 6.40 and 7.06 keV, a large absorption at low energies below 4 keV, equivalent to H cm-2 (with the solar abundances) and a pronounced edge-structure at 7.11 keV with equivalent of 3 cm-2.
4. The resolved point sources are likely located near or in the cloud. The integrated luminosity of all the point sources is 3 1033 erg s-1, which is only 3 % of the diffuse X-rays.
5. The spectrum and morphology of the diffuse X-rays can not be attributable to young stellar objects in the cloud, nor the fluorescent by the resolved point sources.
6. The Chandra results strengthen the X-ray Reflection Nebula (XRN) model, in which a strong X-ray source at the Galactic center side irradiates the Sgr B2 cloud.
7. No luminous X-ray source to produce the XRN is found near the Sgr B2 cloud. Possible idea, as already proposed by Koyama et al. (1996) and Murakami et al. (2000), is that the Galactic center Sgr A∗ was active in the recent past but is quiescent at present.
References
- Baganoff et al. (2001) Baganoff, F., et al. 2001, ApJ, submitted, see also astro-ph 0102151
- Bałucińska-Church & McCammon (1992) Bałucińska-Church, M., & McCammon, D. 1992, ApJ, 400, 699
- de Vicente et al. (2000) de Vicente, P., Martín-Pintado, J., Neri, R., & Colom, P. 2000, A&A, 361, 1058
- Ebeling, White & Rangarajan (2000) Ebeling, H., White, D. & Rangarajan, V. 2000, MNRAS, submitted
- Feigelson & Montmerle (1999) Feigelson, E. D. & Montmerle, T. 1999, ARA&A, 37, 363
- Feldman (1992) Feldman, U. 1992, Phys. Scr, 46, 202
- Freeman et al. (2000) Freeman, P. E., Kashyap, V., Rosner, R. & Lamb, D. Q. 2000, ApJ, submitted
- Garmire, Nousek & Bautz (2000) Garmire, G. P., Nousek, J. P. & Bautz, M. W. 2001, in preparation
- Ghez et al. (2000) Ghez, A. M., Morris, M., Becklin, E. E., Tanner, A. & Kremenek, T. 2000, Nature, 407, 349
- Høg et al. (2000) Høg, E. et al. 2000, A&A, 355, L27
- Koyama et al. (1989) Koyama, K., Awaki, H., Kunieda, H., Takano, S., Tawara, Y., Yamauchi, S., Hatsukade, I., & Nagase, F. 1989, Nature 339, 603
- Koyama et al. (1996) Koyama, K., Maeda, Y., Sonobe, T., Takeshima, T., Tanaka, Y., & Yamauchi, S. 1996, PASJ 48, 249
- Lis & Goldsmith (1989) Lis, D. C., & Goldsmith, P. F. 1989, ApJ, 337, 704
- Maeda et al. (2001) Maeda, Y., et al. 2001, ApJ, in press (astro-ph/0102183)
- Murakami et al. (2000) Murakami, H., Koyama, K., Sakano, M., Tsujimoto, M. & Maeda, Y. 2000, ApJ, 534, 283
- Murakami et al. (2001) Murakami, H., Koyama, K., Tsujimoto, M., Maeda, Y. & Sakano, M. 2001, ApJ, 550, 297
- Reid et al. (1988) Reid, M. J., Schneps, M. H., Moran, J. M., Gwinn, C. R., Genzel, R., Downes, D., & Rönnäng, B. 1988, ApJ, 330, 809
- Sakano et al. (2000) Sakano, M., 2000, Ph. D. thesis, Kyoto University
- Sato et al. (2000) Sato, F., Hasegawa, T., Whiteoak, J. B., & Miyawaki, R. 2000, ApJ, 535, 857
- Townsley et al. (2000) Townsley, L. K., Broos, P. S., Garmire, G. P., & Nousek, J. A. 2000, ApJ, 534, L139
- Watson et al. (1981) Watson, M. G., Willingale, R., Grindlay, J.E., & Hertz, P. 1981, ApJ 250, 142
- Weisskopf et al. (1996) Weisskopf. M. C.. O’dell, S. & van Speybroeck, L. P., 1996, Proc. SPIE, 2805, 2
- Yamauchi et al. (1990) Yamauchi, S., Kawada, M., Koyama, K., Kunieda, H., Tawara, Y., & Hatsukade, I. 1990, ApJ, 365, 532

| aaHydrogen column density. | bbTemperature of a thin thermal plasma. | ccFlux (no correction of absorption) in the 2–10 keV band. | ddAbsorption corrected luminosity in the 2–10 keV band | |
|---|---|---|---|---|
| ( H cm-2) | (keV) | (ph s-1 cm-2) | ( erg s-1) | |
| 1.9 | 8.5 | 1.5 | ||
| Reduced (d.o.f.) | 1.02 (12) |
Note. — Errors are at 90% confidence level.
| Continuum | |||||
|---|---|---|---|---|---|
| aaHydrogen column density. | bbIron column density. | ccPhoton index of a power-law model for the continuum spectrum. | ddFlux (no correction of absorption) in the 4–10 keV band. | ||
| ( H cm-2) | ( Fe cm-2) | (ph s-1 cm-2) | |||
| 8.8 | 3.4 | 2.0 (fixed) | 1.2 | ||
| Iron Lines | Total | ||||
| K | K | ||||
| eeCenter energy of iron K line. | ffAbsorption corrected flux of iron K line. | ggCenter energy of iron K line. This value is assumed to be 1.103 (see text). | hhAbsorption corrected flux of iron K line. This value is assumed to be 0.1348 (see text). | iiAbsorption corrected luminosity in the 4–10 keV band. | |
| (keV) | (ph s-1 cm-2) | (keV) | (ph s-1 cm-2) | ( erg s-1) | |
| 6.38 | 5.6 | 7.04 | 1.1 | ||
| Reduced (d.o.f.) | 1.08 (19) | ||||
Note. — Errors are at 90% confidence level.