A Study of the H2O Maser Emission from R Cas
Abstract
Over the past decade we observed a sample of late-type stars (supergiants, semi-regular variables, OH/IR stars, and Mira’s) 3–4 times per year in the 1.3-cm line of H2O. The observations were carried out with the Medicina 32-m and the Effelsberg 100-m telescopes. In addition, a sub-sample of these stars was observed at several epochs with the VLA. In our analysis we also use data from the literature, for instance on mass loss and optical variability. The aim is to investigate the properties of the circumstellar outflows and to elucidate the maser-pumping mechanism. In the conference poster we presented some preliminary results of a 4-star sub-set of the data base; in the small space available here, we briefly describe the monitoring program, and discuss the Mira-variable R Cas in some detail.
1Istituto di Radioastronomia, CNR, Via Gobetti 101, I-40129 Bologna, Italy
2Dip.to di Astron., Univ. Bologna, Via Ranzani 1, I-40127 Bologna, Italy
3Hamburger Sternwarte, Gojensbergweg 112, D-21029 Hamburg, Germany
1. Introduction
Maser emission from the 6 rotational transition of water at 22 GHz is a common feature in circumstellar shells; so far, it has been detected in the envelopes of about 500 stars (30∘; Valdettaro et al. 2001). The masers are strongly variable, sometimes in phase with the luminosity variations of the central star, and sometimes erratically, including spectacular flares.
Because of the high excitation of the emitting level (650 K above ground) the masers must be located in the circumstellar envelope fairly close to the star (at distances of cm), thus tracing the mass motions close to the regions where the mass loss starts. The high variability of the maser emission may therefore reflect the turbulent motions in these regions, indicating that the mass loss process is not a smooth outflow, but may occur in blobs. The individual peaks in the spectra correspond to individual maser spots in spatial maps, and these might be interpreted as such blobs, or density enhancements.
In 1990 we started an extensive observing program of several tens of late-type stars, primarily with the Medicina 32-m and Effelsberg 100-m telescopes, supplemented by observations with the VLA, and the ISO satellite. The scientific aims of this monitoring campaign are to analyze the maser variability as a function of both time and stellar parameters (optical/IR variability, mass loss rate, spectral type, IR colours). In particular we attempt to:
determine typical sizes and numbers of maser components; estimate lifetimes of maser features and timescales for change; derive thickness and radial distance of the maser shell as a function of stellar variations (energy output and mass-loss rate); probe the influence of the pumping conditions on the observed maser properties.
The campaign was most active in the period 1990-1995, but we have continued single-dish observations of a sub-sample of stars up to the present day. In addition, for several of the stars we have (Medicina) observations between 1987-1990, taken from the Arcetri archives.
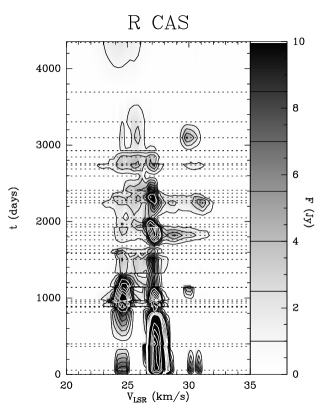
We have started the analysis of those stars for which we have a significant time-coverage of the maser emission. As an example of the available data, we here present preliminary results of one of these stars, R Cas (Mira). Fig. 1 gives a graphical representation of the behaviour of the maser flux density versus velocity as a function of time.
2. Observations and Results
The observations were carried out with the Medicina 32-m and the Effelsberg 100-m antennas. The Medicina telescope HPBW at 22.2 GHz is 1.′9. The pointing accuracy is better than . We estimate an uncertainty of 30 on the absolute flux scale, and a typical 1 rms noise of 1.5 Jy. The Effelsberg HPBW is 40′′; the pointing accuracy is better than . Typical rms values are 0.2 Jy.
The observational results cover the period from 10 Sept. 1987 to 31 July 1999. The time-velocity-flux density plot in Fig. 1 shows that the maser emission is dominated by 2 components, at 24.5 and 27.1 km s-1. This is further illustrated by the collection of spectra shown in Fig. 2.

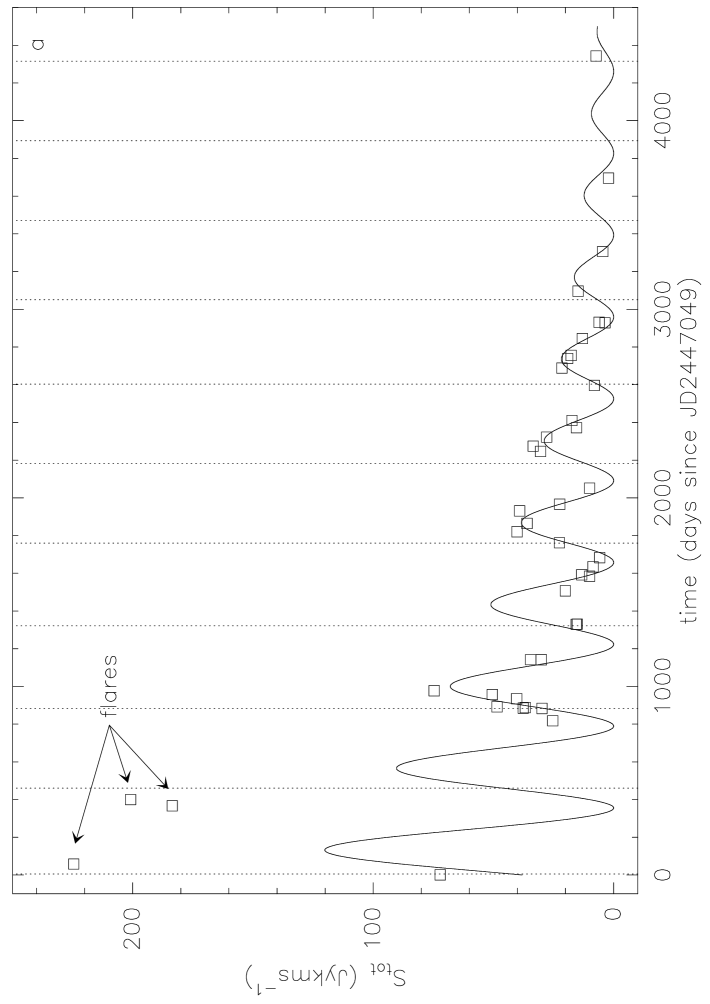
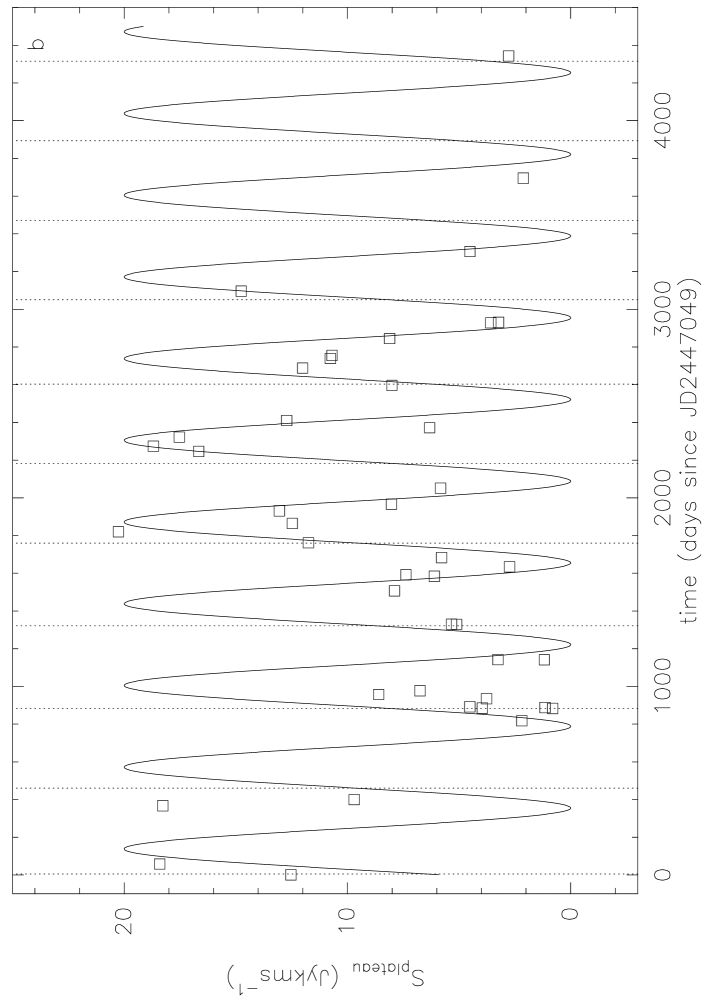
Maser emission has been detected most of the time, except on three occasions when only (1, 0.33 km s-1 resolution) upper limits of 2.9 Jy (18/4/92) and 0.8 Jy (18/10/94, 15/9/95) could be determined. Over the whole observing period, emission at levels 4 Jy (at resolution 0.33 km s-1) is found between 20.4 and 32.3 km s-1. With time, the maser strength has gradually decreased. This is seen very clearly in Fig. 3a, where we plot the integrated H2O emission as a function of time. The curve (least-squares fit for t800d) is a sinusoid with a period of (equal to the optical period, as derived from AAVSO data), damped with an exponential (exp(t), ). The maser peaks with a 115d delay with respect to the optical maximum output (indicated by dotted lines in the figure). The points indicated as “flares” were identified as such by comparison with data from Pashchenko (1990), and were excluded from the fit. The Pashchenko data show 3 outbursts of the 27 km s-1 component between mid-1986 and mid-1989, with the flux density reaching values of 600 Jy in early 1989, with which our data are consistent (note however, that including these points in the fit changes the exponent of the damping function, but does not significantly affect the derived period). The overall decrease of the integrated flux density with time is due to the decrease in flux density of the 2 main components: removing their contribution from the total flux density leaves the emission in the other, less intense components that cluster around the main lines (called “the plateau”). This latter component, shown in Fig. 3b, varies with the same period, and does not show the damping effect seen in the total integrated flux density.
3. Discussion and conclusions
The H2O maser emission from the circumstellar envelope of R Cas might be described as a combination of a “plateau”, which consists of numerous lines at a level of a few Jy, and two strong components (at 24.5 and 27.1 km s-1) which dominated the emission for several years. The “plateau” varies regularly with the period of the star, displaced in phase by 115 days. The superposition of “plateau” and strong components is well described in terms of a damped oscillator. The lines of the “plateau” probably originate in randomly distributed ‘blobs’ within the spherically symmetric wind. The strong components occasionally flared and decreased steadily since 1990; they might have traced two regions of enhanced density, which have left the H2O maser shell recently. With a size of 3.6 cm (Colomer et al. 2000) the typical crossing time of the R Cas maser shell is about 30 years, and the past decade we may have witnessed the passage of a density inhomogeneity through the shell. As recent as May 2001 the total maser output was still at a very low level; it will be interesting to see if and when new strong components will appear again.
Acknowledgments.
In this research, we have used, and acknowledge with thanks, data from the AAVSO International Database, based on observations submitted to the AAVSO by variable-star observers worldwide. We thank Gianni Comoretto and Riccardo Valdettaro for presenting the poster paper at the meeting in our absence.
References
Colomer F., Reid M.J., Menten K.M., Bujarrabal V., 2000, A&A 355, 979
Pashchenko M.I., 1990, Astron. Tsirk 1543
Valdettaro, R., Palla, F., Brand, J. et al. 2001, A&A, 368, 845