Gas-phase H2O and CO2 toward massive protostars
Abstract
We present a study of gas-phase H2O and CO2 toward a sample of 14 massive protostars with the ISO-SWS. Modeling of the H2O spectra using a homogeneous model with a constant excitation temperature shows that the H2O abundances increase with temperature, up to a few times 10-5 with respect to H2 for the hottest sources ( 500 K). This is still a factor of 10 lower than the H2O ice abundances observed toward cold sources in which evaporation is not significant (Keane et al. 2001). Gas-phase CO2 is not abundant in our sources. The abundances are nearly constant for 100 K at a value of a few times 10-7, much lower than the solid-state abundances of 1–3 (Gerakines et al. 1999). For both H2O and CO2 the gas/solid ratio increases with temperature, but the increase is much stronger for H2O than for CO2, suggesting a different type of chemistry. In addition to the homogeneous models, a power law model has been developed for one of our sources, based on the physical structure of this region as determined from submillimeter data by van der Tak et al. (1999). The resulting H2O model spectrum gives a good fit to the data.
keywords:
Star-formation – gas-phase molecules – abundances1 INTRODUCTION
The Infrared Space Observatory (ISO) has provided us with a wealth of new data in the infrared from regions of massive star formation. This includes unique information on molecules such as H2O and CO2, which are difficult to observe from the ground due to the Earth’s atmosphere. H2O and CO2 are among the most abundant species in the envelopes of massive protostars and play a key role in the chemistry in these regions. H2O is a particularly powerful molecule to study the interaction of the protostar with its environment. In warm regions and shocks all gas-phase oxygen not locked up in CO is thought to be driven into H2O, predicting greatly enhanced gas-phase H2O abundances. Also, its level populations are influenced by mid- and far-infrared radiation from warm dust, in addition to collisions. Observations of the well-studied star-forming region Orion-KL indeed show strong gas-phase H2O lines, corresponding to abundances up to 10-4 (van Dishoeck et al. 1998, Gonzalez-Alfonso et al. 1998, Harwit et al. 1998, Wright et al. 2000). High resolution Fabry-Pérot observations of pure rotational H2O lines suggest that this gas is associated with warm and shocked regions (Wright et al. 2000). The CO2 molecule on the other hand cannot be observed through rotational transitions, because it does not have a permanent dipole moment. The excitation temperature of these types of molecules can be a useful indicator of the kinetic temperature of the region.
We have studied gas-phase H2O and CO2 toward a sample of 14 massive young stellar objects including GL 2136, GL 2591, W 3 IRS5, NGC 7538 IRS9, MonR2 IRS3 and GL 490 (see Table 1). The luminosities of these objects are 104–105 L⊙, the masses of the envelopes are 100 M⊙ and their distances are 1-4 kpc. Most of these objects show a multitude of gas-phase H2O absorption lines around 6 m in the SWS spectra, originating in the ro-vibrational band. The ro-vibrational band at 15 m of gas-phase CO2 has also been detected in many sources. The LWS spectra, however, do not show strong lines of gas-phase H2O (Wright et al. 1997). A subset of these sources has been studied previously by van Dishoeck & Helmich (1996) and van Dishoeck (1998).
Both molecules have also been detected in the solid phase toward many massive protostars (e.g. Gerakines et al. 1999, Keane et al. 2001). This allows us to determine gas/solid ratios. In addition, most of these sources show a rich submillimeter emission spectrum, allowing the derivation of temperature and density profiles (van der Tak et al. 2000).
2 OBSERVATIONS AND REDUCTION
The ro-vibrational bands of gas-phase H2O and CO2 around 6 m and 15 m, respectively, have been observed with the Short Wavelength Spectrometer (SWS) in the AOT6 grating mode. All spectra have been reduced using the standard pipeline reduction routines starting from SPD level. In addition, the instrumental fringes have been removed by fitting a cosine to the data (Lahuis & van Dishoeck 2000). The 6 m spectra have been rebinned to a spectral resolution of =0.0020 m and the 15 m spectra to =0.0035 m. The ratio on the continuum is typically 50-100 in the final spectra.
| Source | (H2O) | (H2O)e | (CO2) | (CO2) |
|---|---|---|---|---|
| K | 1018cm-2 | K | 1016cm-2 | |
| GL2136 | 500 | 1.5 | 175 | 2.7 |
| GL2591 | 450 | 3.5 | 500 | 2.5 |
| GL4176 | 400 | 1.5 | 500 | 2.5 |
| GL2059 | 500 | 1.0 | 500 | 0.3 |
| MonR2 IRS3 | 300 | 0.6 | 300 | 2.0 |
| GL490 | 107a | 0.3 | 107 | 0.2 |
| NGC3576 | 500 | 1.5 | 500 | 0.7 |
| NGC7538 IRS1 | 176b | 0.2 | 400 | 0.8 |
| NGC7538 IRS9 | 180b | 0.2 | 150 | 0.8 |
| NGC2024 IRS2 | 44c | 0.09 | 44 | 0.2 |
| S140 IRS1 | 390b | 0.2 | 390 | 0.6 |
| W33A | 120b | 0.2 | 300 | 2.3 |
| W3 IRS4 | 55d | 0.3 | 80 | 0.3 |
| W3 IRS5 | 400 | 0.4 | 350 | 0.7 |
a (CO) from Mitchell et al. (1995)
b (13CO) from Mitchell et al. (1990)
c (13CO) from Black & Willner (1984)
d from Helmich (1996)
e Assuming =5 km s-1
3 MODELING
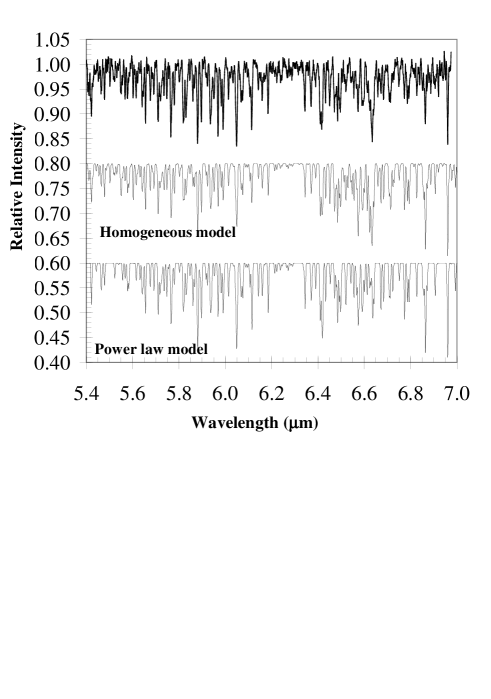
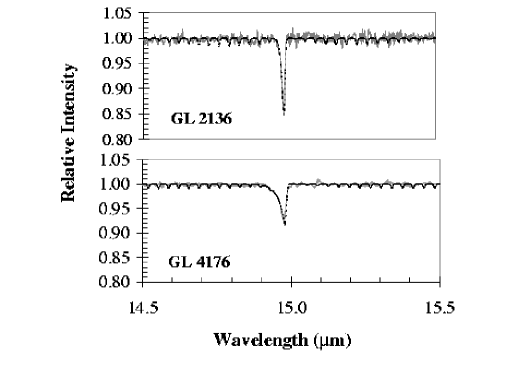
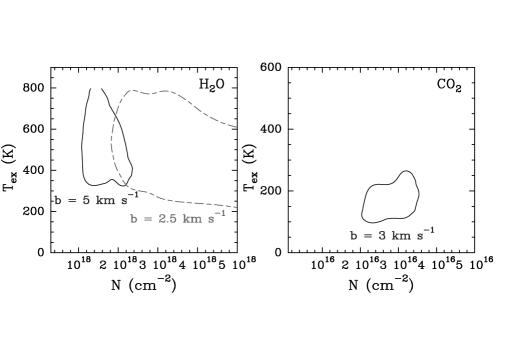
The modeling of the spectra has been performed using synthetic spectra from Helmich (1996), assuming a homogeneous source with a single temperature and column density . Since the H2O models are sensitive to different Doppler -values, a range of values between 1.5 and 10 km s-1 has been used. For CO2 the models are not sensitive to the linewidth, so a mean value of =3 km s-1 is adopted here. This is in agreement with observations of other ro-vibrational absorption lines in the same wavelength region toward these sources. The best fit to the data has then been determined using the reduced -method. Some good fitting models are shown in Fig. 1 and 2 for H2O and CO2 respectively. An example of contours is shown in Fig. 3 for the source GL 2136. This figure illustrates that for low -values (i.e. 2.5 km s-1) the temperature and column density of the gas-phase H2O is not well constrained. In the following analysis =5 km s-1 is adopted for H2O. This corresponds to the mean value of the 13CO =1-0 absorption line widths found by Mitchell et al. (1990).
4 ANALYSIS
4.1 H2O
4.1.1 Homogeneous models
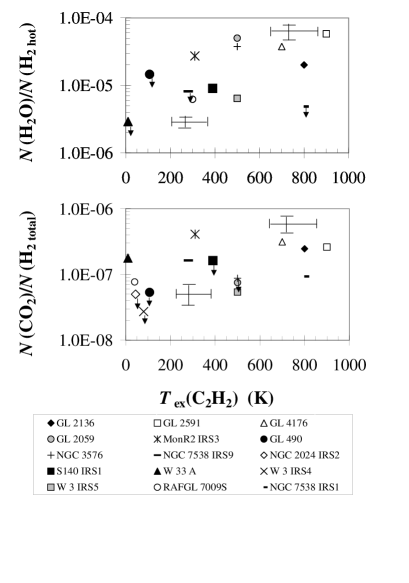
The results of the homogeneous model analysis for H2O are presented in Fig. 4 and Table 1. It is seen that sources with higher excitation temperatures have higher column densities, although the increase is not very strong. The column densities have been converted into abundances with respect to the hot H2 gas, since the spectra show primarily the warmer H2O gas. The H2 column densities have been derived from infrared observations of 13CO assuming a 12CO/13CO ratio of 60 and a 12CO/H2 ratio of 210-4 (e.g. Mitchell et al. 1990, Lacy et al. 1994). The resulting abundances increase with temperature, up to a few times 10-5 for the hottest sources ( 500 K) (Fig.4). The presence of strong C2H2 absorption toward the same sources (Lahuis & van Dishoeck 2000) and the absence of this molecule in the well-known shocked regions Peak 1 and Peak 2 in Orion (Boonman et al. 2001) suggest that shocks do not play a dominant role. Hot core models by Charnley (1997) indicate H2O abundances of for =300 K, consistent with our values. However, he assumes that the initial solid-state abundance of H2O is 10-5, a factor of 10 lower than observed toward cold sources in which evaporation is not significant (Keane et al. 2001). This discrepancy suggests that part of the evaporated H2O is probably destroyed through rapid gas-phase reactions leading to atomic oxygen.
4.1.2 Power law model
Although the homogeneous models provide a good fit to the data, they probably do not reflect the true excitation mechanism of the H2O molecule. Since the level populations of H2O are influenced by radiation from warm dust, pumping has to be included in the models. Also submillimeter observations show that both a temperature and density gradient is present in these objects (van der Tak et al. 2000), and therefore an abundance gradient. Therefore we have set up a power law model for one of our sources GL 2591, using the models by Doty & Neufeld (1997). In this model a density gradient r-1.25 (van der Tak et al. 1999) is used. The temperature and abundance profiles are shown in Fig. 5. Only gas-phase chemistry is included at this point. Although Doty & Neufeld report no significant changes in their models if gas-grain chemistry is included, further investigations have to confirm this. Similar models will be set up for all other sources in our sample. The resulting model spectrum for GL 2591 (Fig. 1) gives a good fit to the data.
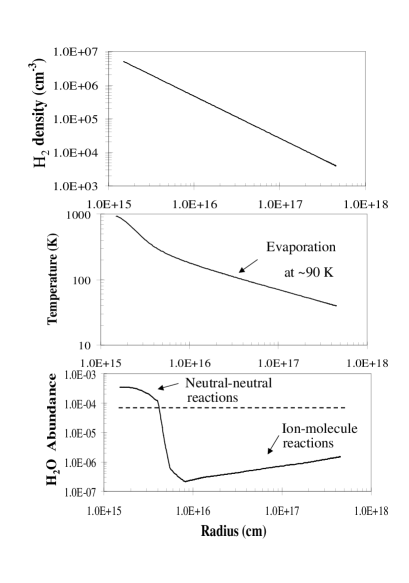
Because of the high H2O abundance derived from the ro-vibrational lines, some pure rotational H2O lines are expected in the LWS spectra. However, reduction of these spectra for GL 2591 only shows a hint of one line in absorption (Wright et al. 1997). A first quick look at the LWS spectra of the other sources shows only a few pure rotational lines of H2O. Since the LWS beam is so large (80′′ diameter) compared to the angular size of the infrared sources, this suggests that the hot water fills only a small fraction of the LWS beam ( few arcseconds) close to the protostar, consistent with Fig. 5.
4.2 CO2
The homogeneous model analysis for gas-phase CO2 shows that this molecule is not very abundant in our sources. The column densities show only a weak increase with temperature, whereas the abundances are roughly constant for 100 K at a value of a few 10-7. Since both warm and cold CO2 is detected, the abundances are given with respect to the total H2 column density (Fig. 4). These abundances are much lower than the solid-state abundances of 1–3 (Gerakines et al. 1999). This suggests that CO2 is also being rapidly destroyed in the gas-phase after evaporation from the grains. Shock chemistry has been suggested by Charnley & Kaufman (2000), but more detailed models including evaporation have to be developed to determine the nature of these reactions.
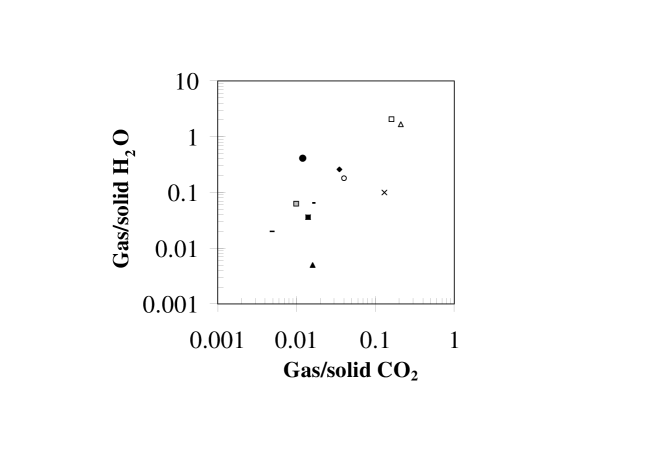
4.3 Gas/solid ratios
From the column densities derived from the homogeneous models for H2O and CO2, gas/solid ratios can been determined, using the solid-state features of H2O (Keane et al. 2001) and CO2 (Gerakines et al. 1999) as observed with ISO-SWS toward the same objects. For both species this ratio increases with temperature, consistent with the location of both species in the warm inner part of the envelope. However the increase is much stronger for H2O than for CO2, although CO2 is more volatile than H2O. The higher ratios for the warmer sources indicate that they are in a later evolutionary stage than the sources with low gas/solid ratios (van der Tak et al. 2000, van Dishoeck & van der Tak 2000).
5 Conclusions
Gas-phase H2O and CO2 are detected towards a large number of massive protostars with ISO-SWS. Modeling of the spectra shows that H2O is hot and abundant. The abundances of gas-phase CO2 are however not very high. Chemical models will be developed in the near future to attempt to explain the differences between these molecules and to investigate the possible destruction of these species through gas-phase reactions. A power law physical-chemical model for one source shows good agreement with the data. The LWS data for the same sources show mostly a lack of pure rotational H2O lines, indicating that the warm gas probed by the ro-vibrational lines is located close to the protostar.
Acknowledgements.
The authors are grateful to F. van der Tak, J. Keane and X. Tielens for stimulating discussions. This work was supported by the Netherlands Organization for Scientific Research (NWO) through grant 614-041-003. CMW acknowledges support of an ARC Australian Postdoctoral Fellowship.References
- [\astronciteBlack & Willner1984] Black, J.H., Willner, S.P. 1984, ApJ 279, 673
- [\astronciteBoonman et al.2001] Boonman, A.M.S., van Dishoeck, E.F., Doty, S.D. et al. 2001, A& A, in prep.
- [\astronciteCharnley1997] Charnley, S.B. 1997, ApJ 481, 396
- [\astronciteCharnley & Kaufman2000] Charnley, S.B. & Kaufman, M.J. 2000, ApJ 529, L111
- [\astronciteDartois et al.1998] Dartois, E. et al. 1998,A& A 331, 651
- [\astronciteDoty & Neufeld1997] Doty, S.D. & Neufeld, D.A. 1997, ApJ 489, 122
- [\astronciteGerakines et al.1999] Gerakines, P.A. et al. 1999, ApJ 522, 357
- [\astronciteGonzalez-Alfonso et al.1998] Gonzalez-Alfonso, E. et al. 1998, ApJ 502, L169
- [\astronciteHarwit et al.1998] Harwit, M. et al. 1998, ApJ 497, L105
- [\astronciteHelmich1996] Helmich, F.P. 1996, PhD thesis Leiden University (http://www.strw.LeidenUniv.nl/ fph/papers.html)
- [\astronciteKeane et al.2001] Keane, J.V. et al. 2001, A& A in press
- [\astronciteLacy et al.1994] Lacy, J.H., Knacke, R., Geballe, T.R. et al. 1994, ApJ 428, L69
- [\astronciteLahuis & van Dishoeck2000] Lahuis, F. & van Dishoeck, E.F. 2000, A& A 355, 699
- [\astronciteMitchell et al.1990] Mitchell, G.F. et al. 1990, ApJ 363, 554
- [\astronciteMitchell et al.1995] Mitchell, G.F. et al. 1995, ApJ 438, 794
- [\astroncitevan der Tak et al.1999] van der Tak, F.F.S., van Dishoeck, E.F., Evans, N.J., Bakker, E.J., Blake, G.A. 1999, ApJ 522, 991
- [\astroncitevan der Tak et al.2000] van der Tak, F.F.S., van Dishoeck, E.F., Evans, N.J., Blake, G.A. 2000, ApJ 537, 283
- [\astroncitevan Dishoeck1998] van Dishoeck, E.F. 1998, Faraday Discussions 109, 31
- [\astroncitevan Dishoeck & Helmich1996] van Dishoeck, E.F. & Helmich, F.P. 1996, A& A 315, L177
- [\astroncitevan Dishoeck et al.1998] van Dishoeck, E.F. et al. 1998, ApJ 502, L173
- [\astroncitevan Dishoeck & van der Tak2000] van Dishoeck, E.F. & van der Tak, F.F.S. 2000, inIAU Symposium 197, eds Y.C. Minh & E.F. van Dishoeck(ASP) p.97
- [\astronciteWright et al.1997] Wright, C.M., van Dishoeck, E.F., Helmich, F.P. et al. 1997, in Analytical Spectroscopy ESA-SP 419, p.37
- [\astronciteWright et al.2000] Wright, C.M., van Dishoeck, E.F., Black, J.H. et al. 2000, A& A 358, 689