Probing the Core Structure of Dark Halos
with Tangential and Radial Arc Statistics
Abstract
We study the arc statistics of gravitational lensing generated by dark matter halos in order to probe their density profile. We characterize the halo profile by two parameters, the inner slope of the central cusp , and the median amplitude of the concentration parameter, , for a halo of mass at , and compute the numbers of tangential and radial arcs produced by gravitational lensing of galaxy clusters. We find that the number of arcs divided by the number of halos is a good statistic which is sensitive to both and with very weak dependence on the cosmological parameters. If the arc samples with well-defined selection criteria for the clusters become available, one can strongly constrain both and . While our tentative comparison with the existing observational data indicates that the inner density profile of dark halos is indeed as steep as predicted by recent simulations (), the homogeneous samples of tangential and radial arcs are required for more quantitative discussions.
1 Introduction
Dark matter halos play a central role in the standard picture of the cosmological structure formation as plausible sites hosting a variety of astronomical objects such as galaxies and clusters of galaxies. On the basis of a series of systematic cosmological N-body simulations, Navarro, Frenk, & White (1996, 1997, hereafter NFW) found that the density profile obeys the “universal” form irrespective of the underlying cosmological parameters, the shape of the primordial fluctuation spectrum and the formation histories. More recent high-resolution simulations indeed confirmed the existence of the central cusp but suggested the even steeper inner slope; rather than (Moore et al., 1999; Fukushige & Makino, 2001). Nevertheless the universality of the profiles in numerical simulations is fairly established except for the possible weak dependence on the halo mass (Jing & Suto, 2000) and also for some scatter around the mean (Jing, 2000).
The above indications from simulations, however, do not seem to be supported by either simple theoretical considerations or available observations. Plausible theoretical models rather predict that the inner slope of the halo profile should depend on the primordial fluctuation spectrum (Hoffman & Shaham, 1985; Syer & White, 1998) and also on the merging history (Nusser & Sheth 1999; see also Łokas & Hoffman 2000). Detailed analyses of the X-ray surface brightness of clusters of galaxies (Wu & Xue, 2000; Wu & Chiueh, 2001) are inconsistent with the scaling of the halo concentration against the halo mass predicted by simulations. Furthermore both rotation curves of the low surface brightness galaxies (Salucci & Burkert, 2000; de Blok et al., 2001) and the inner region of the cluster CL0024-1654 reconstructed from gravitational lensing images (Tyson, Kochanski, & Dell’Antonio, 1998) indicate the flat core instead of the central cusp, although some controversy about each claim still remains (van den Bosch et al., 2000; Broadhurst et al., 2000; Shapiro & Iliev, 2000). This conflict has motivated wild proposals, including an idea that dark matter is self-interacting (Spergel & Steinhardt, 2000).
Since the current situation concerning the numerical, theoretical and observational indications for dark matter halo profiles is somewhat puzzling, it is important to develop another independent methodology to probe the profiles. For this purpose, we focus on the arc statistics of the gravitational lensing in the present paper. The major advantages of this methodology include, (i) the gravitational lensing offers us the direct route to the mass distribution of the dark halo without additional assumptions, for instance, on the physical conditions of gas and stars, (ii) the gravitational arcs are produced mainly due to galaxy clusters which have an empirically good one-to-one correspondence with dark halos, in marked contrast with the case of the multiple QSO images due to galaxies (Nakamura & Suto, 1997; Li & Ostriker, 2001; Wyithe, Turner, & Spergel, 2001; Keeton & Madau, 2001; Takahashi & Chiba, 2001), and (iii) observational confrontation for an individual object may suffer from the specific selection function and the scatter from the mean profile, and thus the statistical average over the cosmological volume is important.
Several authors have already examined the effect of the inner profile of dark halo on giant luminous arcs (Wu & Hammer, 1993; Miralda-Escudé, 1993a, b; Hamana & Futamase, 1997; Hattori, Watanabe, & Yamashita, 1997; Williams, Navarro, & Bartelmann, 1999; Molikawa et al., 1999; Meneghetti et al., 2001). In particular Bartelmann et al. (1998) suggested a strong dependence of arc statistics on cosmological parameters because of the different core structure of dark halos for different cosmological model. Keeton & Madau (2001) found that the number of predicted lenses is strongly correlated with core mass fraction, which results in a strong degeneracy between the inner slope of the central cusp and the dark matter concentration. Molikawa & Hattori (2001) pointed out that the number ratio of tangential and radial arcs produced by a given cluster is tightly correlated with the inner slope; on the basis of eleven tangential and three radial arcs for six clusters, they conclude that the central cusp is indeed favored. Although the existing samples of clusters are somewhat heterogeneous and do not satisfy well-defined selection criteria, this indicates that the arc statistics become useful probes of the core structure of the dark halos. Therefore we present a first systematic study of the effects of the dark halo profiles on the gravitational tangential and radial arc statistics. In particular we take proper account of the magnification bias, the finite size of the source galaxies, and the luminosity distribution and evolution of source galaxies.
The rest of the paper is organized as follows. Section 2 briefly summarizes the main properties of the generalized NFW profile, and §3 presents an analytic formalism of the number count of arcs. Our predictions for the arc statistics are shown in §4. Finally we summarize the conclusions and discuss further implications in §5.
2 Description of the Density Profiles of Dark Matter Halos
2.1 Generalized NFW Profile
Throughout the paper, we adopt a generalized NFW profile for dark matter halos of a form (Jing & Suto, 2000):
| (1) |
where is a scale radius and is a characteristic density. The profile with corresponds to the one NFW proposed, and that with agree with the inner profile claimed by Moore et al. (1999) and Fukushige & Makino (2001). The shape of halos is also characterized by the concentration parameter, which is defined as the ratio of the size of the halo to the scaled radius . Originally NFW used , the radius of halo where the mean inner density reaches 200 times the critical density of the universe. Rather we follow Bullock et al. (2001) and adopt the definition:
| (2) |
The virial radius, , in the above expression is defined through the overdensity at the virialization epoch as
| (3) |
where denotes the mean density of the universe at virialization. Once the density parameter and the cosmological constant are specified, the value of can be computed using the nonlinear spherical collapse model. We use the following formulae:
| (6) |
where , , and the density parameter at virialization is
| (7) |
The approximation to in equation (6) for is obtained by Kitayama & Suto (1996).
2.2 Concentration Parameter
Navarro, Frenk, & White (1997) and Bullock et al. (2001) have extensively examined the cosmological model dependence and redshift evolution of the concentration parameter from N-body simulations, adopting the profile (1) with . Since we consider models with as well, we have to generalize their results. For this purpose, we follow Keeton & Madau (2001). They first define the radius at which the logarithmic slope of the density profile is , i.e., . For the profile of equation (1), , and thus the corresponding concentration parameter reduces to
| (10) |
Then they point out the importance of the scatter of the concentration parameter (Jing, 2000; Bullock et al., 2001) on the lensing statistics, and model the probability distribution function of as a log-normal function:
| (11) |
with . Jing (2000) reported that this dispersion is fairly insensitive to the cosmological model parameters. Finally we introduce the scaling of according to the simulations by Bullock et al. (2001):
| (12) |
where denotes the Hubble constant in units of 100 km/s/Mpc. Bullock et al. (2001) estimate from their simulations with . In the statistical analyses presented below, we parameterize the halo profiles by the amplitude and the inner slope , assuming that the above description is applicable equally well to the three cosmological models that we consider.
3 Tangential and Radial Arc Statistics
3.1 Lens Equations
We denote the image position in the lens plane by and the source position in the source plane by . For the spherical symmetric profile (1), the lens equation (e.g., Schneider, Ehlers, & Falco, 1992) reduces to
| (13) |
where , , and and denote the angular diameter distances from the observer to the lens and the source planes, respectively. The factors and are related to the dark halo profile as follows:
| (14) | |||||
| (15) |
where is the critical surface mass density:
| (16) |
3.2 Number of Arcs per Halo
We consider the distortion of images of source galaxies due to the spherical halo lensing, neglecting the intrinsic ellipticity of those galaxies. In this case the tangential and radial stretching factors of a source image at the source position with respect to the center of the lens halo are simply given by , and because of the spherical symmetry of halos. In terms of these, we define the tangential and radial arcs as those satisfying
| (17) | |||||
| (18) |
We adopt for the threshold of the length-to-width ratio. This value is different from the canonical threshold for giant luminous arcs, adopted by Wu & Hammer (1993), because most radial arcs presently observed have a rather small length-to-width ratio.
The projected areas around a given halo of mass at satisfying equations (17) and (18) yield the cross sections for tangential and radial arcs of circular galaxies located at , respectively. Actually the above definition ignores the finite size of the source galaxies. If the size of the area on the source plane, , satisfying the conditions (17) or (18) is smaller than that of source, however, observable arcs are not produced (e.g., Schneider et al. 1992). Since the smallest galaxy size that is observed as an arc (Hattori et al. 1997) roughly corresponds to kpc, we set for .
Figure 1 shows the lensing cross sections for tangential and radial arcs as a function of source redshift . We present the cases that the mass of the lens halo is and , because radial arcs are not formed for unless or is unrealistically large. The redshift of the lens halo is fixed to . These plots show that the lensing cross section significantly increases as and/or become larger. Furthermore the cross sections for tangential and radial arcs depend on these two parameters rather differently. In turn, separate consideration of tangential and radial arcs yields useful constraints on the core structure of dark halos.
Once the relevant cross section is computed, one can calculate the number of arcs produced by a halo of mass at redshift :
| (19) |
where is the tangential or radial cross section in the source plane, denotes the proper differential distance at :
| (20) |
and denotes the luminosity function of source galaxies.
We incorporate the redshift evolution of the luminosity function of galaxies for adopting the empirical fit by Broadhurst, Ellis, & Shanks (1988):
| (21) |
where is the bright-end luminosity corresponding to . Therefore we have to restrict our consideration for source galaxies up to .
For the local luminosity function , we use the Schechter function normalized to the two degree field (2dF) galaxy redshift survey:
| (22) |
where , , and (Folkes et al, 1999). While those values are derived assuming , we compute the values in different cosmological models by applying an appropriate scaling so that the observed galaxy number counts versus their flux is unchanged.
To evaluate equation (19), we also need the lower bound of the luminosity, , which depends on the magnification of arcs and the limiting magnitude of the sample. First, the magnification of arcs becomes
| (23) |
where denotes the position of arcs in the lens plane. The quantity formally diverges in the case of the point source. In practice, however, saturates at about the value which corresponds to the value of the position deviating from the critical curve by the source size (e.g., Schneider et al. 1992). Therefore we assume that all arcs are magnified by the factor of for tangential arc and for radial arcs, where and is the positions of tangential and radial critical curves. Second, we use as the B-band limiting magnitude of the arc observation. The apparent magnitude can be translated to the luminosity if we employ the K-correction in B-band:
| (24) |
for spiral galaxies (King & Ellis, 1985). Taking both effects into account, becomes
| (25) |
| (26) |
in the case of tangential arcs, where is the luminosity distance.
3.3 Total Number of Arcs
Finally we calculate the total number of arcs by integrating equation (19) as:
| (27) |
where is the comoving number density of halos. We use Press-Schechter mass function (Press & Schechter, 1974):
| (28) |
where is the rms of linear density fluctuation on mass scale at and is the critical linear density contrast given by
| (29) |
with being the linear growth rate normalized to unity at . We consider two selection functions, i.e., the minimum mass of integration for definiteness; the first adopts the constant minimum mass independent of , and the other corresponds to the X-ray survey with the surface brightness flux limit of . Throughout the paper, we use keV band for the flux. Assuming the conventional one-to-one correspondence between dark halos as X-ray clusters, one can relate with and we use the relation shown in Suto et al. (2000).
4 Results
4.1 Number Counts of Arcs
In the specific examples presented below, we consider three representative cosmological models dominated by cold dark matter (CDM); Lambda CDM (LCDM), Standard CDM (SCDM), and Open CDM (OCDM) with , , and , respectively. The amplitude of the mass fluctuation, , smoothed over the top-hat radius of Mpc, is normalized so as to reproduce the X-ray luminosity and temperature functions of clusters (Kitayama & Suto, 1997).
Figure 2 plots the number of halos per steradian (Top panels), tangential arcs (Middle panels), and radial arcs (Bottom panels) between and with , for , , and . The triangles, open squares, and filled circles indicate the results for LCDM, SCDM and OCDM. The numbers of arcs in the middle and bottom panels are divided by the number of halos plotted in the top panels. The left and right panels correspond to the X-ray flux-limited () and the mass-limited () samples. For a given mass and profile of a halo, these plots indicate the range of which mostly contributes to the formation of arcs. Both tangential and radial arcs are efficiently formed around and for flux-limited and mass-limited samples, respectively.
Note the strong dependence on cosmological parameters. The number of halos per steradian as a function of depends on both the volume of the universe up to and the evolution of the mass function. The former mainly explains why the halos are most abundant in LCDM at higher redshifts, while the latter accounts for earlier declining of halo numbers in SCDM (top panels in Fig. 2). Although this behavior is already well-known in the study of cluster abundance (Kitayama, Sasaki & Suto, 1998), we emphasize that the number of arcs per halo also increases with the presence of the cosmological constant (middle and bottom panels in Fig. 2), as is pointed out by Wu & Mao (1996). This directly comes from the dependence of the critical surface mass density (eq. [16]). As plotted in Figure 3, the value of is smallest in LCDM for given and , i.e., the lensing probability is largest for a given halo profile. At , SCDM produces more abundant arcs than LCDM because of the higher density of halos for the same halo mass, i.e., becomes the largest in SCDM cosmology (see eq. [6]).
Turn next to the dependence of the halo profiles ( and ) on the arc statistics. Figure 4 displays the contour of arc statistics for the flux-limited sample with ; LCDM (Top panels), SCDM (Middle panels), and OCDM (Bottom panels). The left and center panels indicate the number of tangential and radial arcs per halos, and the right panels plot the number ratio of radial to tangential arcs. Here we integrate equation (27) over the lens redshift of when arcs are efficiently formed as we discussed above. Clearly both and significantly influence the arc statistics, an order of magnitude more than the cosmological parameters.
If we use the same statistics:
| (30) |
proposed by Molikawa & Hattori (2001) originally for a single cluster, we confirm that the cosmological model dependence is extremely weak even after the statistical average over the redshift. In particular, the number ratio is not so sensitive to and basically a powerful indicator of the inner slope of the dark halo profile. The number of tangential arcs per halos, on the other hand, is more sensitive to (Left panels). Thus combining both the tangential and radial arc statistics, we can constrain both and simultaneously.
Next consider the effects of changing the selection criterion of both halos and sources. Figure 5 shows how the selection criterion of lensing halos alters the prediction of arc statistics in the case of LCDM; from top to bottom, , , , and . While the different selection criterion yields a factor of 500 difference in the number of halos, the arc statistics per halo are fairly robust, and remain the powerful discriminator of the halo profile. Figure 6 displays the difference of the prediction by altering the threshold of the length-to-width ratio, for X-ray flux-limited samples, , in LCDM cosmology. As shown in these plots, changing the threshold mainly changes the number of radial arcs and consequently changes the number ratio drastically. This strong threshold dependence originates from the finite source size effect and is not incorporated properly in Molikawa & Hattori (2001). Therefore it is clear that the finite size of source galaxies must be considered even in the case of the number ratio .
4.2 Uncertainties of the Predictions
The results presented above are based on a variety of model assumptions, and we would like to examine the extent to which they affect the conclusions. More specifically, we focus on the mass function for dark halos, the size of source galaxies, and the evolution of the luminosity function of source galaxies.
While the Press-Schechter mass function is widely used in various cosmological predictions, recent numerical simulations (e.g., Jenkins et al., 2001) suggest that it underpredicts the massive halos while overpredicts the less massive halos. Sheth & Tormen (1999) proposes an empirical correction for the effect as
| (31) |
where , , and . Also we consider the cases of the twice larger threshold for kpc and no-evolution luminosity function, i.e., . The results separately employing the above change are plotted in Figure 7. Among them only the non-evolution model rather changes the total number of arcs, but this may be too extreme. More importantly, the ratio of the tangential and radial arcs, , still remains unchanged in practice even if the luminosity evolution is neglected. The twice larger threshold model mainly changes the number of radial arcs, and as a result this model also changes the number ratio . Thus we conclude that the arc statistics that we presented above are not so affected by the uncertainties of the models, and are fairly robust discriminator of the halo profiles if the finite size of source galaxies is correctly taken into account.
4.3 Tentative Comparison with Observations
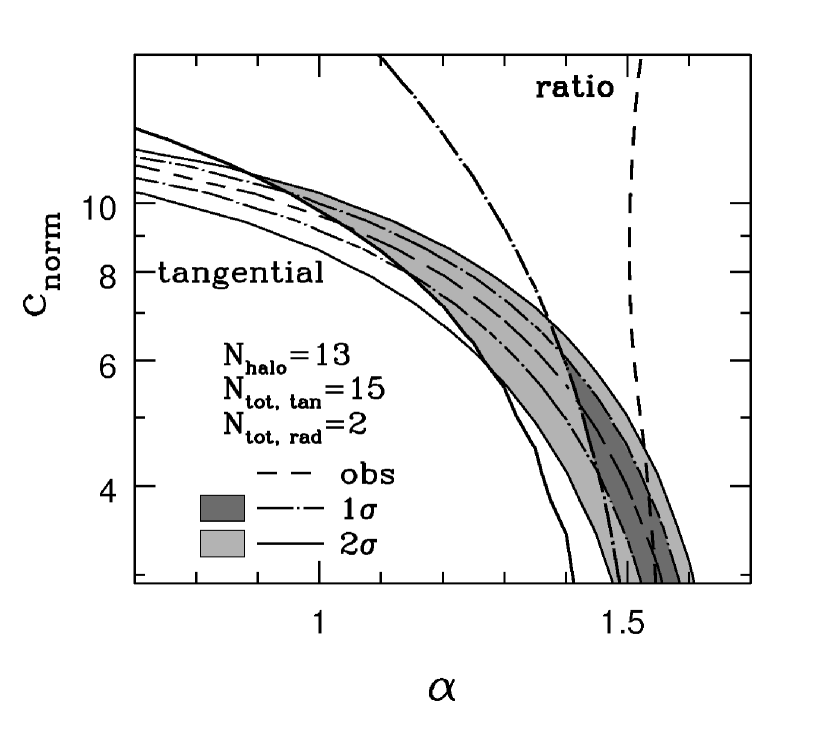
While there is no homogeneous sample for the arc survey available yet that satisfies our selection criteria, it is tempting to make a comparison with the existing data. Luppino et al. (1999) present the results of imaging survey for gravitational lensing in a sample of 38 X-ray selected clusters of galaxies. From these clusters we choose a subsample of 13 clusters which satisfy the condition and . Within these 13 clusters, 15 tangential and 2 radial arcs with are reported. We attempt to draw cosmological implications by comparing these observational values with our theoretical predictions.
Figure 8 shows our tentative comparison with observations, assuming the LCDM cosmology and neglecting possible systematic errors (e.g., intrinsic ellipticies of source galaxies, non-sphericities in lensing halos, etc.). This result implies that dark matter halos should have steep inner profiles as those predicted by simulations, , but rather smaller concentration, . While it is premature to draw definite conclusions from the present comparison, this analysis clearly exhibits the extent to which our current methodology puts useful constraints on and separately. Note again that the number of tangential arcs has a strong degeneracy between and . Thus it is important to combine the number of tangential arcs with the number ratio which is mainly sensitive to . Although the present example does not show the strong constraint on the concentration parameter , a more severe constraint within accuracy at level will be obtained if one uses the cluster samples of . This would be achieved irrespective of the cosmological models.
5 Discussion and Conclusions
In this paper, we study the arc statistics of gravitational lensing produced by dark matter halos in order to probe their density profile. Adopting the generalized NFW profile (1), we describe a statistical method to predict the numbers of tangential and radial arcs as a function of the inner slope and the concentration parameter . We incorporate several realistic effects including the magnification bias, the finite size of the source galaxies, and the luminosity distribution and evolution of source galaxies. We find that the numbers of arcs sensitively depend on the values of and . In addition, the numbers of arcs, if divided by the corresponding number of halos, are almost insensitive to the underlying cosmological parameters. Therefore they prove to be a powerful discriminator of a family of halo density profiles suggested by recent numerical simulations.
Molikawa & Hattori (2001) proposed to use the number ratio of tangential and radial arcs to probe the density profile. We confirm that the ratio remains a useful statistical measure even after taking account of the average over the cosmological mass function, the redshift evolution, mass-dependence and the probability distribution of the concentration parameter. We also show that the effects of finite source size is important even in the case of the number ratio . On the other hand, is mainly sensitive to the inner slope , and we argue that the complementary information on can be obtained by combining the number of tangential arcs per halo.
Our major conclusion that the cosmological model dependence of arc statistics is much weaker than the profile parameters seems inconsistent with the claim by Bartelmann et al. (1998). We note, however, that they use a different value of concentration parameter for different cosmological models. Thus we suspect that the claimed cosmological model dependence actually reflects the sensitivity to the concentration parameter that we discussed at length.
The preliminary comparison with observations suggests that dark matter halos should have steep inner profiles. This comparison, however, is inconsistent with the mass profile of CL0024-1654 reconstructed from gravitational lensing images (Tyson, Kochanski, & Dell’Antonio, 1998) and with the rotation curves of low-surface brightness galaxies which indicate a flat core (Salucci & Burkert, 2000; de Blok et al., 2001). Therefore it is still premature to draw any strong conclusions, e.g., self-interacting dark matter model (Spergel & Steinhardt, 2000), at this point, and it is important to put many constraints on the halo density profile from separate and independent analyses.
Definitely we have to improve the present methodology by taking account of more realistic effects. Firstly, Bartelmann, Steinmetz, & Weiss (1995) pointed out that the number of arcs becomes significantly larger if the intrinsic ellipticity distribution of source galaxies is taken into account. This will increase both the numbers of tangential and radial arcs. Thus these quantitative estimate is important. Secondly, we neglect effects of the galaxies in clusters. In particular, the central cD galaxies move the radial arc closer to the center (Miralda-Escudé, 1995), and will affect especially the number of radial arcs. On the other hand, the effect of cluster galaxies seems to be small and enhances the number of arcs only (Flores, Maller, & Primack, 2000; Meneghetti et al., 2000), though they may affect the number of tangential and radial arcs differently. Finally, deviations from spherical symmetry of lens halos change the number of arcs (Bartelmann, 1995; Molikawa et al., 1999), which will increase the number of tangential arcs and decrease the number of radial arcs (Molikawa & Hattori, 2001). Therefore this effect is certainly important in discussing the number ratio as well as the total number of arcs. We plan to incorporate these effects in a systematic and quantitative fashion which will be reported elsewhere.
References
- Bartelmann (1995) Bartelmann, M. 1995, A&A, 299, 11
- Bartelmann et al. (1998) Bartelmann, M., Huss, A., Colberg, J. M., Jenkins, A., & Pearce, F. R. 1998, A&A, 330, 1
- Bartelmann, Steinmetz, & Weiss (1995) Bartelmann, M., Steinmetz, M., & Weiss, A. 1995, A&A, 297, 1
- Broadhurst, Ellis, & Shanks (1988) Broadhurst, T. J., Ellis, R. S., & Shanks, T. 1988, MNRAS, 235, 827
- Broadhurst et al. (2000) Broadhurst, T., Huang, X., Frye, B., & Ellis, R. 2000, ApJ, 534, L15
- Bullock et al. (2001) Bullock, J. S., Kolatt, T. S., Sigad, Y., Somerville, R. S., Kravtsov, A. V., Klypin, A. A., Primack, J. R., & Dekel, A. 2001, MNRAS, 321, 559
- de Blok et al. (2001) de Blok, W. J. G., McGaugh, S. S., Bosma, A., & Rubin, V. C. 2001, ApJ, 552, L23
- Flores, Maller, & Primack (2000) Flores, R. A., Maller, A. H., & Primack, J. R. 2000, ApJ, 535, 555
- Folkes et al (1999) Folkes, S., et al. 1999, MNRAS, 308, 459
- Fukushige & Makino (2001) Fukushige, T., & Makino, J. 2001, ApJ, in press (astro-ph/0008104)
- Hamana & Futamase (1997) Hamana, T., & Futamase, T. 1997, MNRAS, 286, L7
- Hattori, Watanabe, & Yamashita (1997) Hattori, M., Watanabe, K., & Yamashita, K. 1997, A&A, 319, 764
- Hoffman & Shaham (1985) Hoffman, Y., & Shaham, J. 1985, ApJ, 297, 16
- Jenkins et al. (2001) Jenkins, A., Frenk, C. S., White, S. D. M., Colberg, J. M., Cole, S., Evrard, A. E., Couchman, H. M. P., & Yoshida, N. 2001, MNRAS, 321, 372
- Jing (2000) Jing, Y. P. 2000, ApJ, 535, 30
- Jing & Suto (2000) Jing, Y. P., & Suto, Y. 2000, ApJ, 529, L69
- Keeton & Madau (2001) Keeton, C. R., & Madau, P. 2001, ApJ, 549, L25
- King & Ellis (1985) King, C. R., & Ellis, R. S. 1985, ApJ, 288, 456
- Kitayama, Sasaki & Suto (1998) Kitayama, T., Sasaki, S., & Suto, Y. 1998, PASJ, 50 ,1
- Kitayama & Suto (1996) Kitayama, T., & Suto. Y. 1996, ApJ, 469, 480
- Kitayama & Suto (1997) Kitayama, T., & Suto, Y. 1997, ApJ, 490, 557
- Li & Ostriker (2001) Li, L. X., & Ostriker, J. P. 2001, ApJ, submitted (astro-ph/0010432)
- Łokas & Hoffman (2000) Łokas, E. L., & Hoffman, Y. 2000, ApJ, 542, L139
- Luppino et al. (1999) Luppino, G. A., Gioia, I. M., Hammer, F., Le Févre, O., & Annis, J. A. 1999, A&AS, 136, 117
- Meneghetti et al. (2000) Meneghetti, M., Bolzonella, M., Bartelmann, M., Moscardini, L., & Tormen, G. 2000, MNRAS, 314, 338
- Meneghetti et al. (2001) Meneghetti, M., Yoshida, N., Bartelmann, M., Moscardini, L., Springel, V., Tormen, G., & White S. D. M. 2001, MNRAS, in press (astro-ph/0011405)
- Miralda-Escudé (1993a) Miralda-Escudé, J. 1993a, ApJ, 403, 497
- Miralda-Escudé (1993b) Miralda-Escudé, J. 1993b, ApJ, 403, 509
- Miralda-Escudé (1995) Miralda-Escudé, J. 1995, ApJ, 438, 514
- Molikawa & Hattori (2001) Molikawa, K., & Hattori, M. 2001, ApJ, in press (astro-ph/0009343)
- Molikawa et al. (1999) Molikawa, K., Hattori, M., Kneib, J. P., & Yamashita, K. 1999, A&A, 351, 413
- Moore et al. (1999) Moore, B., Quinn, T., Governato, F., Stadel, J., & Lake, G. 1999, MNRAS, 310, 1147
- Nakamura & Suto (1997) Nakamura, T. T., & Suto, Y. 1997, Prog. Theor. Phys., 97, 49
- Navarro, Frenk, & White (1996) Navarro, J.F., Frenk, C.S., & White, S. D. M. 1996, ApJ, 462, 563
- Navarro, Frenk, & White (1997) Navarro, J.F., Frenk, C.S., & White, S. D. M. 1997, ApJ, 490, 493
- Nusser & Sheth (1999) Nusser, A., & Sheth, R. K. 1999, MNRAS, 303, 685
- Press & Schechter (1974) Press, W. H., & Schechter, P. 1974, ApJ, 187, 425
- Salucci & Burkert (2000) Salucci, P., & Burkert, A. 2000, ApJ, 537, L9
- Shapiro & Iliev (2000) Shapiro, P. R., & Iliev, I. T. 2000, ApJ, 542, L1
- Sheth & Tormen (1999) Sheth, R. K., & Tormen, G. 1999, MNRAS, 308, 119
- Schneider, Ehlers, & Falco (1992) Schneider, P., Ehlers, J., & Falco, E. E. 1992, Gravitational Lenses (New York: Springer)
- Spergel & Steinhardt (2000) Spergel, D. N., & Steinhardt P. J. 2000, Phys. Rev. Lett., 84, 3760
- Suto et al. (2000) Suto, Y., Yamamoto, K., Kitayama, T., & Jing, Y. P. 2000, ApJ, 534, 551
- Syer & White (1998) Syer, D., & White, S. D. M. 1998, MNRAS, 293, 337
- Takahashi & Chiba (2001) Takahashi, R., & Chiba, T. 2001, submitted for publication
- Tyson, Kochanski, & Dell’Antonio (1998) Tyson, J. A., Kochanski, G. P., & Dell’Antonio I. P. 1998, ApJ, 498, L107
- van den Bosch et al. (2000) van den Bosch, F. C., Robertson, B. E., Dalcanton, J. J., & de Blok W. J. G. 2000, AJ, 119, 1579
- Williams, Navarro, & Bartelmann (1999) Williams, L. L. R., Navarro, J. F., & Bartelmann, M. 1999, ApJ, 527, 535
- Wu & Chiueh (2001) Wu, X. P., & Chiueh, T. 2001, ApJ, 547, 82
- Wu & Hammer (1993) Wu, X. P., & Hammer, F. 1993, MNRAS, 262, 187
- Wu & Mao (1996) Wu, X. P., & Mao, S. 1996, ApJ, 463, 404
- Wu & Xue (2000) Wu, X. P., & Xue, Y. J. 2000, ApJ, 529, L5
- Wyithe, Turner, & Spergel (2001) Wyithe, J. S. B., Turner, E. L., & Spergel, D. N. 2001, ApJ, in press (astro-ph/0007354)