Day-Scale Variability of 3C 279 and Searches for Correlations in Gamma-Ray, X-Ray, and Optical Bands
Abstract
Light curves of 3C 279 are presented in optical (R-band), X-rays (RXTE/PCA), and rays (CGRO/EGRET) for 1999 Jan–Feb and 2000 Jan–Mar. During both of those epochs the -ray levels were high, and all three observed bands demonstrated substantial variation, on time scales as short as one day. Correlation analyses provided no consistent pattern, although a rather significant optical/-ray correlation was seen in 1999, with a -ray lag of 2.5 days, and there are other suggestions of correlations in the light curves. For comparison, correlation analysis is also presented for the -ray and X-ray light curves during the large ray flare in 1996 Feb and the two -bright weeks leading up to it; the correlation at that time was strong, with a -ray/X-ray offset of no more than 1 day.
1 Introduction
The discovery by the EGRET instrument on the Compton Gamma Ray Observatory (CGRO) that blazars can be strong -ray emitters posed an intriguing question: what is the mechanism responsible for this previously unknown and sometimes dominant high-energy emission? Obvious candidates are the well-known synchrotron-self-Compton (SSC), and external-Compton (EC) models; in both of these suggested processes, the synchrotron-emitting relativistic electrons would energize soft photons via the inverse-Compton process. In this scenario, the principal matter of debate is the origin of the soft photons, the choices being synchrotron photons alone (SSC; e.g. Marscher & Gear 1985; Maraschi et al. 1992; Bloom & Marscher 1996), photons of different provenance, i.e., accretion disk (ECD; Dermer et al. 1992; Dermer & Schlickeiser 1993; Sikora et al. 1994) or broad-line region (ECR; Blandford & Levinson 1995; Ghisellini & Madau 1996; Dermer et al. 1997), or a combination of those possibilities.
Other possibilities, which have not yet been as carefully explored, are the proton-driven models. In the proton-initiated cascade (PIC) scenario (Mannheim 1993), very high-energy protons initiate photopion production, resulting in a -ray/electron/positron cascade. More recently, other proton-driven models have been discussed (e.g. Protheroe 1996a, 1996b, Rachen 2000, Aharonian 2000, Mücke & Protheroe 2001). These seem to be more readily applied to the lower-luminosity blazars (often described as high-frequency-peaked blazars, HBL’s), but might also be adaptable for higher-luminosity blazars such as 3C 279.
Since the models predict different relationships between variations in the different observing bands, intensive simultaneous monitoring in several widely-spaced bands can provide crucial information on the radiation mechanisms and the structure of the jet. For that reason, several coordinated multiwavelength campaigns have been carried out in the last years on EGRET-detected blazars.
We present here the results of simultaneous monitoring in three bands, GeV rays (from the CGRO/EGRET instrument), X-rays (from the PCA instrument on the RXTE satellite), and R-band optical (from a number of observers and ground-based observatories). For comparison, we also show a similar analysis of the -ray and X-ray light curves from the three weeks leading up to and including the large -ray flare in early February of 1996 (Wehrle et al. 1998). There was little optical coverage at that time, but the rays and X-rays were strongly correlated.
2 Observations
The campaigns were centered around the following observation sequences:
1996 Jan 16 – Feb 06 (CGRO viewing periods 511.0, 511.5)
1999 Jan 20 – Feb 01 (CGRO viewing periods 806.5, 806.7)
2000 Feb 09 – Mar 01 (CGRO viewing periods 910.0, 911.1)
CGRO viewing period 806.5 was an observation of 3C 273 during which EGRET was scheduled to be off. Because of the optical brightness of 3C 279, EGRET was turned on in full-field-of-view-mode to see if 3C 279 was detectable in the EGRET energy range. It was indeed bright, which led to the implementation of a target-of-opportunity observation, viewing period 806.7, with 3C 279 better centered in the field of view.
CGRO viewing period 910.0 was a 3C 279 target of opportunity, based on optical activity and brightness. Viewing period 911.1 was an observation of 3C 273 during which EGRET was scheduled to be off; due to the high -ray level seen in vp 910.0, EGRET was left on for vp 911.1, and was switched to full-field-mode to maximize the sensitivity to 3C 279, which was well off-axis.
2.1 Optical
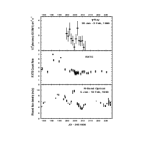
R-band observations were made at a number of observatories, as described below, during both the 1999 and the 2000 campaigns. The coverage thus provided was the best ever obtained on a flat-spectrum radio quasar (FSRQ) during an EGRET observation. Most of the observations were made from European observatories. Several of the authors and observatories are members of the WEBT consortium.
3C 279 was observed during 1999 Jan 18 – Feb 13 and 2000 Jan 29 – Feb 19 at the Abastumani Astrophysical Observatory (Republic of Georgia) using a Peltier-cooled ST-6 CCD camera attached to the Newtonian focus of the 70 cm meniscus telescope (1/3). The full frame field of view is 14.910.7 arcmin2. All observations are performed using combined filters of glasses which match the standard B, V (Johnson) and (Cousins) bands well. Because the scale of the CCD and the meniscus telescope resolution are 2.32.7 arcsec2 per pixel and 1.5 arcsec respectively, the images are undersampled; therefore the frames were slightly defocused to satisfy the sampling theorem. A full description of the Abastumani blazar monitoring program is given in Kurtanidze & Nikolashvili (1999).
Observations in 2000 were made with the 60 cm KVA telescope on La Palma, Canary Islands, using a ST-8 CCD camera with BVR filters. The data reduction was done using IRAF (with bias and flatfield corrections).
Observations were taken with the 1.2 m telescope of Calar Alto Observatory, Spain and with the 0.7 m telescope of the Landessternwarte Heidelberg. Both telescopes are equipped with -cooled CCD cameras. Observations in Heidelberg are carried out with a Johnson R band filter. The Calar Alto observations were carried out in Johnson R (in 2000) and Röser R (in earlier years). Standard de-biasing and flat-fielding was carried out before performing differential aperture photometry. (Finding charts and comparison sequences are available at http://www.lsw.uni-heidelberg.de/projects/extragalactic/charts.html for 3C 279, along with many other blazars.)
Observations were performed using Lowell Observatory’s 42 inch Hall telescope and the 24 inch telescope of the Mount Stromlo / Siding Spring Observatories. Both telescopes are equipped with a direct CCD camera and an autoguider. The observations were made through VRI filters. Repeated exposures of 90 s were obtained for the star field containing 3C 279 and several comparison stars (Smith et al. 1985). These comparison stars were internally calibrated and are located on the same CCD frame as 3C 279. They were used as the reference standard stars in the data reduction process. The observations were reduced following Noble et al. (1997), using the method of Howell and Jacoby (1986). Each exposure is processed through an aperture photometry routine which reduces the data as if it were produced by a multi-star photometer. Differential magnitudes can then be computed for any pair of stars on the frame. Thus, simultaneous observations of 3C 279, several comparison stars, and the sky background will allow one to remove variations which may be due to fluctuations in either atmospheric transparency or extinction. The aperture photometry routine used for these observations is the phot task in IRAF.
Observations were taken with the 2.5 m Nordic Optical Telescope (NOT) on La Palma, Canary Islands, Spain, using the ALFOSC instrument with a 20002000 CCD camera (0.189 arcsec per pixel), and V and R-filters. Data reduction (including bias and flat field corrections) were made either with standard IRAF or MIDAS (J. Heidt) routines.
Observations at the Perugia Observatory were carried out with the Automatic Imaging Telescope (AIT). The AIT is based on an equatorially mounted 40 cm f/5 Newtonian reflector. A CCD camera and Johnson-Cousins filters are utilized for photometry (Tosti et al. 1996). The data were reduced using aperture photometry with the procedure described in that reference.
Observations at the Torino Observatory were done with the 1.05 m REOSC telescope. The equipment includes an EEV CCD camera (12961152 pixels, 0.467 arcsec per pixel) and standard (Johnson-Cousins) filters. Frames are reduced by the Robin procedure locally developed (Lanteri 1999), which includes bias subtraction, flat fielding, and circular Gaussian fit after background subtraction. The magnitude calibration was performed according to the photometric sequence by Raiteri et al. (1998). Magnitudes were converted to fluxes by using a B-band Galactic extinction of 0.06 mag and following Rieke & Lebofsky (1985) and Cardelli et al. (1989).
2.2 X-Rays
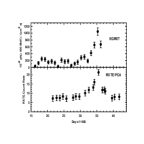
3C 279 was the target for a series of 36 RXTE monitoring observations during 1999 January 2 – February 16, for a total on-source time of 67 ks. The X-ray data presented here were obtained using the Proportional Counter Array (PCA) instrument in the Standard 2 and Good Xenon configurations, with time resolutions of 16 s and s respectively. Only PCUs 0, 1, and 2 were reliably on throughout the observations, and we limit our analysis to data from these detectors.
A further sequence of 28 monitoring observations was performed with RXTE in 2000 February, using the same instrumental configurations, for a total on-source time of 104 ks. For this sequence we utilized data from PCUs 0 and 2.
Data analysis was performed using RXTE standard analysis software, FTOOLS 5.0. Background subtraction of the PCA data was performed utilizing the “L7-240” models generated by the RXTE PCA team. The quality of the background subtraction was checked in two ways: (i) by comparing the source and background spectra and light curves at high energies (50–100 keV) where the source itself no longer contributes detectable events; and (ii) by using the same models to background-subtract the data obtained during slews to and from the source.
2.3 Gamma Rays
The EGRET instrument is sensitive to rays in the energy range 30 to 30,000 MeV. Its capabilities and calibration are described in Thompson et al. (1993), Esposito et al. (1999), and Bertsch (2001). Point source data are analyzed using likelihood techniques (Mattox et al. 1996). The choice of one day as the unit of integration is dictated by the sensitivity of the EGRET detector and the general level of the emission during the time intervals of these observations. In TeV rays, significant variations have been seen on time scales well under one hour (REFS), and may very well be present in 3C 279 in GeV -rays also.
The 1999 and 2000 -ray data presented here have been shown previously in a preliminary form in Hartman et al. 2001a & 2001b. Unfortunately, in both of those references, there was a 1-day error in the Julian Dates for the -ray observations. Thus the 3.5-day optical to -ray lag in 1999 tentatively reported there corresponds to the 2.5-day lag discussed here.
2.4 Light Curves
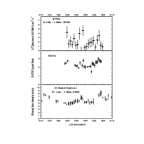
The light curves resulting from the observations described above are shown in Figures 1 and 2.
3 Correlation Analysis and Results
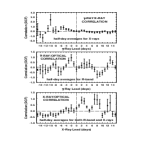
Although the -ray observations were continuous, both the R-band and X-rays were only sampled, sometimes irregularly and/or sparsely; thus the discrete correlation function (DCF), which was designed for analysis of unevenly sampled data (Edelson & Krolik 1988), was used for this analysis. Because of the large statistical errors on the EGRET data points, the initial analysis was done using equation (3) of Edelson & Krolik (1988); this resulted in unphysical normalization in the correlation results. According to J. Krolik (private communication), this is a known but unresolved effect in DCF analyses. Reanalysis ignoring the errors on the EGRET data points resulted in reasonable normalizations, and produced equally significant correlations. Therefore the correlation results shown below all ignore the EGRET errors.
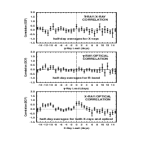
Figures 3 and 4 show the results of the DCF analyses for the 1999 and 2000 light curves, respectively. The following is a summary of the evidence found for correlations.
3.1 1999
3.1.1 -ray/X-ray
Two possible correlations are found, in which the rays lag the X-rays by about 10 and 5-6 days. The first links the highest two X-ray points with the two -ray peaks; the second links the first -ray peak with the second X-ray high point and the second (sharp) -ray peak with a time period with little X-ray coverage. While mathematically possible, these correlations are unconvincing because of the very limited X-ray coverage around the relevant times. In addition, the long delays are probably difficult to account for theoretically.
3.1.2 -ray/optical
If a 2–3 day -ray lag is assumed, the -ray light curve is very similar to that in the R-band, and the DCF analysis finds this to be a rather strong correlation. It is the most convincing correlation found in the six DCF analyses for 1999 and 2000.
A negative correlation with an 8–9 day optical lag links the first -ray peak with the R-band minimum around TJD 210 and the second -ray peak in the optically unsampled TJD 213–218 interval. In addition to being unconvincing because of coverage limitations, this seems quite unphysical.
3.1.3 X-ray/optical
A possible correlation with a 2.5-day optical lag requires that the two optical peaks around TJD 194 and 198 be linked to the two highest X-ray points, and ignores the strongest and sharpest optical feature, placing it in the weak X-ray minimum of TJD 202. This is unconvincing because of the very limited coverage around the two X-ray high points, and also because the most prominent optical feature is ignored.
A fairly significant correlation with an 7–8 day optical lag links the two highest X-ray points with the optical peaks at about TJD 198.5 and 204.0 . This is conceivable, but in addition to the poor X-ray sampling around the relevant times, the 7–8 day offset seems difficult to accommodate theoretically.
3.2 2000
3.2.1 -ray/X-ray
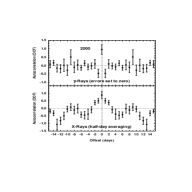
At zero time-delay, there is a sharp peak in the DCF; its statistical significance is only about 1.8, but the correlated pattern is obvious to the eye in the light curves, not only around the sharp peaks, but in the entirety of both light curves.
The variations seen here are more complicated than those seen in both -rays and X-rays in 1996 Jan–Feb, when a zero time-delay was also seen.
3.2.2 -ray/optical
No significant correlation was found.
3.2.3 X-ray/optical
A possible correlation with a one-day optical lag seems plausible, but ignores the X-ray peak around TJD 585.
Another possible correlation is seen with an 11-day X-ray lag. This is rather unconvincing because of X-ray variations that do not show up in the optical, and is also somewhat implausible physically.
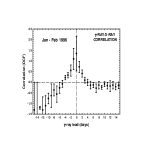
3.3 1996 High State and Large Flare
For comparison, DCF analysis is presented of the -ray and X-ray light curves for the three weeks in 1996 Jan–Feb leading up to and including the large -ray flare. The light curves, adapted from Wehrle et al. 1998, are shown in Figure 5. To the eye, the rays and X-rays appear well-correlated, with no apparent lag; this is confirmed by the DCF analysis, the results of which are shown in Figure 6.
4 Discussion and Conclusions
In the 1999 and 2000 light curves, the correlation that is most apparent to the eye is that in 1999 between the rays and the optical, with a 2.5-day -ray lag. With the -rays, peaked around TJD 206.5, apparently correlating with the optical peak around TJD 204, it is not easy to imagine a scenario that could produce such a sequence (a discussion on various possibilities can be found in Hartman et al. 2001a, 2001b).
Another correlation that seems apparent to the eye, that of the X-rays and rays in 2000, gives a disappointingly weak effect (2 for zero delay) when analyzed with the DCF, as noted above. Examination of the autocorrelations in those two bands (Figure 7) provides some assistance in interpreting the results. Although the X-ray autocorrelation is fairly routine, that for the -rays is unusual. Apparently this is due to the two one-day high points separated by a day for which the best -ray flux estimate is zero, albeit with substantial statistical errors on all of the points. (Examination of the photon maps for the three days under discussion verifies that the -rays do disappear during the middle day.)
Thus there is no consistent pattern found. This could be because the emission in the three bands investigated really does have no persistent relationship, or merely because the data are not adequate, in coverage and/or statistical accuracy, to bring out such relationships.
What correlations and time delays are to be expected here? Detailed predictions about the theoretically expected light curves are difficult because of the multitude of physical processes potentially involved in the formation and evolution of the particle and photon spectra, in particular in FSRQ’s. While detailed modeling of variability patterns expected in high-frequency peaked BL Lac objects (which are well modeled with pure SSC models) has been done (e.g., Takahashi et al. 1996, Georganopoulos & Marscher 1998, Kusunose, Takahara & Li 2000, Li & Kusunose 2000), detailed theoretical work relevant to the short-term variability of the multi-component spectra probably present in the high-energy emission from FSRQ’s is still in its very early stages (see, e.g., Sikora et al. 2001). Thus we must restrict the discussion of the expected time lags to order-of-magnitude estimates at this point.
Frequency-dependent time lags in the short-term variability of FSRQ’s like 3C 279 are likely to be related to either the electron cooling in the effectively emitting region, or the dynamical time scale on which the soft seed photon fields for Compton scattering are changing in the frame of the relativistically moving emitting region. The time scale for acceleration of relativistic electrons might be of the order of the time scale for Fermi acceleration, s in the co-moving frame of the emitting region (where is the Larmor radius, is the electron Lorentz factor, and is the magnetic field in G), or in the observer’s frame (where 10 is the Doppler boosting factor determining the time contraction between the co-moving and the observer’s frame). Thus, for any reasonable value of the magnetic field, variability on the acceleration time scale will be smeared out by light travel time effects, and would be too short to be resolvable with current multiwavelength observations anyway.
Based on the multi-epoch multiwavelength spectral fits to 3C 279 presented in Hartman et al. (2001c), we can estimate the typical electron cooling time scale in the emitting region, assuming that (as indicated by the spectral fits) electron cooling is dominated by inverse-Compton scattering of external radiation fields. Taking into account both the contributions from direct accretion disk radiation and from reprocessing of this radiation within the broad line region, we find the observed cooling time is
where is the Thomson cross section, and the energy density of soft photons in the emitting region is given by
Here is the accretion disk luminosity, is the distance of the emitting region from the central engine, is the bulk Lorentz factor of the emitting region, and and are the radial Thomson depth of the broad line region and its average distance from the central engine, respectively. For reasonable values of the parameters ( erg/s, pc, , , and pc), we find that the cooling time scale relevant to electrons emitting in the EGRET energy regime () is of the order of one to several hours, while for particles emitting predominantly at X-ray and optical frequencies (), it is expected to be one to several days, which would then be the relevant time scale determining time lags between different energy bands.
If time lags are dominated by the dynamical time scale on which the soft seed photon fields (for Compton scattering, to produce the high-energy radiation) are changing, we would expect typical time lags of
For typical values of the parameters ( pc, , and , this gives delays of a few days. Thus, in both cases the expected time lags between different photon energy bands would be of the order of 1 to a few days.
In HBL’s, proton-driven models can produce time delays of the order of a day or less (A. Mücke, private communication). This is probably true also of the more complicated FSRQ’s such as 3C 279, but so far there has been no theoretical study demonstrating this.
It should be noted that, despite the similar flux levels and variations in 1999 and 2000, Hartman et al. (2001c) have shown evidence that conditions in the inner region of 3C 279 may have been substantially different in 2000 than in 1999. In particular, the strength of the broad line emission may have been much weaker in 2000.
Several strong implications for future investigations such as this are clear:
rays - Two necessary improvements are obvious: considerably better statistics and longer observation intervals. Both of these requirements will be met by the GLAST mission, planned for launch in 2006: (1) The GLAST observation plan (at least for the first year or two), is to operate in a scanning mode, so that a large fraction of the sky will be covered during each orbit. Objects near the equator, such as 3C 279, will receive good exposure on every orbit during the scanning part of the mission, and the entire sky will receive significant coverage over one day; (2) Its larger effective area, larger field of view, and better point spread function (compared with EGRET), will provide much better statistics and sensitivity than are available from EGRET.
The Italian -ray telescope AGILE (Vercellone et al. 1999), planned for launch in 2002-2003, will have sensitivity comparable to that of EGRET, but with significantly better angular resolution. Its observing program will permit longer observations than were usually possible with EGRET.
X-rays - The obvious need here is for more uniform coverage. Unfortunately, it is unlikely that the RXTE satellite, with its very flexible scheduling, will be operating by the time of the GLAST launch. The big X-ray missions expected to be operating in parallel with GLAST are likely to be less flexible and accessible than RXTE. They will, however, have much greater sensitivity, permitting investigation of dimmer objects than RXTE. The X-ray monitors on HETE II and Swift may be able to provide some assistance, but their availability and applicability are unclear at the present time. Thus good X-ray time-sampling during the GLAST era appears uncertain at present.
Optical - Although the optical coverage was good during most of the time during and around the EGRET observations used here, there were some substantial holes that allowed the DCF to suggest unlikely correlations. Future investigations of this type will certainly need to improve upon this. Some of the intensive optical monitoring presented here utilized automated telescopes. Hopefully, additional automated systems, at sites throughout the world, will be available by the time of the GLAST launch.
The WEBT (Whole Earth Blazar Telescope; Mattox 1999a, 1999b; Villata et al. 2000) is a different approach to intensive optical monitoring. It is a consortium of about twenty optical observatories around the world, formed to facilitate 24-hour high-time-density blazar observations during multiwavelength campaigns. For additional information see http://swampfox.fmarion.edu/ jmattox/webt/ .
References
- (1)
- (2) Aharonian, F.A. 2000, New Astron., 5, 377
- (3) Bertsch, D.L. 2001, poster presentation at “Gamma 2001” conf.; to be published in proceedings (AIP)
- (4) Blandford, R.D., & Levinson, A. 1995, ApJ, 441, 79
- (5) Bloom, S.D., & Marscher, A.P. 1996, ApJ, 461, 657
- (6) Cardelli J.A., Clayton G.C., Mathis J.S., 1989, ApJ, 345, 245
- (7) Dermer, C.D., Schlickeiser, R., & Mastichiadis, A. 1992, A&A, 256, L27
- (8) Dermer, C.D., & Schlickeiser, R. 1993, ApJ, 416, 458
- (9) Dermer, C.D., Sturner, S.J., & Schlickeiser, R. 1997, ApJS, 109, 103
- (10) Edelson, R.A., & Krolik, J.H. 1988, ApJ, 333,646
- (11) Esposito, J.A., et al. 1999, ApJS, 123, 203
- (12) Georganopoulos, M., & Marscher, A.P. 1998, ApJ, 506, L11
- (13) Ghisellini, G., & Madau, P. 1996, MNRAS, 280, 67
- (14) Hartman, R.C., et al. 2001a, Mem. Soc. Astron. Ital. (in press)
- (15) Hartman, R.C., et al. 2001b, in Probing the Physics of Active Galactic Nuclei by Multiwavelength Monitoring, ed. B.M. Peterson, R.S. Polidan, & R.W. Pogge (San Francisco: Astronomical Society of the Pacific), (in press)
- (16) Hartman, R.C., et al. 2001c, ApJ, 553 (in press)
- (17) Howell, S.B., & Jacoby, G.J. 1986, PASP, 98, 802
- (18) Katajainen, S., Takalo, L.O., & Sillanpää, A., et al. 2000, A&AS, 143, 357
- (19) Kurtanidze, O.M., & Nikolashvili, M.G. 1999, Proc. of the OJ-94 Annual Meeting 1999, Blazar Monitoring Toward the Third Millennium, ed. Raiteri, C.M., Villata, M., & Takalo, L.O. (Pino Torinese:Osservatorio Astronomico di Torino)
- (20) Kusunose, M., Takahara, F., & Li, H. 2000, ApJ, 536, 299
- (21) Lanteri, L., 1999, in OJ-94 Annual Meeting 1999, Blazar Monitoring towards the Third Millennium, ed. Raiteri, C.M., Villata, M., & Takalo, L.O.(Pino Torinese:Osservatorio Astronomico di Torino), 125
- (22) Li, H., & Kusunose, M. 2000, ApJ, 526, 729
- (23) Mannheim, K. 1993, A&A, 269, 67
- (24) Maraschi, L., Ghisellini, G., & Celotti, A. 1992, ApJ, 397, L5
- (25) Marscher, A.P., & Gear, W. 1985, ApJ, 298, 114
- (26) Mattox, J.R., et al. 1996, ApJ, 461, 396
- (27) Mattox, J.R., et al. 1999a, in OJ-94 Annual Meeting 1999, Blazar Monitoring towards the Third Millennium, ed. Raiteri, C.M., Villata, M., & Takalo, L.O. (Pino Torinese:Osservatorio Astronomico di Torino), 44
- (28) Mattox, J.R., et al. 1999b, PASPC, 189, 95
- (29) Mücke, A., & Protheroe, R.J. 2001, Astropart. Phys, 15, 121
- (30) Noble, J. C., Carini, M. T., Miller, H. R., & Goodrich, B. 1997, AJ, 113, 1995
- (31) Protheroe, R.J. 1996a, Adelaide Univ. preprint ADP-AT-96-4
- (32) Protheroe, R.J. 1996b, Adelaide Univ. preprint ADP-AT-96-7
- (33) Rachen, J.P. 2000, in “GeV-TeV Astrophysics: Toward a Major Atmospheric Cherenkov Telescope V”, eds. B.D. Dingus et al., AIP Conf. Proc., Vol 515, (AIP:Snowbird),41
- (34) Raiteri, C.M., Villata, M., Lanteri, L., Cavallone, M., Sobrito, G. 1998, A&AS, 130, 495
- (35) Rieke, G.H., & Lebofsky, M.J. 1985, ApJ, 288, 618
- (36) Sikora, M., Begelman, M.C., & Rees, M.J. 1994, ApJ, 421, 153
- (37) Sikora, M., Blazejowski, M., Begelman, M. C., & Moderski, R., 2001, ApJ(in press)
- (38) Smith, P. S. 1985, AJ, 90, 1184
- (39) Takahashi, T., et al. 1996, ApJ, 470, L89
- (40) Thompson, D.J., et al. 1993, ApJS, 86, 629
- (41) Tosti, G., Pascolini, S., & Fiorucci, M. 1996, PASP, 108, 706
- (42) Vercellone, S., et al. 1999, in OJ-94 Annual Meeting 1999, Blazar Monitoring towards the Third Millennium, ed. Raiteri, C.M., Villata, M., & Takalo, L.O.( Pino Torinese:Osservatorio Astronomico di Torino), 138
- (43) Villata, M., et al., 2000, A&A 363, 108
- (44) Wehrle, A., et al. 1998, ApJ, 497, 178
- (45)