Kinematic properties of gas and stars in 20 disc galaxies ††thanks: Based on observations carried out at the European Southern Observatory, at the Multiple Mirror Telescope Observatory, at the Observatorio del Roque de los Muchachos, at the Observatorio del Teide, and at the Mount Graham International Observatory. ,††thanks: Tables 5 and 6 are only available in electronic form at the CDS via anonymous ftp to cdsarc.u-strasbg.fr (130.79.128.5) or via http://cdsweb.u-strasbg.fr/Abstract.html.
Ionized gas and stellar kinematical parameters have been measured along the major axis of 20 nearby disc galaxies. We discuss the properties of each sample galaxy distinguishing between those characterized by regular or peculiar kinematics. In early-type disc galaxies ionized gas tends to rotate faster than stars and to have a lower velocity dispersion ( and ), whereas in late-type spirals gas and stars show almost the same rotation velocities and velocity dispersions ( and ). Incorporating the early-type disc galaxies studied by Bertola et al. (1995), Fisher (1997) and Corsini et al. (1999), we have compiled a sample of some 40 galaxies for which the major-axis radial profiles of both the stellar and gaseous components have been measured. The value of measured at turns out to be strongly correlated with the galaxy morphological type, while is not and sometimes takes values above the range expected from thermal motions or small-scale turbulence.
Key Words.:
galaxies: kinematics and dynamics – galaxies: elliptical and lenticular, cD – galaxies: spiral1 Introduction
Our current understanding of galaxy formation has greatly benefited from the results of body modelling of structure formation in the early Universe, which predicts that small objects combine gravitationally to produce the galaxies we see today: a process called hierarchical-clustering-merging (hereafter HCM, cf. Kauffmann et al. 1993). One of the tenets of the HCM paradigm is that galaxies are constantly merging with one another. In the case of elliptical and S0 galaxies, there is ample observational evidence that they are continually subjected to mergers with smaller, neighbouring galaxies (cf. Schweizer 1998).
If the HCM paradigm is universal, spirals are subject to the same formation processes as E’s and S0’s. Often the fingerprints of such second events reside in the stellar and/or gaseous kinematics of a galaxy rather than in its morphology. This is particularly true if we consider that the most evident ‘morphological tracers’ of interactions such as peculiar or spindle galaxies make up less than of all objects in any one of the RC3 (de Vaucouleurs et al. 1991), UGC (Nilson 1973) or ESO/Upssala (Lauberts 1982) galaxy catalogues. It is therefore crucial to obtain detailed kinematic parameters of both stars and gas to unveil the relics of accretion or merging events which have occurred in galaxy history. A large fraction of spirals exhibit kinematic disturbances ranging from mild to major, and can generally be explained as the visible signs of tidal encounters (Rubin, Waterman & Kenney 1999). In recent years a number of otherwise morphologically undisturbed spirals have been found which host kinematically-decoupled components (KDC’s), such as stellar KDC’s (Bertola et al. 1999; Sarzi et al. 2000), counter-rotating extended stellar discs (Merrifield & Kuijken 1994; Bertola et al. 1996; Jore et al. 1996), counter-rotating or decoupled gaseous discs (Braun et al. 1992; Rubin 1994; Rix et al. 1995; Ciri et al. 1995; Haynes et al. 2000; Kannappan & Fabricant 2001) and possibly counter-rotating bulges (Prada et al. 1996; but see also Bottema 1999).
Studying the interplay between ionized gas and stellar kinematics allows us to address other issues concerning the dynamical structure of spirals. These include the origin of disc heating and the presence of stellar or gaseous discs in galactic nuclei. Gravitational scattering from giant molecular clouds and spiral density waves are the prime candidates to explain the finite thickness of stellar discs. It is expected that the dominant heating mechanism varies along the Hubble sequence but up to now only two external galaxies have been studied in detail (Gerssen, Kuijken & Merrifield 1996, 2000). The presence in the nuclei of S0’s and spirals of small stellar (Emsellem et al. 1996; Kormendy et al. 1996a,b; van den Bosch, Jaffe & van der Marel 1998; Scorza & van den Bosch 1998; van den Bosch & Emsellem 1998) and/or gaseous discs (Rubin, Kenney, & Young 1997; Bertola et al. 1998; Funes 2000) is usually connected to the presence of a central mass concentration. It also appears that the central black-hole mass is very strongly correlated with the stellar velocity dispersion of the host galaxy bulge as recently found by different authors (Ferrarese & Merritt 2000; Gebhardt et al. 2000). This relation is however based on samples which are affected by different biases and therefore new black-hole masses as well as stellar velocity dispersion measurements are needed.
Finally, the comparison of mass distributions derived from stellar and gaseous kinematics has shown that the ionized gas velocity may not trace the circular speed in the central regions of S0’s (Fillmore, Boroson & Dressler 1986; Bertola et al. 1995; Cinzano et al. 1999) and bulge-dominated spirals (Corsini et al. 1999; Pignatelli et al. 2001). The possible difference between the gas rotational velocity and the gravitational equilibrium circular velocity poses questions about the reliability of mass distributions derived from the direct decomposition of ionized gas rotation curves into the bulge, disc and dark halo contribution (see Kent 1988 for a discussion). This phenomenon has been explained in terms of pressure-supported ionized gas, gas motions which are not confined to the galaxy equatorial plane and drag forces but its cause is still unclear due to the limited statistics and requires further investigation.
All these issues will benefit greatly from a survey devoted to the comparative measurements of ionized gas and stellar kinematics. With this aim we obtained long-slit spectroscopy of a sample of 20 disc galaxies, mostly spirals. We measured the velocity, velocity dispersion, and radial profiles of the stellar component and velocity and velocity dispersion radial profiles of the ionized gas along their major axes. In Pignatelli et al. (2001) we present the mass modelling of three galaxies of the sample, the Sa NGC 772 and the Sb’s NGC 3898 and NGC 7782.
This paper is organized as follows. An overview of the properties of the sample galaxies as well as the spectroscopic observations and their data analysis are presented in Sect. 2. The resulting stellar and gaseous kinematic parameters are given in Sect. 3. Conclusions are discussed in Sect. 4. In the appendix a comparison with published kinematic measurements of the sample galaxies is performed.
| object | type | P.A. | scale | |||||||
|---|---|---|---|---|---|---|---|---|---|---|
| [name] | [RSA] | [RC3] | [mag] | [°] | [°] | [] | [Mpc] | [pc] | [′] | [mag] |
| (1) | (2) | (3) | (4) | (5) | (6) | (7) | (8) | (9) | (10) | (11) |
| NGC 224 | Sb | .SAS3.. | 4.36 | 55 | 72 | 0.7 | 3.4 | 95.3 | ||
| NGC 470 | Sbc(s) | .SAT3.. | 12.53 | 155 | 52 | 2370 | 33.8 | 163.9 | 1.4 | |
| NGC 772 | Sb(rs) | .SAS3.. | 11.09 | 130 | 54 | 2470 | 35.6 | 172.7 | 3.6 | |
| NGC 949 | Sc(s) | .SAT3$ | 12.40 | 145 | 58 | 620 | 11.4 | 55.2 | 1.2 | |
| NGC 980 | … | .L….. | 13.20 | 110 | 58 | 5765 | 80.1 | 388.2 | 0.8 | |
| NGC 1160 | … | .S..6. | 13.50 | 50 | 62 | 2510 | 36.6 | 177.4 | 1.0 | |
| NGC 2541 | Sc(s) | .SAS6.. | 12.26 | 165 | 61 | 565 | 8.7 | 42.2 | 3.2 | |
| NGC 2683 | Sb | .SAT3.. | 10.64 | 44 | 78 | 460 | 5.3 | 25.6 | 4.7 | |
| NGC 2841 | Sb | .SAR3. | 10.09 | 147 | 65 | 640 | 9.6 | 46.4 | 4.1 | |
| NGC 3031 | Sb(r) | .SAS2.. | 7.89 | 157 | 59 | 1.5 | 7.2 | 13.5 | ||
| NGC 3200 | Sb(r) | .SXT5. | 12.83 | 169 | 73 | 3550 | 43.9 | 213.1 | 2.1 | |
| NGC 3368 | Sab(s) | .SXT2.. | 10.11 | 5 | 47 | 860 | 9.7 | 47.1 | 3.8 | |
| NGC 3705 | Sab(r) | .SXR2.. | 11.86 | 122 | 66 | 1000 | 11.4 | 55.2 | 2.4 | |
| NGC 3810 | Sc(s) | .SAT5.. | 11.35 | 15 | 45 | 1000 | 11.9 | 56.0 | 2.1 | |
| NGC 3898 | Sa | .SAS2.. | 11.60 | 107 | 54 | 1185 | 17.1 | 82.9 | 2.2 | |
| NGC 4419 | SBab: | .SBS1./ | 12.08 | 133 | 71 | 17.0 | 82.4 | 1.7 | ||
| NGC 5064 | Sa | PSA.2. | 13.04 | 38 | 64 | 2980 | 36.0 | 174.4 | 1.2 | |
| NGC 5854 | Sa | .LBS./ | 12.71 | 55 | 76 | 1630 | 21.8 | 100.7 | 1.4 | |
| NGC 7331 | Sb(rs) | .SAS3.. | 10.35 | 171 | 70 | 820 | 14.7 | 72.0 | 5.2 | |
| NGC 7782 | Sb(s) | .SAS3.. | 13.08 | 175 | 58 | 5430 | 75.3 | 364.9 | 1.2 | |
NOTES – Col.(2): morphological classification from RSA. Col.(3): morphological classification from RC3. Col.(4): total observed blue magnitude from RC3 except for NGC 980 and NGC 5064 (LEDA). Col.(5): major-axis position angle taken from RC3. Col.(6): inclination derived as . The observed axial ratio is taken from RC3 and the intrinsic flattening has been assumed following Guthrie (1992). Col.(7): heliocentric velocity of the galaxy derived at centre of symmetry of the rotation curve of the gas. . Col.(8): distance obtained as with Mpc-1 and the systemic velocity derived from corrected for the motion of the Sun with respect to the Local Group as in the RSA. For NGC 224 and NGC 4419 we assume distances of 0.7 Mpc (Binney & Merrifield 1999) and 17 Mpc (Freedman et al. 1994), respectively. Col.(10): radius of the 25 mag arcsec-2 isophote derived as with from RC3. Col.(11): absolute total blue magnitude corrected for inclination and extinction from RC3.
2 Sample selection, observations and data reduction
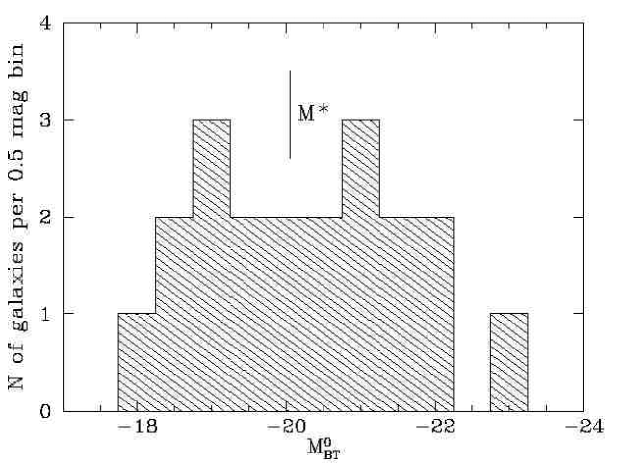
All the observed galaxies are bright () and nearby objects ( ) with an intermediate-to-high inclination () and their Hubble morphological type ranges from S0 to Sc. An overview of their basic properties is given in Tab. 1. Fig. 1 shows the absolute magnitude distribution for the galaxies of our sample. It nicely brackets the M∗ value for spiral galaxies taken from Marzke et al. (1998) assuming H Mpc-1.
2.1 Spectroscopic observations
The long-slit spectroscopic observations of our sample galaxies were carried out at the 4.5-m Multi Mirror Telescope (MMT) in Arizona (USA), at the ESO 1.52-m Spectroscopic Telescope at La Silla (Chile), and at the 2.5-m Isaac Newton Telescope (INT) on La Palma (Spain). The instrumental setup of each observing run is summarized in Tab. 2.
| Parameter | MMT | ESO 1.52-m | INT | |
|---|---|---|---|---|
| Date | 21-23 Oct 1990 | 17-18 Dec 90 | 30 Apr - 02 May 1992 | 20-21 Mar 1996 |
| Spectrograph | Red Channel | B&C | IDS | |
| Grating () | 1200 | 1200 (ESO No. 26) | 1800 | |
| Detector | Loral 128mmt | FA2048L (ESO No. 24) | TK1024A | |
| Pixel size () | ||||
| Pixel binning | ||||
| Scale () | 0.30 | 0.81 | 0.33 | |
| Reciprocal dispersion () | 0.82 | 0.98 | 0.24 | |
| Slit width (′′) | 1.25 | 2.1 | 1.9 | |
| Slit length (′) | 3.0 | 4.2 | 4.0 | |
| Spectral range (Å) | 4850–5500 | 4900–6900 | 6650–6890 | |
| Comparison lamp | He–Ne–Ar–Fe | He–Ar | Cu–Ar | |
| Instrumental FWHM (Å) | ||||
| Instrumental () | 57 | 65 | 45 | 17 |
| Seeing FWHM (′′) | 1.2–1.5 | 1.0–1.5 | 1.0–1.8 | |
NOTES – The instrumental was measured at [O III] for the MMT spectra and at H for the ESO 1.52-m and INT spectra.
At the beginning of each exposure, the slit was centred on the galaxy nucleus using the guiding TV camera and aligned along the galaxy major axis. The details of the slit position and spectra exposure times are given in Tab. 3. In all the observing runs comparison lamp exposures were obtained before and after each object integration to allow an accurate wavelength calibration. Quartz-lamp and twilight-sky flat fields were used to map pixel-to-pixel sensitivity variations and large-scale illumination patterns. At the MMT and ESO 1.52-m telescopes a number of late-G and early-K stars were observed with the same set up to serve as templates in measuring the stellar kinematics (see Tab. 4). The seeing range during the different spectroscopic runs is given in Tab. 2.
| Object | Date | Telescope | P.A. | |
|---|---|---|---|---|
| [s] | [∘] | |||
| NGC 224 | 18 Dec 90 | MMT | 23600 | 55 |
| NGC 470 | 22 Oct 90 | MMT | 3600 | 155 |
| NGC 772 | 22 Oct 90 | MMT | 3600 | 130 |
| NGC 949 | 21 Oct 90 | MMT | 3600 | 145 |
| NGC 980 | 22 Oct 90 | MMT | 3600 | 110 |
| NGC 1160 | 21 Oct 90 | MMT | 3600 | 50 |
| NGC 2541 | 21 Oct 90 | MMT | 3600 | 165 |
| NGC 2683 | 18 Dec 90 | MMT | 3600 | 44 |
| NGC 2841 | 22 Oct 90 | MMT | 3600 | 147 |
| NGC 3031 | 17 Dec 90 | MMT | 3600 | 157 |
| NGC 3200 | 02 May 92 | ESO 1.52-m | 3600 | 79 |
| NGC 3368 | 17 Dec 90 | MMT | 3600 | 5 |
| NGC 3705 | 17 Dec 90 | MMT | 3600 | 122 |
| NGC 3810 | 18 Dec 90 | MMT | 3600 | 15 |
| NGC 3898 | 18 Dec 90 | MMT | 3600 | 107 |
| 19 Mar 96 | INT | 33600 | 107 | |
| NGC 4419 | 20 Mar 96 | INT | 23300 | 133 |
| 02 May 92 | ESO 1.52-m | 3600 | 133 | |
| NGC 5064 | 30 Apr 92 | ESO 1.52-m | 3600 | 138 |
| NGC 5854 | 30 Apr 92 | ESO 1.52-m | 3600 | 145 |
| 30 Apr 92 | ESO 1.52-m | 3600 | 25 | |
| 30 Apr 92 | ESO 1.52-m | 3600 | 55 | |
| NGC 7331 | 22 Oct 90 | MMT | 3600 | 171 |
| NGC 7782 | 22 Oct 90 | MMT | 3600 | 30 |
| Object | Date | Telescope | Type | |
|---|---|---|---|---|
| [s] | [BSC] | |||
| HR 2649 | 21 Oct 90 | MMT | 180 | K3III |
| HR 7778 | 23 Oct 90 | MMT | 200 | G8III |
| HR 7854 | 23 Oct 90 | MMT | 200 | K0III |
| HR 941 | 18 Dec 90 | MMT | 99 | K0III |
| HR 3360 | 17 Dec 90 | MMT | 195 | K2III |
| HR 3905 | 17 Dec 90 | MMT | 126 | K2III |
| HR 4246 | 18 Dec 90 | MMT | 100 | K3III |
| HR 4924 | 17 Dec 90 | MMT | 139 | G9III |
| HR 8694 | 18 Dec 90 | MMT | 89 | K0III |
| HR 3431 | 30 Apr 92 | ESO 1.52-m | 520 | K4III |
| HR 5601 | 30 Apr 92 | ESO 1.52-m | 515 | K0.5III |
| HR 6318 | 30 Apr 92 | ESO 1.52-m | 520 | K4III |
| HR 7595 | 30 Apr 92 | ESO 1.52-m | 520 | K0III |
NOTE – The spectral class of the template star is taken from The Bright Star Catalogue (Hoffleit & Jaschek 1982).
2.2 Routine data reduction
The spectra were bias subtracted, flat-field corrected, cleaned for cosmic rays and wavelength calibrated using standard MIDAS111MIDAS is developed and maintained by the European Southern Observatory. routines. Cosmic rays were identified by comparing the counts in each pixel with the local mean and standard deviation (as obtained from the Poisson statistics of the photons knowing the gain and readout noise of the detector), and then corrected by interpolating a suitable value.
The instrumental resolution was derived as the mean of the Gaussian FWHM’s measured for a dozen unblended arc-lamp lines distributed over the whole spectral range of a wavelength-calibrated comparison spectrum. The mean FWHM of the arc-lamp lines as well as the corresponding instrumental velocity dispersion are given in Tab. 2. Finally, the individual spectra of the same object were aligned and coadded using their stellar-continuum centres as reference. For each spectrum the centre of the galaxy was defined by the centre of a Gaussian fit to the radial profile of the stellar continuum. The contribution of the sky was determined from the edges of the resulting spectrum and then subtracted.
2.3 Measuring stellar and ionized gas kinematics
The stellar kinematic parameters were measured from the absorption lines present on each spectrum using the Fourier Correlation Quotient Method (Bender 1990) as applied by Bender, Saglia & Gerhard (1994). The spectra of the stars G8III HR 7778, K2III HR 6415 and K4III HR 6318 provided the best match to the galaxy spectra obtained in October 1990, December 1990 and May 1992, respectively. They were used as templates to measure the stellar kinematic parameters of the sample galaxies in the three runs. For each spectrum we measured the radial profiles of the heliocentric stellar velocity (), velocity dispersion (), and the Gauss-Hermite coefficients and , in the case of sufficiently high S/N. The stellar kinematics of all the sample galaxies are tabulated in Tab. 5. The table provides the galaxy name, the position angle of the slit in degrees, the radial distance from the galaxy centre in arcsec, the observed heliocentric velocity and the velocity dispersion in , and the Gauss-Hermite coefficients and .
The ionized gas kinematic parameters were derived by measuring the position and the width of [O III] emission line in the MMT spectra and the H emission line in the ESO 1.52-m and INT spectra. The position, the FWHM and the uncalibrated flux of the emission lines were individually determined by fitting interactively a single Gaussian to each emission line, and a polynomial to its surrounding continuum using the MIDAS package ALICE. The wavelength of the Gaussian peak was converted to velocity via the optical convention , and then the standard heliocentric correction was applied to obtain the ionized gas heliocentric velocity (). The Gaussian FWHM was corrected for the instrumental FWHM, and then converted to velocity dispersion (). At some radii where the intensity of the emission lines was low, we averaged adjacent spectral rows to improve the signal-to-noise ratio of the lines. The ionized-gas kinematic parameters of all the sample galaxies are tabulated in Tab. 6. The table provides the galaxy name, the position angle of the slit in degrees, the radial distance from the galaxy centre in arcsec, the observed heliocentric velocity and the velocity dispersion in , and the relevant emission line. For each galaxy we derive the heliocentric system velocity as the velocity of the centre of symmetry of the rotation curve of the gas.
3 Results
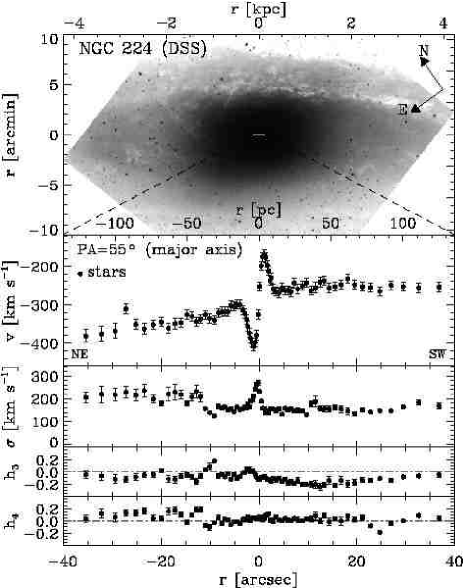
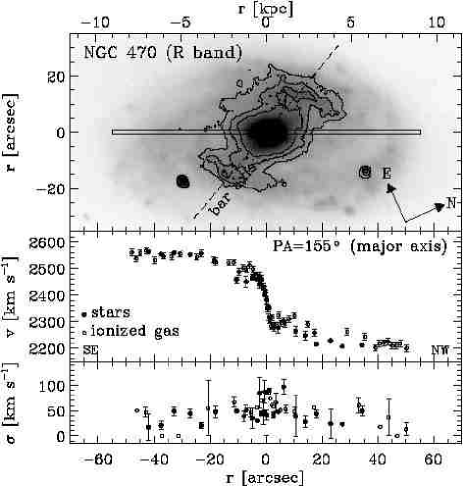
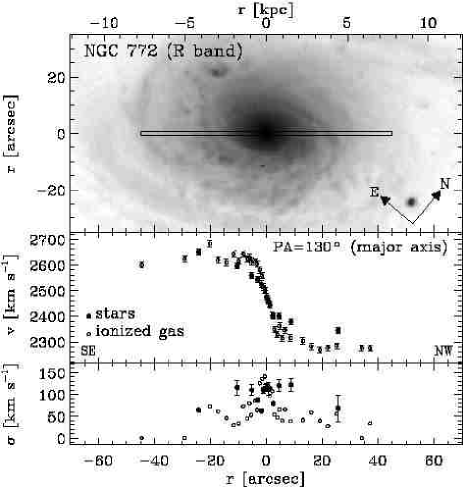
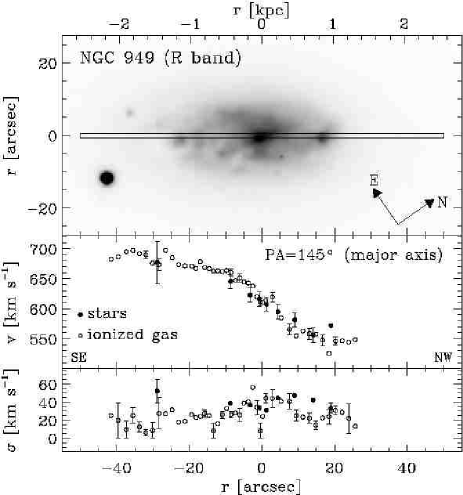
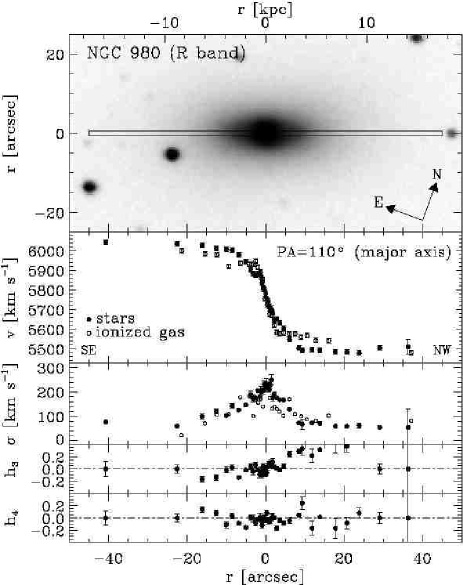
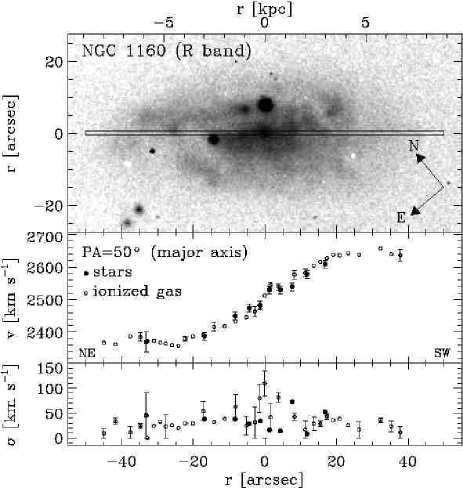
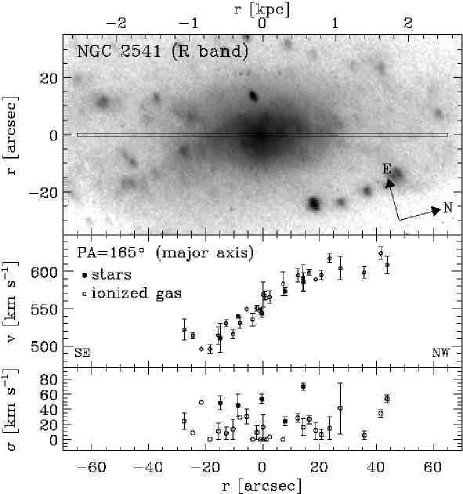
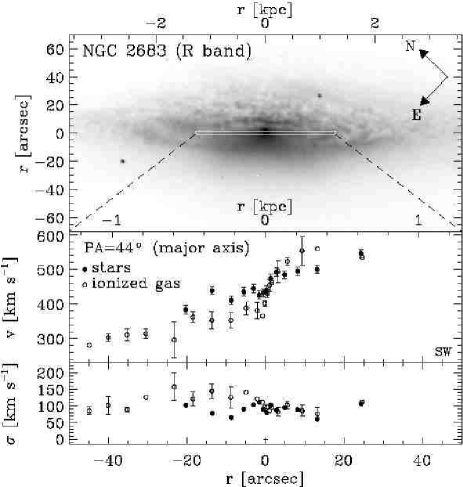
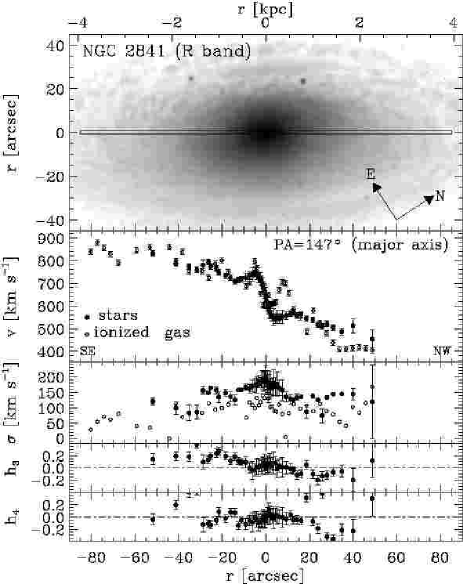
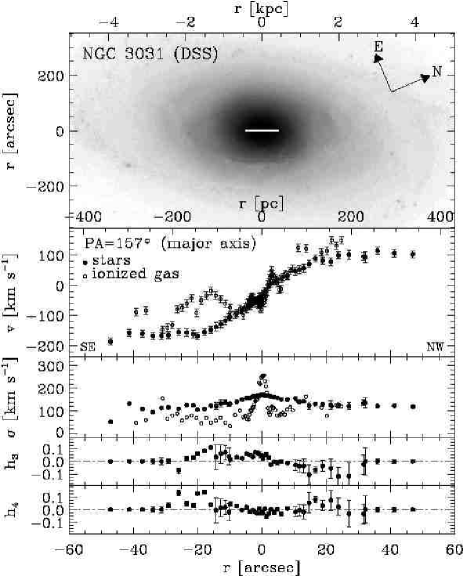
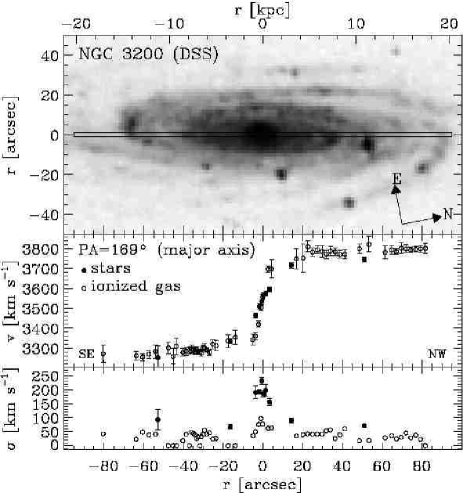
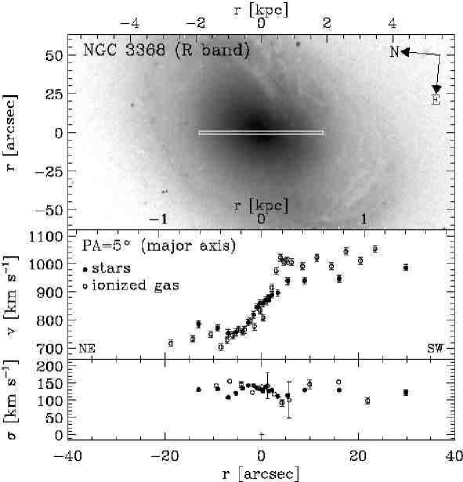
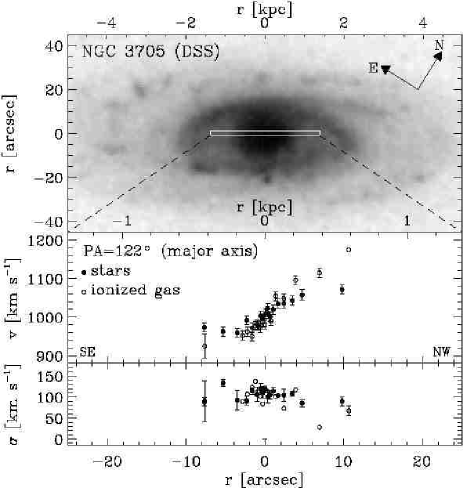
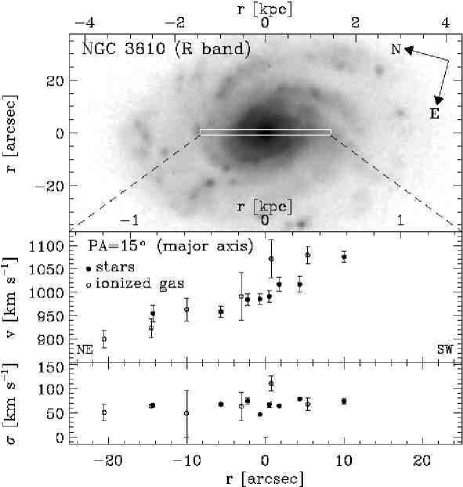
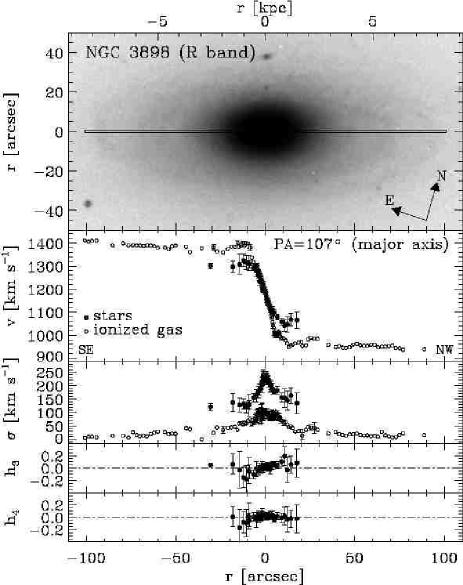
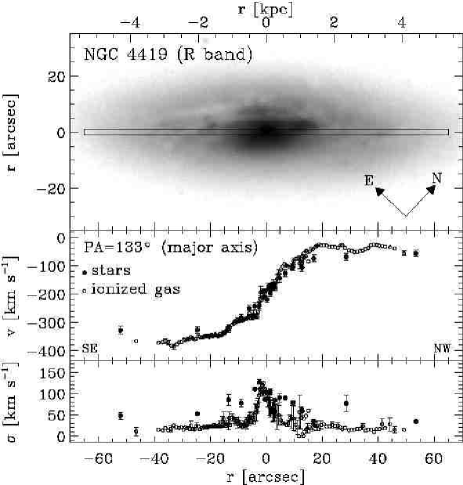
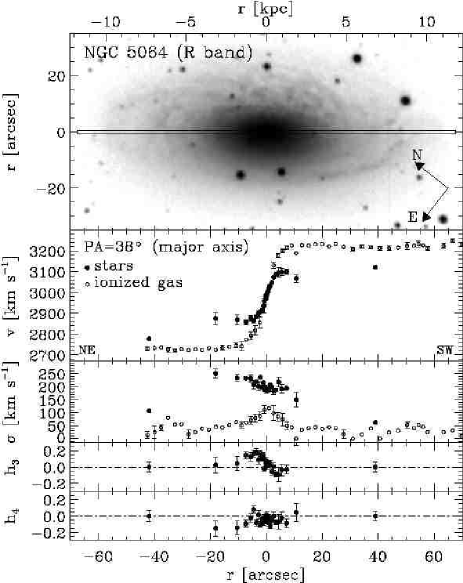
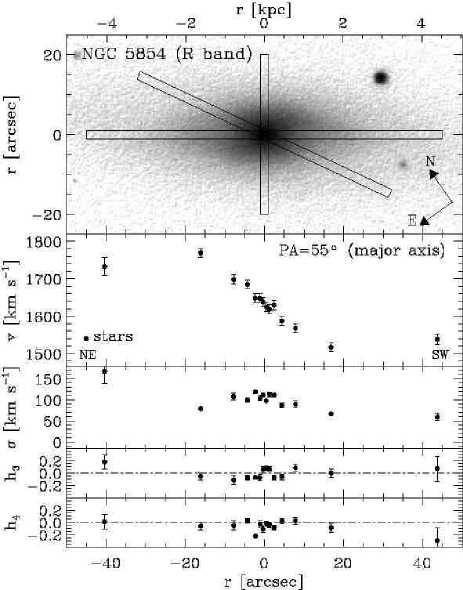
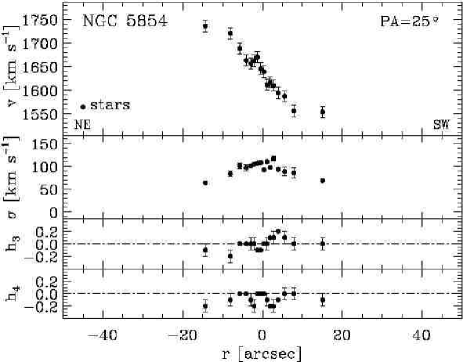
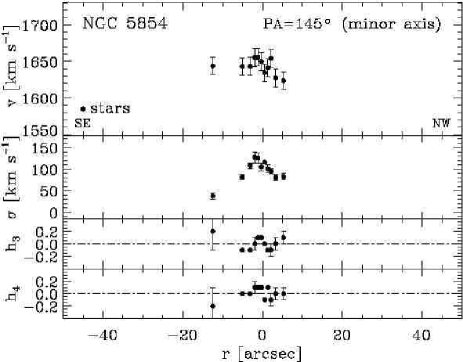
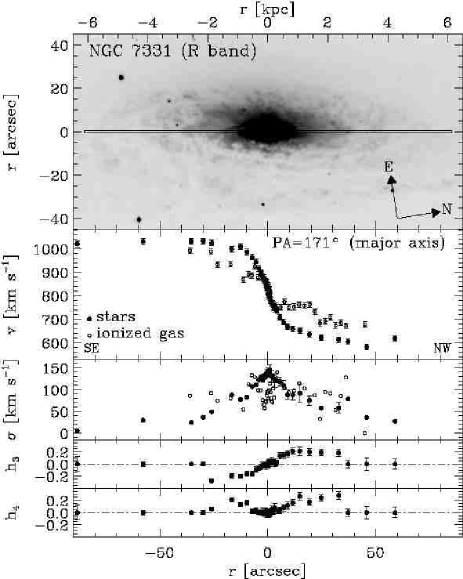
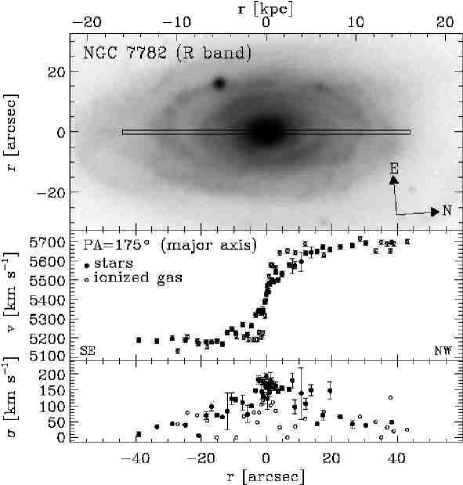
The resulting stellar and ionized-gas kinematics of all our sample galaxies are shown in Fig. 2. Their relevant kinematic properties such as velocity gradients and velocity dispersions for both the stellar and gaseous components at different radii are given in Tab. 8.
For each object the plot of the stellar and gaseous kinematics is organized as it follows:
-
1.
We display in the upper panel an image of the galaxy. We obtained the images for most of the sample galaxies in February and November 1997 at the 1.8-m Vatican Advanced Technology (VATT) in Arizona (USA), in December 1997 at the 0.8-m IAC80 telescope in Tenerife (Spain), and in March 1998 at the ESO 3.6-m telescope in La Silla (Chile). For the remaining galaxies we used an image taken either from the INT archive or the Digital Sky Survey (see Table 7). All images (except for the DSS ones) were bias-subtracted, flat-field corrected and cleaned for cosmic rays. The galaxy frames have been rotated and the slit position has been plotted to perform a better comparison between morphological and kinematic properties. The slit width and length correspond to those adopted in obtaining the spectra.
Table 7: Source of the images of sample galaxies Object Source Band NGC 224 DSS NGC 470 IAC80 NGC 772 VATT NGC 949 VATT NGC 980 IAC80 NGC 1160 VATT NGC 2541 IAC80 NGC 2683 INT Archive NGC 2841 IAC80 NGC 3031 DSS NGC 3200 DSS NGC 3368 INT Archive NGC 3705 DSS NGC 3810 DSS NGC 3898 VATT NGC 4419 VATT NGC 5064 ESO 3.6-m NGC 5854 IAC80 NGC 7331 INT Archive NGC 7782 VATT -
2.
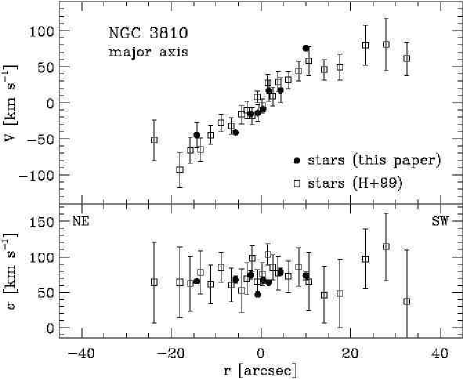
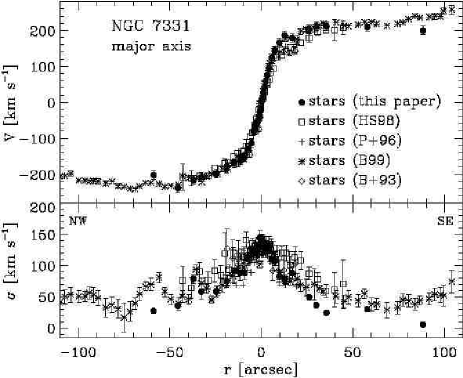
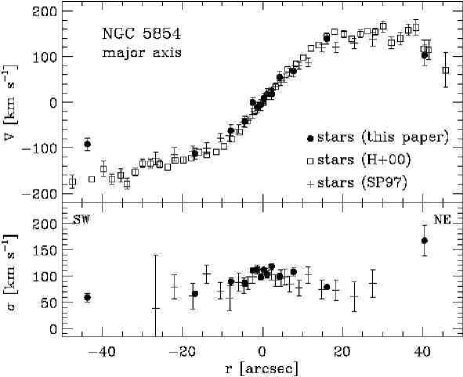
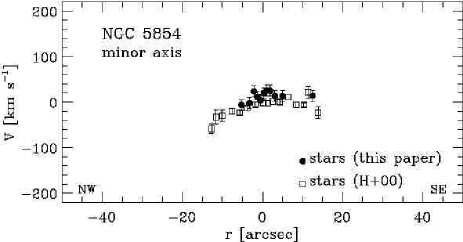
In the second panel we plot the velocity curves of the stellar (filled circles) and gaseous (open circles) components. The velocities are as observed without any inclination correction. Error bars are not plotted when smaller than symbols. The position angle of the slit is specified.
-
3.
In the third panel we plot in radial profiles the velocity dispersion of the stellar (filled circles) and gaseous (open circles) components. Error bars are not plotted when smaller than symbols.
-
4.
In the lower panels we plot the and radial profiles, respectively. and values are not given where the ratio of the spectra was too low to allow a reliable measurement.
A detailed study of the ionized gas and stellar kinematics of NGC 772, NGC 3898 and NGC 7782 is given in Pignatelli et al. (2001). They combined kinematical data with band surface photometry in order to derive the mass distribution via a self-consistent Jeans model. Kinematic data for these galaxies are presented here for sake of completeness.
The kinematic parameters of the nearby galaxies NGC 224 and NGC 3031 have been measured by several authors. We decided to observe these galaxies to perform a consistency check of our measurements with the data available in the literature.
4 Discussion and conclusions
Although only a complete dynamical model can address the question of the mass distribution of a galaxy, it is possible to derive some hints about its structure directly from the analysis of the interplay between the kinematics of its gas and stars. In our sample we can identify two classes of galaxies according to their kinematics, assuming that gas and stars are coplanars:
(i) Galaxies in which ionized gas rotates faster than stars and has a lower velocity dispersion than the stars (i.e., and ): NGC 772, NGC 3200, NGC 3898, NGC 4419, NGC 5064 and NGC 7782. All these galaxies are classified as early-to-intermediate type spirals, except for the Sc NGC 3200. The different kinematic behaviour of the gaseous and stellar components can be easily explained by a model where the gas is confined in the disc and supported by rotation while the stars mostly belong to the bulge and are supported by random motions (i.e. dynamical pressure). In the case of NGC 772 and NGC 7782, this simple hypothesis is confirmed by the self-consistent Jeans models of Pignatelli et al. (2001). In these galaxies the ionized gas is tracing the gravitational equilibrium circular speed. This is not true in the innermost region ( kpc) of NGC 3898, where the ionized gas is rotating more slowly than the circular velocity predicted from dynamical modelling, unveiling a more complex behaviour (see Corsini et al. 1999; Cinzano et al. 1999).
(ii) Galaxies for which and over an extended radial range. This is the case of the intermediate-to-late type spirals NGC 470, NGC 949, NGC 1160, and NGC 2541, NGC 3810, and of the Sab NGC 3705. In these disc-dominated galaxies the motions of the ionized gas and stars are dominated by rotation as we can infer from their low and large .
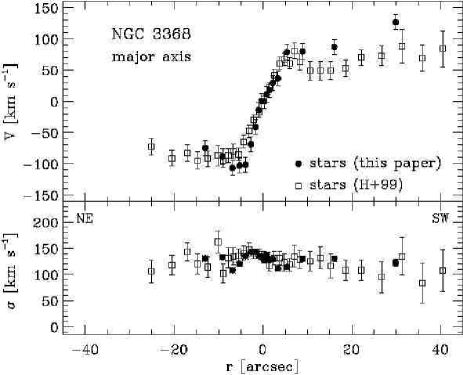
The Sab spiral NGC 3368 has intermediate properties (i.e., and ) between the two classes even though the gas rotation is quite asymmetric. The edge-on S0 NGC 980 has a very peculiar rotation curve with for and elsewhere. These cases can be explained if the gas disc is warped and not aligned with the plane of the stellar disc. Further observations on different position angles are needed to derive a detailed modelling. For NGC 224 and NGC 5854 we have no gas kinematics to perform a comparison with stars.
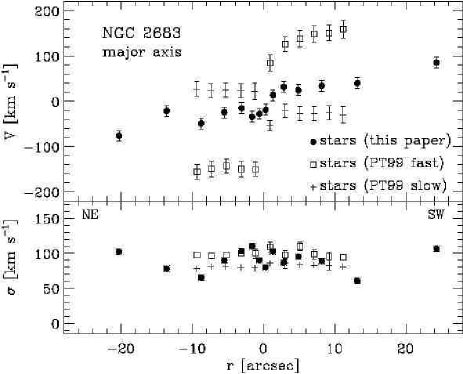
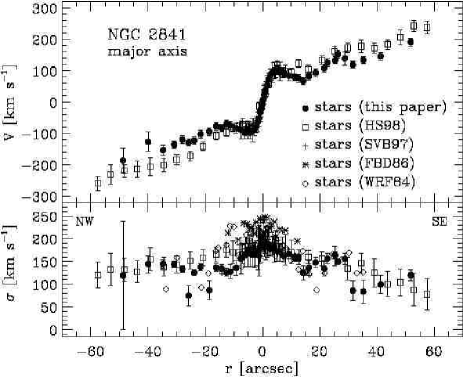
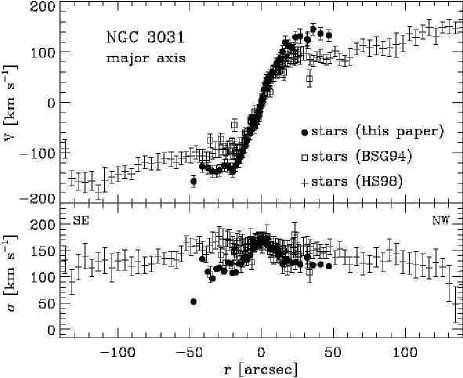
In the remaining galaxies of our sample gas and stellar kinematics suffers from the presence of kinematically decoupled components. Two counter-rotating stellar components have been found by Pompei & Terndrup (1998) in the edge-on Sb NGC 2683. In the nuclear region of NGC 2841 the ionized gas is rotating perpendicularly with respect to the stars and a fraction of bulge stars are counter-rotating with respect to the rest of the galaxy (Sil’Chenko, Vlasyuk & Burenkov 1997). In the centre of NGC 3031 our gaseous kinematic data suggest the presence of a circumnuclear Keplerian disc of ionized gas (e.g. Bertola et al. 1998) which is consistent with the gaseous disc observed by Devereux, Ford & Jacoby (1997) and rotating around a supermassive black hole (Bower et al. 1996). In NGC 7331 the possible presence of a counter-rotating bulge has been discussed by Prada et al. (1996) and ruled out by Bottema (1999).
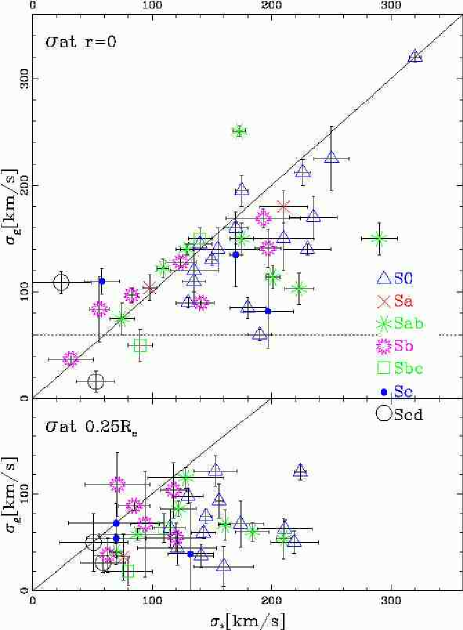
The recent results implying a tight relation of its host spheroids (Ferrarese & Merritt 2000) have made us look for possible relationships between the velocity dispersion of gas and stars. With this aim we compiled data from a sample of about 40 disc galaxies for which the major-axis velocity curve and velocity dispersion profiles of both ionized gas and stars are available, by adding the early-type disc galaxies of Bertola et al. (1995), Fisher (1997), and Corsini et al. (1999) to the spirals of our present sample. Although stellar and/or ionized gas kinematics have been studied in a larger number of S0’s and spirals (e.g. Héraudeau & Simien 1998; Héraudeau et al. 1999) we selected these few authors since only they provide the radial trend of the gas velocity dispersion. For each object we derived the values of and in the centre and at , where is the half-surface brightness radius of the galaxy listed in the RC3 (Fig. 3).
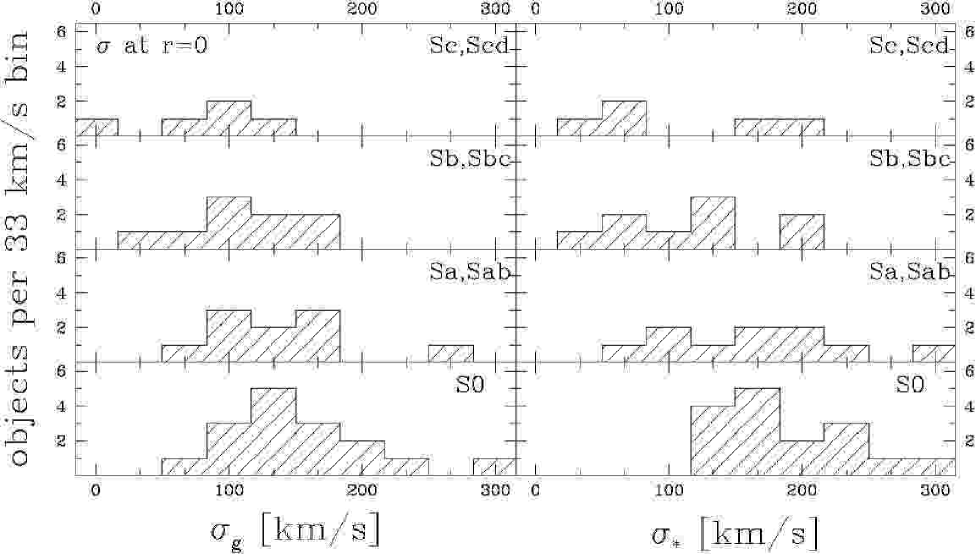
The central values of and seem to be correlated, since galaxies with higher tend to show also higher values of . Moreover and cover the same range of values and can reach values higher than with . However there is no clear dependence on the morphological type as seen in Fig. 4. The high central values of may be partially due to the smearing effect of the seeing, which are more noticeable on the gas kinematics of the early-type disc galaxies on account of their large central velocity gradients (e.g. Rubin et al. 1985). On the other hand, a high central could be also due to intrinsic properties of the galaxy. This is the case of the broad emission lines which are the signature of an unresolved Keplerian velocity field due to a gaseous disc rotating around a supermassive black hole (e.g. Bertola et. 1998; Maciejewski & Binney 2000).
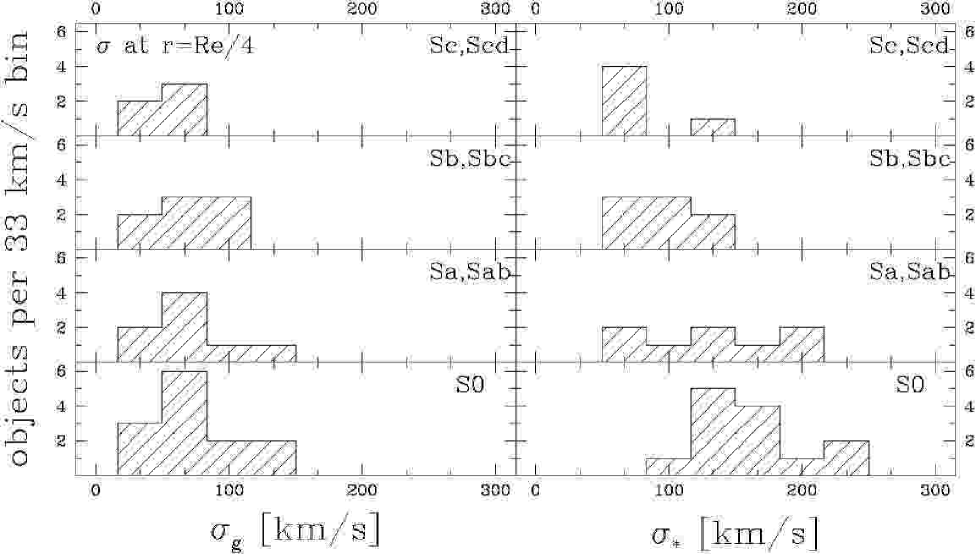
At we find in almost all the objects, while ranges between and . This correlates with the galaxy type as seen in Fig. 5. The low value of indicates that we are observing dynamically cold gas, which is rotating in the disc component. In addition, there are a few S0’s and early-type spirals in which is much higher ( ) than expected from thermal motions or small-scale turbulence. Such a high can not be explained as the result of seeing smearing of velocity gradients since it is measured at a distance which is larger than 5 seeing FWHM’s for all the sample objects. We suggest that the high- galaxies are good candidates to host dynamically hot ionized gas as in the case of the S0 NGC 4036 (Bertola et al. 1995; Cinzano et al. 1999), even if the question whether pressure-supported gas is related to the dynamics of the bulge stars is still open (Pignatelli et al. 2001). The Hubble Type - relation observed at is an indication that at this radius the stellar kinematics of early and late-type disc galaxies dominated by bulge and disc component, respectively. In late-type spirals, which host low or negligible bulges, 50 .
Acknowledgements.
This research was partially based on data from ING archive, and has made use of the Lyon-Meudon Extragalactic Database (LEDA) and of the NASA/IPAC Extragalactic Database (NED). We are grateful to Prof. P.A. Strittmatter, Director of the Steward Observatory and to Dr. G.V. Coyne, S.J., Director of the Vatican Observatory for the allocation of time for our observations. The Multiple Mirror Telescope is a joint facility of the Smithsonian Institution and the University of Arizona. The Vatican Advanced Technology Telescope is the Alice P. Lennon Telescope and the Thomas J. Bannan Astrophysics Facility. WWZ acknowledges support of the Jubiläumsfonds der Oesterreichischen Nationalbank (grant 7914). JEB acknowledges support of the Spanish DGES (grant PB97-0214). JEB, JCVB and WWZ acknowledges the support of this research project in the framework of the Austrian-Spanish Acción Integrada (project No. 20/2000).Appendix A Comparison with literature
In this section we perform a comparison between the gaseous and stellar kinematical data we obtained for the sample galaxies with the velocity curves and velocity dispersion profiles available in literature in order to assess the accuracy and reliability of our measurements. In most cases differences between different authors are due to slit centring and positioning and to the different analysis techniques, or both (see Fisher 1997 for a discussion).
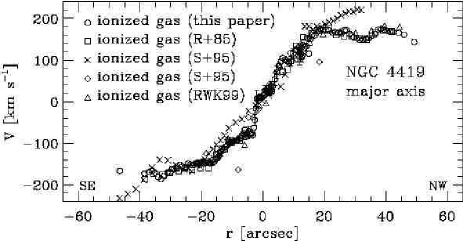
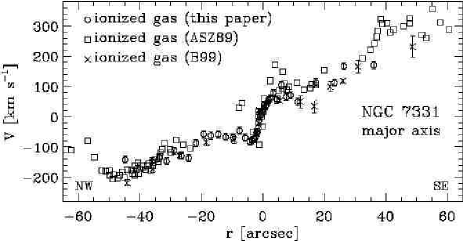
As far as our sample galaxies are concerned, ionized gas velocity curves have been already measured along the major axis of NGC 2683, NGC 3200, NGC 3898, NGC 4419, and NGC 7331. Apart from NGC 3898 presented in Pignatelli et al. (2001) the other cases are discussed here briefly and shown in Fig. 6.
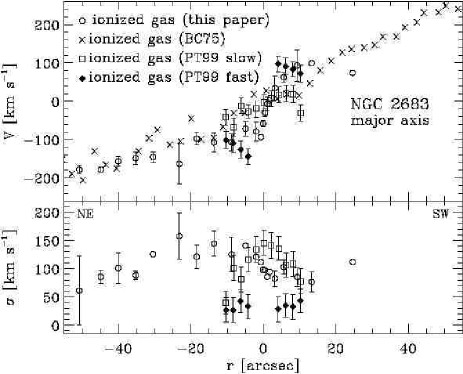
NGC 2683: The complex kinematics of this galaxy has been unveiled by Pompei & Terndrup (1999) who isolated two kinematically distinct gaseous components giving rise to a ‘figure-of-eight’ velocity curve. The fast and the slow-rotating components are unresolved in our spectrum as well as in that of Barbon & Capaccioli (1975). We therefore measured intermediate ’s and higher ’s.
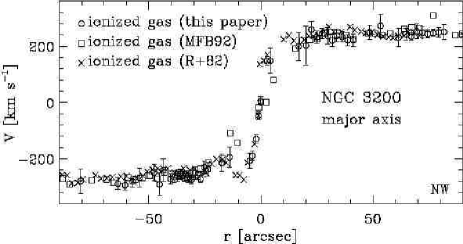
NGC 3200: The agreement between our and that measured by Rubin et al. (1982) is excellent. This is also true for Mathewson et al. (1992) in the outer regions. The shallower central gradient can be explained taking into account for their lower spatial resolution.
NGC 4419: Our data closely matches those obtained by previous authors. This is not the case for only of the rotation curves given by Sperandio et al. (1995). In this case their lower spatial resolution produces the observed shallower central gradient but it can not account for the strong discrepancy we see at large radii on both sides.
NGC 7331: Our ’s matches those by Bottema (1999). A difference in the heliocentric systemic velocity and the different position angle of the slit (P.A.) may explain the shift the curve by Afanas’ev, Sil’Chenko & Zasov (1989).
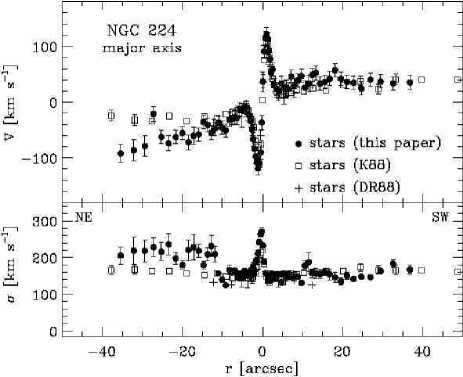
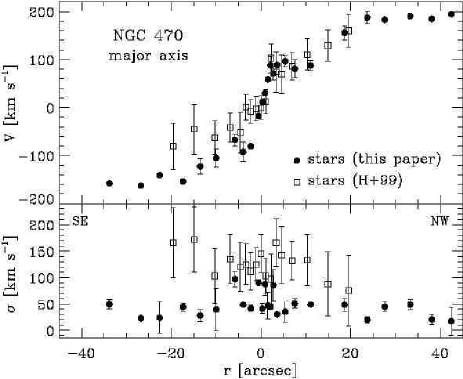
Major-axis stellar kinematics have been previously published for NGC 224, NGC 470, NGC 772, NGC 2683, NGC 2841, NGC 3031, NGC 3368, NGC 3810, NGC 3898, NGC 5854 and NGC 7331. They are compared with our data in Fig. 7 except for the cases of NGC 772 and NGC 3898 which we analyzed in Pignatelli et al. (2001).
NGC 224: The discrepancy observed along the NE axis between our data and those by Kormendy (1988) and by Dressler and Richstone (1988) may be the result of an incorrect sky subtraction in our data. An overestimation of the sky level due to the large size of the galaxy covering all the slit area may produce the higher and shift in we actually measure.
NGC 470: The ’s we measured are consistent with those of Héraudeau et al. (1999) while less satisfactory is the comparison between our and their . In particular their values range between about and , whereas we measured at almost all radii (probably due to a template mismatching effect).
NGC 2683: We do not resolve the counter-rotating stellar components observed by Pompei & Terndrup (1999) because we have no enough spectral resolution and either a good S/N in our spectra.
NGC 2841: In the centre the value we obtained is within the scatter of the other data sets, the same is true for . however further out from the nucleus our and are are somewhat lower than those found in literature.
NGC 3031: We measure the same gradient as Bender, Saglia & Gerhard (1994) and Héraudeau & Simien (1998) in the inner . Further out our continues to increase. The differences between the three sets are as large as – . In the same radial region our agrees with the velocity dispersions by Bender et al. (1994) but are about lower than those by Héraudeau & Simien (1998). measurements do coincide in the centre. These differences in and are due to the different instrumental setup used for the different observations. We used a very spatial resolution, so the velocity gradient we measure is more accurate than that of the other authors. The differences in the values of between our measurements and those obtained by Héraudeau & Simien (1998) are probably due to a template mismatching effect
NGC 3368, NGC 3810 and NGC 5854: Our major-axis kinematics are in good agreement with the literature. This is also true for the we measured along the minor axis of NGC 5854.
NGC 7331: The gradient measured by Héraudeau & Simien (1998) is shallower than that by us and other authors. We suggest it may be due to a different position of the slit. Our radial profile shows a faster decrease and at larger radii it is marginally consistent with that by Bower et al. (1993).
For some of the sample galaxies velocity fields for the cool gaseous component have been obtained using CO molecular lines and/or H I 21-cm line and can be compared to our ionized-gas velocity curves to have some insights into the inner-to-outer gas distribution and motion.
NGC 2541: The H I data by Broeils & van Woerden (1994) show a symmetric outer rotation curve with no particular peculiarities.
NGC 2683: The H I position-velocity diagram by Broeils & van Woerden (1994) shows two kinematically distinct components giving to the diagram a ‘figure-of-eight’ appearance. These components may be associated to the fast and slow-rotating components observed by Pompei & Terndrup (1998) both in the stellar and ionized-gas velocity curves. Figure-of-eight velocity curve have been explained by Kuijken & Merrifield (1995) as due to the presence of a bar (see other examples in Vega Beltrán et al. 1997; Bureau & Freeman 1999).
NGC 2841: Sofue et al. (1999) obtained an extended and well-sampled inner-to-outer rotation curve by combining H, CO and H I observations. Rotation attains a sharp maximum near the centre and flattens outwards and asymmetries seem to be confined in the radial region we observed.
NGC 3031: Sofue (1997) combined different optical and radio data sets to trace gas rotation of this spiral galaxy out to more than . There is no evidence of kinematical decoupling between gas and stars even if our higher-resolution data show that in the inner the gas velocity curve is highly disturbed and less regular than the stellar one.
NGC 3368: The H I and CO velocity fields have been derived by Schneider (1989) and Sakamoto et al. (1999) respectively. The large fraction of H I is distributed outside the optical disk indicating the possible capture of intergalactic gas. On the contrary CO is concentrated towards the inner regions and its asymmetric position-velocity diagram matches our [O III] velocity curve. Gas infall due to the galaxy bar and interactions has been considered by Sakamoto et al. (1999) to explain CO distribution.
NGC 3898: The H I distribution and velocity field have been studied in detail by van Driel & van Woerden (1994). The comparison of these data with our ionized-gas kinematics and the H-imaging by Pignatelli et al. (2001) suggests that both ionized and neutral hydrogen have a regular velocity field and a smooth distribution.
NGC 7331: Sofue (1997) obtained a rotation curve for the gaseous component from CO and H I lines. The global rotation appears normal with no peculiar behaviour. The is no gas component associated to the counter-rotating bulge claimed by Prada et al. (1996).
References
- Afanas’ev, Sil’Chenko & Zasov (1989) Afanas’ev V.L., Sil’Chenko O.K., Zasov A.V., 1989, A&A, 213, L9
- Barbon & Capaccioli (1975) Barbon R., Capaccioli M., 1975, A&A, 42, 221
- Bender (1990) Bender R., 1990, A&A 229, 441
- Bender, Saglia & Gerhard (1994) Bender R., Saglia R.P., Gerhard O.E., 1994, MNRAS 269, 785
- Bertola et al. (1995) Bertola F., Cinzano P., Corsini E.M., Rix H.-W., Zeilinger W.W., 1995, ApJ, 448, L13
- Bertola et al. (1996) Bertola F., Cinzano P., Corsini E.M., Pizzella A., Persic M., Salucci P., 1996, ApJ, 458, L67
- Bertola et al. (1998) Bertola F., Cappellari M., Funes J.G., Corsini E.M., Pizzella A., Vega Beltrán J.C., 1998, ApJ, 509, L93
- Bertola et al. (1999) Bertola F., Corsini E.M., Vega Beltrán J.C., Pizzella A., Sarzi M., Cappellari M., Funes J.G., 1999, ApJ, 519, L127
- Binney & Merrifield (1998) Binney J., Merrifield M., 1998, Galactic Astronomy. Princeton University Press, Princeton
- Bottema (1999) Bottema R., 1999, A&A, 348, 77
- Bower et al. (1993) Bower G.A., Richstone D.O., Bothun G.D., Heckman T.M., 1993, ApJ, 402, 76
- Bower et al. (1996) Bower G.A., Wilson A.S., Heckman T.M., Richstone D.O., 1996, AJ, 111, 1901
- Braun, Walterbos & Kennicutt (1992) Braun R., Walterbos R.A.M., Kennicutt R.C., 1992, Nature, 360, 442
- Broeils & Woerden (1994) roeils, A.H., Van Woerden, H. 1994, A&AS, 107, 129
- Bureau & Freeman (1999) ureau, M. & Freeman, K.C., 1999, AJ, 118, 126
- Chincarini & de Souza (1985) Chincarini G., de Souza R., 1985, A&A, 153, 218
- Cinzano et al. (1999) Cinzano P., Rix H.-W., Sarzi M., Corsini E.M., Zeilinger W.W., Bertola F., 1999, MNRAS, 307, 433
- Ciri, Bettoni & Galletta (1995) Ciri R., Bettoni D., Galletta G., 1995, Nature, 375, 661
- Corsini et al. (1999) Corsini E.M., Pizzella A., Sarzi M., et al., 1999, A&A, 342, 671
- de Vaucouleurs et al. (1991) de Vaucouleurs G., de Vaucouleurs A., Corwin H.G.Jr., et al., 1991, Third Reference Catalogue of Bright Galaxies. Springer-Verlag, New York (RC3)
- Devereux, Ford & Jacoby (1997) Devereux N., Ford H., Jacoby G., 1997, ApJ, 481, L71
- Dressler & Richstone (1988) Dressler A., Richstone D.O., 1988, ApJ, 324, 701
- Emsellem, Bacon, Monnet & Poulain (1996) Emsellem E., Bacon R., Monnet G., Poulain P., 1996, A&A, 312, 777
- Ferrarese & Merritt (2000) Ferrarese L., Merritt D., 2000, ApJ, 539, L9
- Fillmore, Boroson & Dressler (1986) Fillmore J.A., Boroson T.A., Dressler A., 1986, ApJ, 302, 208
- Fisher (1997) Fisher D., 1997, AJ, 113, 950
- Freedman et al. (1994) Freedman, W.L., Madore, B.F., Mould, J.R., et al., 1994, Nature, 371, 757
- Funes (2000) Funes J.G., 2000, Ph.D. Thesis, Università di Padova
- Gebhardt et al. (2000) Gebhardt K., Bender R., Bower G., et al., 2000, ApJ, 539, L13
- Gerssen, Kuijken & Merrifield (1997) Gerssen J., Kuijken K., Merrifield M.R., 1997, MNRAS, 288, 618
- Gerssen, Kuijken & Merrifield (2000) Gerssen J., Kuijken K., Merrifield M.R., 2000, MNRAS, 317, 545
- Guthrie (1992) Guthrie B.N.G., 1992, A&AS 93, 255
- Haynes et al. (2000) Haynes M.P., Jore K.P., Barrett E.A., Broeils A.H., Murray B.M., 2000, AJ, 120, 703
- Héraudeau & Simien (1998) Héraudeau P., Simien F., 1998, A&AS, 133, 317
- Héraudeau et al. (1999) Héraudeau P., Simien F., Maubon G., Prugniel P. 1999, A&AS, 136, 509
- Hoffleit & Jaschek (1982) Hoffleit D., Jaschek C., 1982, The Bright Star Catalogue. Yale University Observatory, New Haven
- Jore, Broeils & Haynes (1996) Jore K.P., Broeils A.H., Haynes M.P., 1996, AJ, 112, 438
- Kannappan & Fabricant (2001) Kannappan S.J., Fabricant D.G., 2001, AJ, 121, 140
- Kauffmann, White & Guiderdoni (1993) Kauffmann G., White S.D.M., Guiderdoni B., 1993, MNRAS, 264, 201
- Kent (1988) Kent S.M., 1988, AJ, 96, 514
- Kormendy (1988) Kormendy J., 1988, ApJ, 325, 128
- Kormendy et al. (1996) Kormendy J., Bender R., Richstone D., et al., 1996a, ApJ, 459, L57
- Kormendy et al. (1996) Kormendy J., Bender R., Ajhar E.A., et al., 1996b, ApJ, 473, L91
- Kuijken & Merrifield (1995) uijken, K., Merrifield, M.R. 1995, ApJ, 443L, 13
- Lauberts (1982) Lauberts, A., 1982, The ESO/Uppsala Survey of the ESO atlas. Garching: European Southern Observatory (ESO), 1982 (ESO/Uppsala) o
- Maciejewski & Binney (2000) Maciejewski W., Binney J., 2000, MNRAS, in press (astro-ph/0010379)
- Marzke et al. (1998) Marzke R.O., da Costa L.N., Pellegrini P.S., Willmer C.N.A., Geller M.J., 1998, ApJ, 503, 617
- Mathewson, Ford & Buchhorn (1992) Mathewson D.S., Ford V.L., Buchhorn M., 1992, ApJS, 81, 413
- Merrifield & Kuijken (1994) Merrifield M.R., Kuijken K., 1994, ApJ, 432, 575
- Nilson (1973) Nilson P., 1973, Uppsala General Catalogue of Galaxies. Royal Society of Sciencies of Uppsala, Uppsala (UGC)
- Pignatelli et al. (2001) Pignatelli E., Corsini E.M., Vega Beltrán J.C., et al., 2001, MNRAS, 323, 188
- Pompei & Terndrup (1999) Pompei E., Terndrup D.M., 1999, In: Merritt D., Sellwood J.A., Valluri M. (eds.) Galaxy Dynamics. ASP Conf. Ser. 182, ASP, San Francisco, p. 221
- Prada et al. (1996) Prada F., Gutierrez C.M., Peletier R.F., McKeith C.D., 1996, ApJ, 463, L9
- Rix, Kennicutt, Braun & Walterbos (1995) Rix H.-W., Kennicutt R.C., Braun R., Walterbos R.A.M., 1995, ApJ, 438, 155
- Rubin (1994) Rubin V.C., 1994, AJ, 107, 173
- Rubin, Kenney & Young (1997) Rubin V.C., Kenney J.D.P., Young J.S., 1997, AJ, 113, 1250
- Rubin, Waterman & Kenney (1999) Rubin V.C., Waterman A.H., Kenney J.D.P., 1999, AJ, 118, 236
- Rubin, Thonnard, Ford & Burstein (1982) Rubin V.C., Thonnard N., Ford W.K., Burstein D., 1982, ApJ, 261, 439
- Rubin et al. (1985) Rubin V.C., Burstein D., Ford W.K., Thonnard N., 1985, ApJ, 289, 81
- Sandage & Tammann (1981) Sandage A., Tammann G.A., 1981, A Revised Shapley-Ames Catalog of Bright Galaxies. Carnegie Institution, Washington
- Sakamoto et al. (1999) akamoto, K., Okamara, K., Ishizuki, S., Scoville, N.Z. 1999, ApJS, 124, 403
- Sarzi et al. (2000) Sarzi M., Corsini E.M., Pizzella A., Vega Beltrán J.C., Cappellari M., Funes J.G., Bertola F., 2000, A&A, 360, 439
- Schneider (1989) chneider S.E., 1989 ApJ 343, 94
- Scorza & van den Bosch (1998) Scorza C., van den Bosch F.C., 1998, MNRAS, 300, 469
- Schweizer (1998) Schweizer F., 1998, In: Kennicutt, R.C.Jr. et al. (eds.) Saas-Fee Advanced Course 26. Galaxies: Interactions and Induced Star Formation. Springer-Verlag, Berlin/Heidelberg, p.105
- Sil’Chenko, Vlasyuk & Burenkov (1997) Sil’Chenko O.K., Vlasyuk V.V., Burenkov A.N., 1997, A&A, 326, 941
- Simien & Prugniel (1997) Simien F., Prugniel P., 1997, A&AS, 126, 15
- Sofue (1997) ofue, Y. 1997, PASJ, 49, 17
- Sperandio et al. (1995) Sperandio M., Chincarini G., Rampazzo R., de Souza R., 1995, A&AS, 110, 279
- van den Bosch, Jaffe & van der Marel (1998) van den Bosch F.C., Jaffe W., van der Marel R.P., 1998, MNRAS, 293, 343
- van den Bosch & Emsellem (1998) van den Bosch F.C., Emsellem E., 1998, MNRAS, 298, 267
- van Driel & Van Woerden (1994) an Driel W., Van Woerden H., 1994 A&A 286, 395
- Vega et al. (1997) ega Beltrán, J.C., Corsini, E. M., Pizzella, A., Bertola, F., 1997, A&A, 324, 485
- Whitmore, Rubin & Ford (1984) Whitmore B.C., Rubin V.C., Ford W.K., 1984, ApJ, 287, 66
- Wozniak et al. (1995) Wozniak, H., Friedli, D., Martinet, L., Martin, P., Bratschi, P., 1995, A&A, 111, 115
| Object | |||||||||||||||||
|---|---|---|---|---|---|---|---|---|---|---|---|---|---|---|---|---|---|
| gas | stars | gas | stars | gas | stars | gas | stars | gas | stars | gas | stars | ||||||
| [name] | [] | [] | [] | [] | [] | [] | |||||||||||
| (1) | (2) | (3) | (4) | (5) | (6) | (7) | (8) | (9) | (10) | (11) | (12) | (13) | |||||
| NGC 224 | — | — | — | — | — | — | — | — | — | 0.006 | |||||||
| NGC 470 | 0.6 | 0.5 | |||||||||||||||
| NGC 772 | 0.2 | 0.1 | |||||||||||||||
| NGC 949 | — | — | — | — | — | — | 0.6 | 0.6 | |||||||||
| NGC 980 | — | — | — | — | — | — | 0.8 | 0.8 | |||||||||
| NGC 1160 | 0.8 | 0.6 | |||||||||||||||
| NGC 2541 | 0.2 | 0.08 | |||||||||||||||
| NGC 2683 | 0.2 | 0.1 | |||||||||||||||
| NGC 2841 | 0.3 | 0.2 | |||||||||||||||
| NGC 3031 | — | — | — | — | — | — | 0.05 | 0.06 | |||||||||
| NGC 3200 | 0.6 | 0.4 | |||||||||||||||
| NGC 3368 | 0.09 | 0.1 | |||||||||||||||
| NGC 3705 | 0.08 | 0.07 | |||||||||||||||
| NGC 3810 | — | 0.08 | 0.06 | ||||||||||||||
| NGC 3898 | 0.7 | 0.2 | |||||||||||||||
| NGC 4419 | 0.5 | 0.5 | |||||||||||||||
| NGC 5064 | 0.1 | 0.6 | |||||||||||||||
| NGC 5854 | — | — | — | — | — | — | 0.5 | ||||||||||
| NGC 7331 | 0.1 | 0.3 | |||||||||||||||
| NGC 7782 | 0.6 | 0.6 | |||||||||||||||
NOTES – Cols.(2-3): central velocity dispersion of ionized gas and stars. Cols.(4-5): velocity dispersion of ionized gas and stars at . Cols.(6-7): central velocity gradient of ionized gas and stars. Cols.(8-9): velocity gradient of ionized gas and stars at . Cols.(10-11): ionized-gas and stellar rotation velocity at obtained from the observed velocity corrected for systemic velocity and inclination given in Tab. 1. Cols.(12-13): Extent of the ionized-gas and stellar kinematic radial profiles obtained in this paper in units of .