The metal-rich nature of stars with planets††thanks: Based on observations collected at the La Silla Observatory, ESO (Chile), with the CORALIE spectrograph at the 1.2-m Euler Swiss telescope, and with the FEROS spectrograph at the 1.52-m ESO telescope (Observing run 66.C-0116 B), and using the UES spectrograph at the 4-m William Hershel Telescope (WHT), at La Palma (Canary Islands).
With the goal of confirming the metallicity “excess” present in stars
with planetary-mass companions, we present in this paper a high-precision
spectroscopic study of a sample of dwarfs included in the CORALIE extrasolar
planet survey. The targets were chosen according to the basic criteria that
1) they formed part of a limited volume and 2) they did not present the
signature of a planetary host companion. A few stars with planets were also
observed and analysed; namely, HD 6434, HD 13445 (Gl 86),
HD 16141, HD 17051 ( Hor),
HD 19994, HD 22049 ( Eri), HD 28185,
HD 38529, HD 52265, HD 190228, HD 210277 and HD 217107. For some of these objects there had been no
previous spectroscopic studies.
The spectroscopic analysis was done using the same technique as in previous
work on the metallicity of stars with planets, thereby permitting a direct
comparison of the results. The work described in this paper thus represents
the first uniform and unbiased comparison between stars with and without
planetary-mass companions in a volume-limited sample. The results show that 1)
stars with planets are significantly metal-rich, and 2) that the source
of the metallicity is most probably “primordial”. The results presented
here may impose serious constraints on planetary system formation and
evolution models.
Key Words.:
stars: abundances – stars: chemically peculiar – planetary systems1 Introduction
One of the most exciting and promising results that became evident after the discovery of the first extrasolar planets is that their host stars seem to be very metal-rich when compared with dwarf stars in the solar neighbourhood (Gonzalez Gon98a (1998); Santos et al. 2000a – hereafter Paper I; Gonzalez et al. Gon01 (2001)). This result, representing the only link between the presence of planets and a stellar photospheric feature, has been given two main explanations. The first, is based on the classical view that giant planets are formed by runaway accretion of gas on to a “planetesimal” having up to 10 Earth masses. In such a case, we can expect that the higher the proportion is of dust to gas in the primordial cloud (i.e. metals), and consequently in the resulting proto-planetary disc, the more rapidly and easily may planetesimals, and subsequently the now observed giant planets be built.
Opposing to this view, it had been proposed that the observed metallicity “excess” may be related to the “pollution” of the convective envelope of the star by the infall of planets and/or planetesimals (e.g., Gonzalez Gon98a (1998); Laughlin & Adams Lau97 (1997); Laughlin Lau00 (2000); Gonzalez et al. Gon01 (2001)). This pollution can be the result of the “complete” inward migration of a planet on to the star, the transfer of material from the disc to the star as a result of the migration process (Goldreich & Tremaine Gol80 (1980); Lin et al. Lin96 (1996)), or to the break-up and infall of a planet(s) on to the surface of the star due to gravitational interactions with other companions (Rasio & Ford Ras96 (1996)). The former point might be particularly important for the short-period systems (Queloz et al. Que00 (2000)).
| Star | [Fe/H] | N(Fe i) | N(Fe ii) | Mass | |||||
|---|---|---|---|---|---|---|---|---|---|
| (K) | (cgs) | (km s-1) | [] | ||||||
| HD 1581 | 5940 | 4.44 | 1.13 | 0.15 | 31 | 7 | 0.04 | 0.05 | 0.990.02 |
| HD 4391 | 5955 | 4.85 | 1.22 | 0.01 | 36 | 5 | 0.05 | 0.09 | 1.220.04 |
| HD 5133 | 5015 | 4.82 | 0.92 | 0.08 | 36 | 6 | 0.05 | 0.07 | 0.810.04 |
| HD 7570 | 6135 | 4.42 | 1.46 | 0.17 | 35 | 7 | 0.04 | 0.06 | 1.190.02 |
| HD 10360 | 5045 | 4.77 | 0.89 | 0.19 | 36 | 5 | 0.04 | 0.04 | 0.700.03 |
| HD 10647 | 6130 | 4.45 | 1.31 | 0.03 | 34 | 7 | 0.03 | 0.05 | 1.140.03 |
| HD 10700 | 5370 | 4.70 | 1.01 | 0.50 | 38 | 6 | 0.04 | 0.04 | 0.680.02 |
| HD 14412 | 5410 | 4.70 | 1.01 | 0.44 | 35 | 6 | 0.04 | 0.01 | 0.780.05 |
| HD 17925 | 5220 | 4.60 | 1.44 | 0.08 | 35 | 6 | 0.07 | 0.04 | 0.920.06 |
| HD 20010 | 6240 | 4.27 | 2.23 | 0.20 | 33 | 6 | 0.05 | 0.08 | 1.330.01 |
| HD 20766 | 5770 | 4.68 | 1.24 | 0.20 | 35 | 7 | 0.04 | 0.04 | 0.970.04 |
| HD 20794 | 5465 | 4.62 | 1.04 | 0.36 | 39 | 7 | 0.05 | 0.05 | 0.740.02 |
| HD 20807 | 5865 | 4.59 | 1.28 | 0.22 | 37 | 7 | 0.04 | 0.04 | 0.950.02 |
| HD 23249 | 5135 | 4.00 | 1.12 | 0.17 | 36 | 7 | 0.06 | 0.08 | 0.840.01 |
| HD 23356 | 5035 | 4.73 | 0.96 | 0.05 | 36 | 6 | 0.06 | 0.07 | 0.830.03 |
| HD 23484 | 5230 | 4.62 | 1.13 | 0.10 | 37 | 6 | 0.05 | 0.07 | 0.920.06 |
| HD 26965A | 5185 | 4.73 | 0.75 | 0.26 | 37 | 5 | 0.05 | 0.03 | 0.710.02 |
| HD 30495 | 5880 | 4.67 | 1.29 | 0.03 | 37 | 7 | 0.04 | 0.03 | 1.110.04 |
| HD 36435 | 5510 | 4.78 | 1.15 | 0.03 | 37 | 6 | 0.06 | 0.03 | 1.040.05 |
| HD 38858 | 5750 | 4.56 | 1.22 | 0.22 | 36 | 7 | 0.04 | 0.02 | 0.910.02 |
| HD 39091 | 5995 | 4.48 | 1.30 | 0.09 | 37 | 7 | 0.04 | 0.04 | 1.100.02 |
| HD 40307 | 4925 | 4.57 | 0.79 | 0.25 | 37 | 4 | 0.06 | 0.10 | 0.760.07 |
| HD 43162 | 5630 | 4.57 | 1.36 | 0.02 | 35 | 7 | 0.05 | 0.04 | 0.990.04 |
| HD 43834 | 5620 | 4.56 | 1.10 | 0.12 | 38 | 7 | 0.05 | 0.05 | 0.960.02 |
| HD 50281A | 4790 | 4.75 | 0.85 | 0.07 | 31 | 4 | 0.05 | 0.12 | 0.790.01 |
| HD 53705 | 5810 | 4.40 | 1.18 | 0.19 | 36 | 7 | 0.03 | 0.03 | 0.920.01 |
| HD 53706 | 5315 | 4.50 | 0.90 | 0.22 | 36 | 7 | 0.05 | 0.08 | 0.880.05 |
| HD 65907A | 5940 | 4.56 | 1.19 | 0.29 | 39 | 7 | 0.04 | 0.04 | 0.940.01 |
| HD 69830 | 5455 | 4.56 | 0.98 | 0.00 | 38 | 7 | 0.05 | 0.03 | 0.890.06 |
| HD 72673 | 5290 | 4.68 | 0.81 | 0.33 | 38 | 6 | 0.04 | 0.04 | 0.780.06 |
| HD 74576 | 5080 | 4.86 | 1.20 | 0.04 | 36 | 5 | 0.06 | 0.05 | 0.910.04 |
| HD 76151 | 5825 | 4.62 | 1.08 | 0.15 | 38 | 7 | 0.03 | 0.04 | 1.090.04 |
| HD 84117 | 6140 | 4.35 | 1.38 | 0.04 | 34 | 7 | 0.04 | 0.06 | 1.140.01 |
| HD 189567 | 5750 | 4.57 | 1.21 | 0.23 | 37 | 7 | 0.04 | 0.05 | 0.890.01 |
| HD 191408A | 5025 | 4.62 | 0.74 | 0.51 | 37 | 4 | 0.06 | 0.09 | 0.610.04 |
| HD 192310 | 5125 | 4.63 | 0.88 | 0.05 | 36 | 6 | 0.06 | 0.08 | 0.780.04 |
| HD 196761 | 5460 | 4.62 | 1.00 | 0.27 | 38 | 7 | 0.05 | 0.05 | 0.810.03 |
| HD 207129 | 5910 | 4.53 | 1.21 | 0.01 | 36 | 7 | 0.04 | 0.03 | 1.030.02 |
| HD 209100 | 4700 | 4.68 | 0.60 | 0.01 | 34 | 3 | 0.07 | 0.06 | 0.640.09 |
| HD 211415 | 5925 | 4.65 | 1.27 | 0.16 | 35 | 7 | 0.03 | 0.04 | 0.990.02 |
| HD 216803 | 4647 | 4.88 | 0.90 | 0.07 | 28 | 3 | 0.07 | 0.08 | 0.77+0.01-0.18 |
| HD 222237 | 4770 | 4.79 | 0.35 | 0.22 | 37 | 3 | 0.08 | 0.08 | – |
| HD 222335 | 5310 | 4.64 | 0.97 | 0.10 | 33 | 5 | 0.05 | 0.04 | 0.860.05 |
| Star | [Fe/H] | Instrument | Mass | Planet | |||
| (k) | (cgs) | (km s-1) | [] | discovery paper | |||
| HD 1237 | 555550 | 4.650.15 | 1.500.08 | 0.110.08 | CORALIE | 1.010.04 | Naef et al. (2001a ) |
| HD 6434 | 579040 | 4.560.20 | 1.400.10 | 0.550.07 | FEROS | 0.790.01 | Queloz et al. (Que01 (2001)) |
| HD 13445 | 519040 | 4.710.10 | 0.780.10 | 0.200.06 | CORALIE | ||
| HD 13445 | 522040 | 4.700.10 | 0.850.07 | 0.190.06 | FEROS | ||
| HD 13445 (avg) | 5205 | 4.70 | 0.82 | 0.20 | – | 0.750.04 | Queloz et al. (Que00 (2000)) |
| HD 16141 | 580540 | 4.280.10 | 1.370.09 | 0.150.05 | FEROS | 1.060.01 | Marcy et al. (Mar00 (2000)) |
| HD 17051 | 622550 | 4.650.15 | 1.200.08 | 0.250.06 | FEROS | 1.260.02 | Kürster et al. (Kur00 (2000)) |
| HD 19994 | 616540 | 4.130.20 | 1.490.10 | 0.230.06 | CORALIE | ||
| HD 19994 | 625040 | 4.270.10 | 1.560.08 | 0.300.06 | FEROS | ||
| HD 19994 (avg) | 6210 | 4.20 | 1.52 | 0.26 | – | 1.340.01 | Queloz et al. (Que01 (2001)) |
| HD 22049 | 513540 | 4.700.10 | 1.140.07 | 0.070.06 | CORALIE | 0.850.04 | Hatzes et al. (Hat00 (2000)) |
| HD 28185 | 570540 | 4.590.10 | 1.090.06 | 0.240.05 | CORALIE | 0.980.07 | Mayor et al. (2001b ) |
| HD 38529 | 567540 | 4.010.15 | 1.390.09 | 0.390.06 | FEROS | 1.520.05 | Fisher et al. (Fis00 (2000)) |
| HD 52265 | 607540 | 4.210.10 | 1.310.07 | 0.220.07 | CORALIE | ||
| HD 52265 | 612050 | 4.370.20 | 1.310.06 | 0.250.06 | FEROS | ||
| HD 52265 (avg) | 6100 | 4.29 | 1.31 | 0.24 | – | 1.180.01 | Naef et al. (2001a ) |
| Butler et al. (But00 (2000)) | |||||||
| HD 75289 | 613540 | 4.430.20 | 1.500.07 | 0.270.06 | CORALIE | 1.200.02 | Udry et al. (Udr00 (2000)) |
| HD 82943 | 602540 | 4.540.10 | 1.100.07 | 0.330.06 | CORALIE | 1.150.05 | Naef et al. (2001a ) |
| HD 83443 | 550060 | 4.500.20 | 1.120.09 | 0.390.09 | CORALIE | 0.900.05 | Mayor et al. (2001a ) |
| HD 108147 | 626540 | 4.590.15 | 1.400.08 | 0.200.06 | CORALIE | 1.270.02 | Pepe et al. (in prep.) |
| HD 121504 | 609040 | 4.730.10 | 1.350.08 | 0.170.06 | CORALIE | 1.190.03 | Queloz et al. (Que01 (2001)) |
| HD 162020bd | 483080 | 4.760.25 | 0.720.12 | 0.010.11 | CORALIE | – | Udry et al. (in prep.) |
| HD 168746 | 561030 | 4.500.15 | 1.020.08 | 0.060.05 | CORALIE | 0.880.01 | Pepe et al. (in prep.) |
| HD 169830 | 630030 | 4.040.20 | 1.370.07 | 0.220.05 | CORALIE | 1.420.01 | Naef et al. (2001a ) |
| HD 190228 | 536040 | 4.020.10 | 1.120.08 | 0.240.06 | WHT | 0.840.01 | Sivan et al. (Siv01 (2001)) |
| HD 202206bd | 576540 | 4.750.20 | 0.990.09 | 0.370.07 | CORALIE | 1.020.02 | Udry et al. (in prep.) |
| HD 210277 | 557530 | 4.440.10 | 1.120.08 | 0.230.05 | FEROS | 0.940.01 | Marcy et al. (Mar99 (1999)) |
| HD 217107 | 566050 | 4.430.10 | 1.040.07 | 0.400.06 | CORALIE | ||
| HD 217107 | 565540 | 4.420.05 | 1.110.08 | 0.380.05 | FEROS | ||
| HD 217107(avg) | 5660 | 4.42 | 1.01 | 0.39 | – | 0.970.05 | Fischer et al. (Fis98 (1999)) |
The idea that planets and/or planetary material might be engulfed by a star is to some extent supported by the recent detection of 6Li in the planet host star HD 82943 (Israelian et al. Isr01 (2001)) – interpreted as a signal of the accretion of a planet during the history of the star – and probably by the detection of a significant difference in iron abundances in the very similar pair of dwarfs 16 Cyg A and 16 Cyg B, which also have very different Li contents (Laws & Gonzalez Law01 (2001); Gonzalez Gon98a (1998)).
Besides the [Fe/H] differences, there is currently some debate about possible anomalies concerning other elements (Paper I; Gonzalez et al. Gon01 (2001); Smith et al. Smi01 (2001)). But the relatively low number of exoplanets known, and possible systematics with respect to the samples do not permit firm conclusions to be reached on the subject.
The observation that stars with planets111Here we are referring to the known extrasolar planetary host stars, having Jupiter-like planets in relatively short period orbits when compared to the giant planets in our own Solar System. are particularly metal-rich has so far been overshadowed by the restriction that in order to compare the metallicities of stars hosting planets with those of stars “without” planets, authors had access only to published metallicity studies of volume-limited samples of dwarfs in the solar neighbourhood (mainly that of Favata et al. (Fav97 (1997)), the alternative being to construct a sample using less precise metallicities using photometric indices). This is inconvenient for a number of reasons. First and most obviously, one cannot be sure if the sample used for comparison is really free from giant planets. Furthermore, the metallicities for the Favata et al. sample were determined using a much shorter line list for iron and different sources of atmospheric parameters (spectroscopic vs. colours) – see Paper I. This particular point may introduce systematic errors, and one might expect that the difference between the two samples was simply due to a bias related to the method used to compute the metallicities.
| Star | [Fe/H] | Mass | Reference | Planet | |||
|---|---|---|---|---|---|---|---|
| (k) | (cgs) | (km s-1) | [] | for spectroscopy | discovery paper | ||
| HD 9826 | 6140 | 4.12 | 1.35 | 0.12 | 1.280.02 | Gonzalez & Laws (Gon00 (2000)) | Butler et al. (But97 (1997)) |
| HD 10697 | 5605 | 3.96 | 0.95 | 0.16 | 1.100.01 | Gonzalez et al. (Gon01 (2001)) | Vogt et al. (Vog00 (2000)) |
| HD 12661 | 5714 | 4.45 | 0.99 | 0.35 | 1.010.02 | Gonzalez et al. (Gon01 (2001)) | Fisher et al. (Fis00 (2000)) |
| HD 37124 | 5532 | 4.56 | 0.85 | 0.41 | – | Gonzalez et al. (Gon01 (2001)) | Vogt et al. (Vog00 (2000)) |
| HD 46375 | 5250 | 4.44 | 0.80 | 0.21 | – | Gonzalez et al. (Gon01 (2001)) | Marcy et al. (Mar00 (2000)) |
| HD 75732A | 5250 | 4.40 | 0.80 | 0.45 | 1.050.03 | Gonzalez & Vanture (Gon98b (1998)) | Butler et al. (But97 (1997)) |
| HD 80606 | 5645 | 4.50 | 0.81 | 0.43 | 1.1 | Naef et al. (2001b ) | Naef et al. (2001b ) |
| HD 89744 | 6338 | 4.17 | 1.55 | 0.30 | 1.550.03 | Gonzalez et al. (Gon01 (2001)) | Korzennik et al. (Kor00 (2000)) |
| HD 92788 | 5775 | 4.45 | 1.00 | 0.31 | 1.050.02 | Gonzalez et al. (Gon01 (2001)) | Queloz et al. (Que01 (2001)) |
| Fisher et al. (Fis00 (2000)) | |||||||
| HD 95128 | 5800 | 4.25 | 1.0 | 0.01 | 1.030.03 | Gonzalez (Gon98a (1998)) | Butler & Marcy (But96 (1996)) |
| HD 114762bd | 5950 | 4.45 | 1.0 | 0.60 | 0.820.03 | Gonzalez (Gon98a (1998)) | Latham et al. (Lat89 (1989)) |
| HD 117176 | 5500 | 3.90 | 1.0 | 0.03 | 1.100.02 | Gonzalez (Gon98a (1998)) | Marcy & Butler Mar96 (1996)) |
| HD 120136 | 6420 | 4.18 | 1.25 | 0.32 | 1.340.02 | Gonzalez & Laws (Gon00 (2000)) | Butler et al. (But97 (1997)) |
| HD 130322 | 5410 | 4.47 | 0.95 | 0.05 | 0.89 | Gonzalez et al. (Gon01 (2001)) | Udry et al. (Udr00 (2000)) |
| HD 134987 | 5715 | 4.33 | 1.00 | 0.32 | 1.02+0.07-0.03 | Gonzalez et al. (Gon01 (2001)) | Vogt et al. (Vog00 (2000)) |
| HD 143761 | 5750 | 4.10 | 1.2 | 0.29 | 0.960.03 | Gonzalez (Gon98a (1998)) | Noyes et al. (Noy97 (1997)) |
| HD 145675 | 5300 | 4.27 | 0.80 | 0.50 | 1.05 | Gonzalez et al. (Gon99 (1999)) | Udry et al (Udr01 (2001)) |
| HD 168443 | 5555 | 4.10 | 0.90 | 0.10 | 1.010.02 | Gonzalez et al. (Gon01 (2001)) | Marcy et al. (Mar99 (1999)) |
| Udry et al. (Udr01 (2001)) | |||||||
| HD 177830 | 4818 | 3.32 | 0.97 | 0.36 | 1.030.11 | Gonzalez et al. (Gon01 (2001)) | Vogt et al. (Vog00 (2000)) |
| HD 186427 | 5685 | 4.26 | 0.80 | 0.07 | 0.970.03 | Laws & Gonzalez (Law01 (2001)) | Cochran et al. (Coc97 (1997)) |
| HD 187123 | 5830 | 4.40 | 1.00 | 0.16 | 1.080.04 | Gonzalez et al. (Gon99 (1999)) | Butler et al (But98 (1998)) |
| HD 192263 | 4964 | 4.49 | 0.95 | 0.03 | 0.80 | Gonzalez et al. (Gon01 (2001)) | Santos et al. (2000b ) |
| Vogt et al. (Vog00 (2000)) | |||||||
| HD 209458 | 6063 | 4.38 | 1.02 | 0.04 | 1.120.02 | Gonzalez et al. (Gon01 (2001)) | Mazeh et al. (Mah00 (2000)) |
| Henry et al. (Hen00 (2000)) | |||||||
| HD 217014 | 5795 | 4.41 | 1.05 | 0.21 | 1.070.01 | Gonzalez et al. (Gon01 (2001)) | Mayor & Queloz (May95 (1995)) |
| HD 222582 | 5735 | 4.26 | 0.95 | 0.02 | 0.950.01 | Gonzalez et al. (Gon01 (2001)) | Vogt et al. (Vog00 (2000)) |
With the goal of settling the question about the high metallicity content of stars with planets, we present here a spectroscopic study of a volume-limited sample of 43 stars included in the CORALIE (Udry et al. Udr00 (2000)) planet search programme, and for which the radial velocities seem to be constant over a large time interval. The technique used, line lists and atmospheric models were those usually applied by most authors working on the metallicities of stars with planets (e.g. Paper I; Gonzalez et al. Gon01 (2001)). We show that the currently known stars with giant planets are on average more metal-rich than “field stars”, for which there is no radial-velocity signature of planets. Furthermore, the results are used to set strong constraints on the cause of the observed “anomaly”, significantly excluding the “pollution” scenario. The impact on the planetary formation and evolutionary models is discussed.
2 The data
2.1 The samples
As mentioned above, the choice of a “comparison sample” (as we shall call it from now on), free from giant planets and with the minimum bias possible, is of crucial importance. In order to be sure that we are not including any systematics when selecting the sample, we have taken all stars within the CORALIE sample (defined as volume-limited – Udry et al. Udr00 (2000)) having right ascensions between 20h and 9h (observable in mid November from La Silla). Since such a sample corresponds to more than half of the 1600 stars searched for planets, it is virtually impossible to make a precise spectroscopic analysis for all those stars in a reasonable amount time. We thus decided as a first step to limit our observations to all stars within 17 pc of the Sun having (determined from Hipparcos data – ESA ESA97 (1997)), and within 20 pc with . This sample includes about 50 stars, most of which were observed. Some of the stars in this sample have known planetary systems, namely HD 1237, HD 13445, HD 17051, HD 22049, HD 28185 and HD 217107 (HD 192263, would also have been included if we had not imposed any limit on ). All these objects were excluded from our final sample (43 objects) presented in Table 1.
In what concerns the stars with planets, all known objects having precise spectroscopic iron abundance determinations using a similar technique were used. This excludes Gl 876 (Delfosse et al. Del98 (1998); Marcy et al. Mar98 (1998)), HD 195019 (Fischer et al. Fis98 (1999)) and the recently announced planets around HD 160691, HD 27442 and HD 179949 (Tinney et al. Tyn01 (2001); Butler et al. But01 (2001)). Also, from the set of 9 new planet host stars recently announced by the Geneva group (Mayor et al. 2001b ) only two had available data (HD 28185 and HD 80606). The only exception was made respecting BD$-$10 3166, which was included in the planet surveys for its high [Fe/H] (Gonzalez et al. Gon99 (1999)). All the other stars were part of search programmes for planets in volume-limited samples (Udry et al. Udr00 (2000); Marcy et al. Mar00 (2000)), and there is no particular reason to take out any of the targets (possible sources of bias are discussed below).
2.2 Observations and data reduction
For the “comparison sample”, spectra of S/N between 150 and 350 were obtained using the CORALIE high-resolution spectrograph ( 50 000), at the Swiss 1.2-m Euler Swiss Telescope (La Silla, Chile) in 2000 mid November. The spectra were reduced using IRAF222IRAF is distributed by National Optical Astronomy Observatories, operated by the Association of Universities for Research in Astronomy, Inc., under contract with the National Science Foundation, U.S.A. tools, and the equivalent widths were measured by fitting a Gaussian function to each of the lines using the “k” key within splot.
Some planet host stars were also observed with CORALIE (adding a few objects to the study presented in Paper I), some of them with no previous spectroscopic abundance determinations (see Table 2). Observations of some stars with planets were also complemented with spectra of S/N 300 taken with the FEROS spectrograph ( 48 000), at the ESO 1.52 m Telescope (La Silla), during the nights of 2000 November 8 and 9. The UES spectrograph ( 55 000) at the 4 m WHT (La Palma, Canary Islands) was also used to obtain a spectrum for the planet host star HD 190228.
2.3 Spectroscopic analysis
The technique used has already been described extensively in Paper I. Abundances and atmospheric parameters were determined using a standard local thermodynamic equilibrium (LTE) analysis with a revised version of the line abundance code MOOG (Sneden Sne73 (1973)), and a grid of Kurucz (Kur93 (1993)) ATLAS9 atmospheres. As in Paper I, we used a set of iron lines taken from the list of Gonzalez & Laws (Gon00 (2000)). Here, we added one more Fe ii line (the 5991Å presented in Gonzalez et al. Gon01 (2001)) and we excluded the previously used Fe ii line at 6432Å line, because it was giving systematically low values for most stars.
The atmospheric parameters were obtained from the Fe i and Fe ii lines by iterating until the correlation coefficients between (Fe i) and , and between (Fe i) and were zero, and the mean abundance given by Fe i and Fe ii lines were the same. This procedure gives very good results since the set of Fe i lines has a very wide range of excitation potentials. We used (Fe) = 7.47.
The complete results obtained for the comparison sample are presented in Table 1. The errors in , , and [Fe/H] for a typical measure are of the order of 50 K, 0.15 dex, 0.10 dex, and 0.06 dex respectively. The number of lines used for each star, and the dispersions for Fe i and Fe ii lines are also tabulated. The masses were determined from theoretical isochrones of Schaller et al. (Sch92 (1992)), Schaerer et al. (Schae92 (1992)) and Schaerer et al. (Sch93 (1993)), using computed from Hipparcos parallaxes and obtained from spectroscopy333The errors in mass represent simply formal errors, computed using the uncertainties in and MV.. Only for HD 222237 we do not present a mass, given the high error in its determination.
In Table 2 we present our results of the spectroscopic analysis for stars with low mass companions for which we have obtained spectra. Also included are the objects already presented in Paper I and Santos et al. (San01 (2001)), since the values were revised; the differences are always perfectly within the uncertainties (usually lower than 0.02 dex for [Fe/H]). Errors in the parameters were computed as described in Paper I.
For a few stars in our sample we had both CORALIE and FEROS spectra. No important systematics are evident in the results from the two spectrographs (due to errors in flatfields or background subtraction), and we simply used a mean value of the results.
We compared our [Fe/H] determinations for the eight stars presented in this paper in common with the studies of Gonzalez et al. (Gon99 (1999)), Gonzalez & Laws (Gon00 (2000)), and Gonzalez et al. (Gon01 (2001)) to look for any possible systematics. The stars and [Fe/H] obtained by these authors are HD 1237 (0.16), HD 16141 (0.15), HD 17051 (0.19), HD 38529 (0.37), HD 52265 (0.27), HD 75289 (0.28), HD 210277 (0.24) and HD 217107 (0.36). The comparison shows that the formal mean difference in [Fe/H] obtained by these authors and from the present work is virtually 0.00 dex; the rms of the differences is 0.01 dex. The atmospheric parameters for these stars are also usually the same within the errors. We thus conclude that we can include their determinations for stars with planets in our analysis (as expected since our studies were similar in all aspects to theirs) without introducing any systematics, thus increasing the number of available planetary host candidates used in the current study. The list of stars with planets whose determinations were made by other authors is presented in Table 3.
3 The metallicity distributions
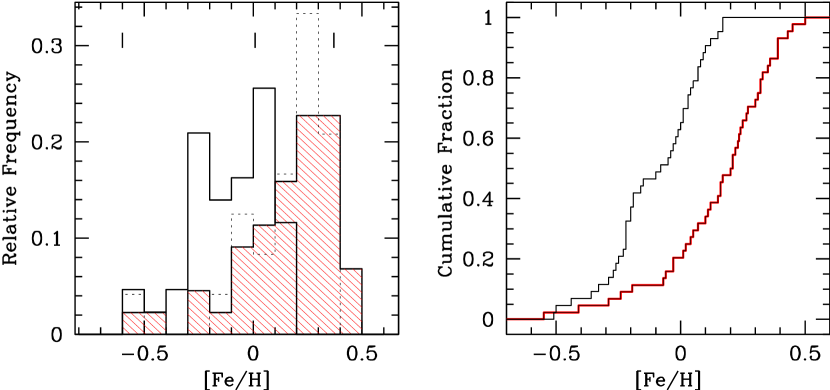
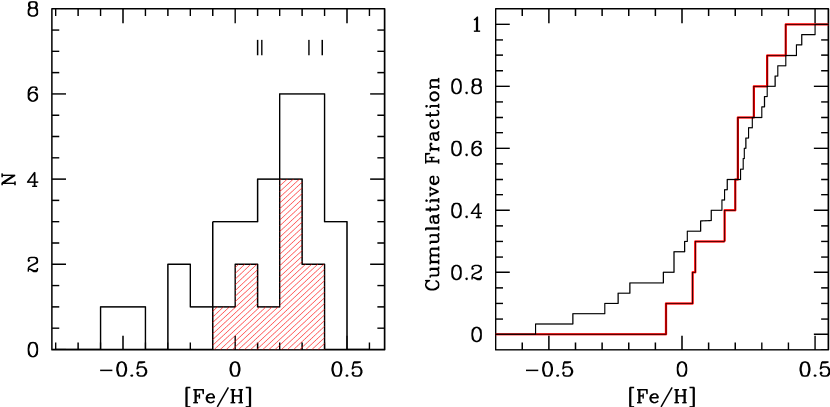
In Fig. 1 we present the [Fe/H] distributions of both samples described above. For the stars with planets we included both the objects presented in Tables 2 and 3. As is clear from the plot, stars with planets are significantly more metal rich than field stars without giant planet companions. While the stars-with-planets sample has a mean metallicity of 0.15 0.23 the mean [Fe/H] for the field star sample is 0.10 0.18 (here the errors represent the rms around the mean [Fe/H]). A Kolmogorov–Smirnov test (Fig. 1, right) shows that the probability that both samples belong to the same population is about 10-7.
At this point it is important to discuss possible sources of bias. Is the star-with-planet sample completely unbiased? If we make the same plot using only the stars forming part of the CORALIE sample444These include HD 1237, HD 6434, HD 13445, HD 16141, HD 17051, HD 19994, HD 22049, HD 28185, HD 52265, HD 75289, HD 82943, HD 83443, HD 92788, HD 108147, HD 121504, HD 130322, HD 134987, HD 168443, HD 168746, HD 169830, HD 192263, HD 210277, HD 217107 and HD 222582. (from which the comparison stars were taken), the result is exactly the same (dotted histogram in Fig. 1): the same general shape and difference is found. In fact, this result cannot be related to a selection bias since, as discussed above, the most important planet search programmes make use of volume-limited samples of stars. The only exception is BD$-$10 3166 (Butler et al. But00 (2000)), chosen for its high metallicity. This star was not included in our analysis. It is worthy of note that the six planet-host stars that were included in our volume-limited sample (HD 1237, HD 13445, HD 17051, HD 22049, HD 28185 and HD 217107) have a mean [Fe/H] of 0.12.
No important systematics are expected concerning the magnitudes of the objects. On the one hand, for a given colour higher [Fe/H] stars are more luminous. Also, higher metallicity implies more and deeper lines, and thus a more precise determination of the velocity. But a star with more metals is also, for a given mass, cooler and fainter. For example, doubling the metallicity of the Sun (i.e. increasing [Fe/H] to 0.30) would make its temperature decrease by more than 150 K, and its luminosity by a factor of 1.2 (Schaller et al. Sch92 (1992); Schaerer et al. Sch93 (1993)). As we shall see below, for the mass intervals for which we have a good representation of both samples, stars with planets are always significantly more metal-rich. Furthermore, at least in the CORALIE survey, exposure times are computed in order to have a photon-noise error at least as low as the instrumental errors.
Given the uniformity of the study, we may conclude that the plot in Fig. 1 represents a proof that the stars now observed with giant planets are, on average, more metal-rich than field stars. For the record, it is also interesting to verify that the mean value of [Fe/H] obtained by Favata et al. (Fav97 (1997)) for their volume-limited sample of G-dwarfs is 0.12, which means that there are almost no systematics between the method used by these authors and that used for the current study.
Also remarkable in Fig. 1 is the interesting position of the three low-mass (10 MJupM 20 MJup) brown-dwarf candidates. Although it is too early to arrive at any firm conclusions, the position of one of them (HD202206), with [Fe/H] = 0.37 is strongly suggestive of a common origin with the lower-mass planets. On the opposite side of the distribution there is HD 114762 ([Fe/H] = 0.60), the most metal-poor object among all those studied in this paper. This “dispersion” might be interpreted as a sign that the frontier between brown dwarfs and massive giant planets is very tenuous (and probably overlaps) with regard to the mass limit; we are possibly looking at results of different formation processes (e.g. Boss Bos00 (2000)).
4 How to explain it?
The problem concerning the significance of the high-metallicity trend observed for stars with planets being “solved”, our enquiry is turned to the cause of these differences and to the implications this result might have for planetary system formation and evolution scenarios.
4.1 Comparing the distributions
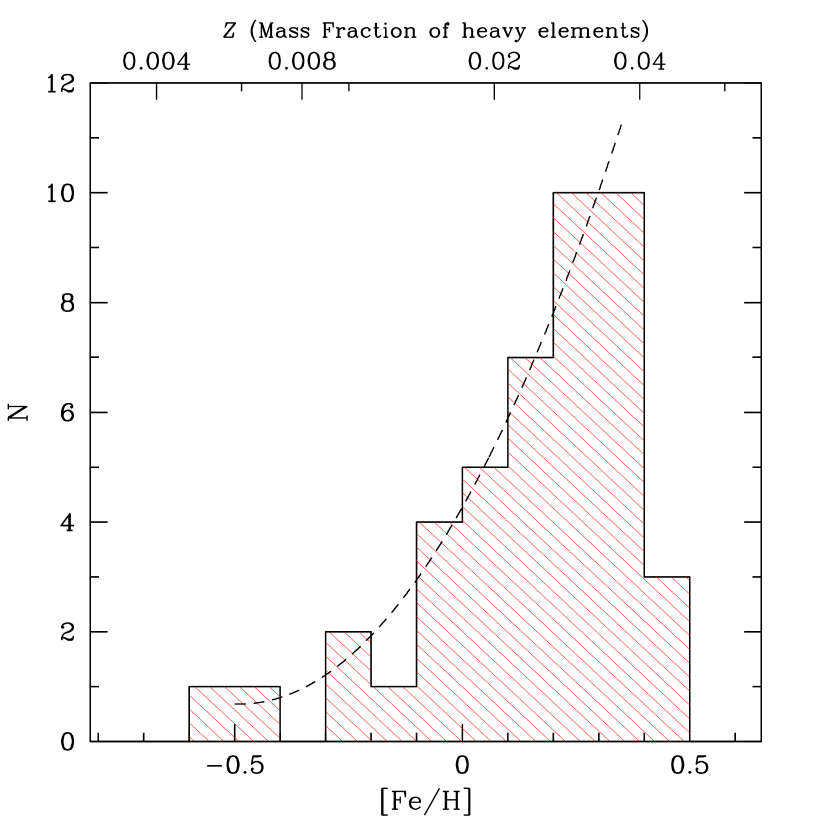
One very interesting feature of the distribution of stars with planets is well illustrated in Fig. 2. The shape of this distribution is well described by a quadratic rising with [Fe/H] (up to [Fe/H] 0.35 – dashed curve in the diagram). In other words, the distribution is rising with (the mass fraction of heavy elements) up to a value of 0.04, falling then abruptly. This sharp cut-off in the distribution of stars with planets is probably due to the fact that we may be looking at a limit on the metallicity of the stars in the solar neighbourhood.
Clearly, the rise is expected if we consider that the probability of forming planets is proportional to the metallicity content. In one sense, an increase in the number of dust particles () in the young disc will increase the probability of a shock by . The rate of formation of planetesimals, and thus the probability of creating a planet core with sufficient mass to accrete gas from the disc before it disappears, will increase quadratically with (considering that there is a linear relation between these two variables).
But this model is probably too simple. Other, more complicated mechanisms intervene, however, such as the fact that an increase in [Fe/H] will also probably increase the opacity of the disc, changing its physical conditions (e.g. Schmidt et al. Sch97 (1997)), such as the accretion rate or its vertical structure. The current result may be used in exactly this way in constraining these mechanisms.
On the other hand, the distribution of [Fe/H] in a volume-limited sample of stars (with and without planet hosts) apparently decreases with increasing [Fe/H] for [Fe/H] 0.0 (e.g. Favata et al. Fav97 (1997)). Taking this effect into account would result in an even steeper rise of the relative frequency of stars with planets with the metallicity.
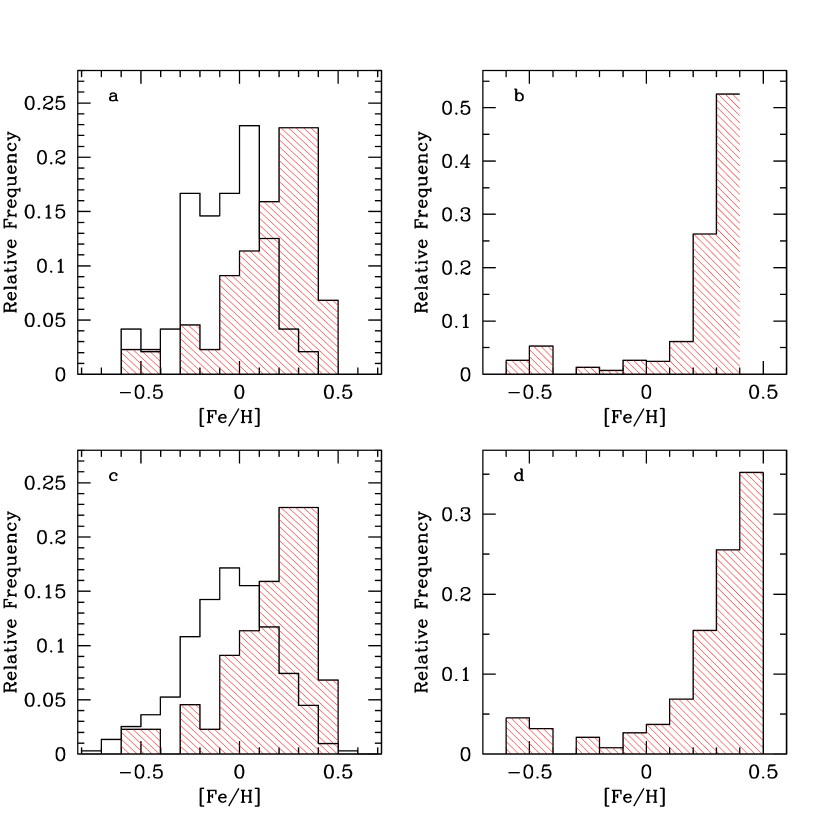
This is exactly what we can see from Fig. 3. In panels (a) and (c) we present a comparison between the [Fe/H] distribution of stars with planets (shaded bars) and the same distribution for two volume-limited samples of dwarfs (empty bars). The volume-limited distribution in panel (a) was taken from this paper (objects presented in Table 1 plus the six stars with planets making part of our volume limited sample – see Sect. 2.1 for details). For panel (c), the distribution represents the metallicities of about 1000 stars in the CORALIE planet-search sample as determined from a calibration of the CORALIE cross-correlation function surface (Santos et al., in preparation)555The cross-correlation dip can be seen as an average spectral line; as shown by Mayor (May80 (1980)) and Pont (Pon97 (1997)) its surface is well correlated with [Fe/H] and . A calibration of its surface with these two variables can in fact be used to obtain in a very simple way precise metallicity estimates, at least in a statistical sense. In this particular case, the calibration used to construct this “comparison” sample uses as “calibrators” the stars presented in Tables 1 and 2, and thus the results are in the same [Fe/H] scale as our spectroscopic values. The precision of the calibration is remarkable (rms0.01 dex). The resulting distribution is quite symmetric, and peeks at 0.05 dex.. Since this two field star distributions represent the actual distribution of metallicities in the solar neighborhood (within statistical errors), we can use them to estimate the “real” percentage of stars with planets for each metallicity bin that we would find if the metallicity distribution of field stars was “flat” – panels (b) and (d). As we can see from these plots, there is a steep rise of the percentage of stars with planets with [Fe/H] (we will concentrate on panel (d) given that it presents better statistics than panel (b)). Actually, the plot shows that more than 75% of the stars with planets would have [Fe/H]0.2 dex. But even more striking is the fact that 85% of the surface of the distribution falls in the region of [Fe/H]0.0. Although this is a preliminary result, the plots leave no doubts about the strong significance of the increase in the frequency of known planetary systems found with the metallicity content of their host stars.
We note that for the low metallicity tail of the distribution, this result is based on relatively poor statistics. The small relative number of stars with planets found with low [Fe/H] values is, however, perfectely consistent with recent studies that failed to find any planetary host companions amid the stars in the metal-poor globular cluster 47 Tuc (Gilliland et al. Gil00 (2000)).
4.2 A simple “pollution” model
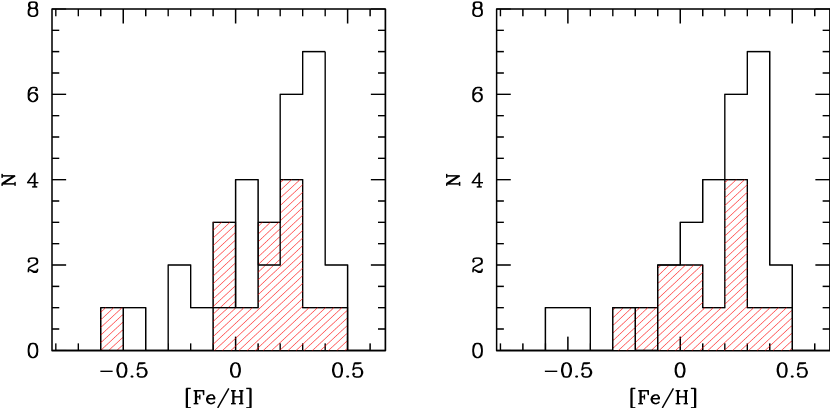
We tried to determine whether it would be possible to obtain a metallicity distribution for the stars without planets similar to that of stars with extrasolar planets by simply adding material to their convective envelopes. To make this simple model, we computed the convective zone mass for each star using Eq. (5) and (6) of Murray et al. (Mur01 (2001)) – metallicity-dependent relations for 1.2M☉; only stars in this mass range were used, since the comparison sample is not complete for higher masses. We are supposing that the “pollution”, if significant, has taken place after the star reaches the ZAMS. As discussed in Paper I, if we consider the pollution to occur in a pre-main-sequence phase, higher quantities of material would be needed, since the convection envelope masses are bigger (D’Antona & Mazzitelli Dan94 (1994)). In fact, recent results show that gas-disc lifetimes can be higher than previously thought (up to 20 Myr – Thi et al. Thi01 (2001)), and thus we can probably expect significant pollution when the star is already on the main sequence.
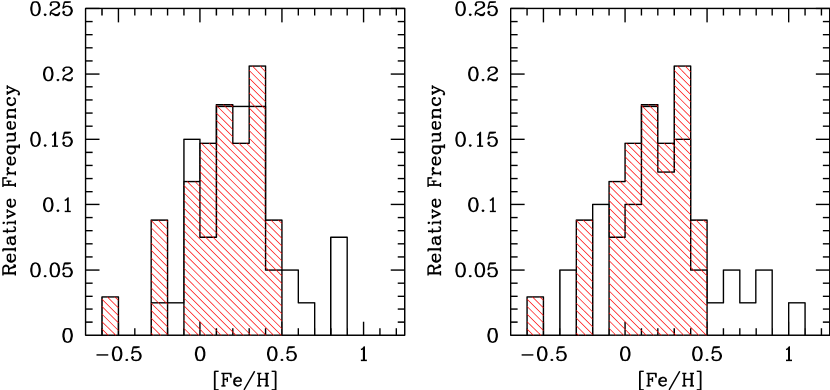
Two models were then constructed: the first was built on the supposition that the quantity of material falling into the star is the same for all the objects. A second, and possibly more realistic model, considered the pollution to be proportional to . The quantity of “added material” was chosen so that the distributions (stars with and without planets) peak at about the same value of [Fe/H].
The results are shown in Fig. 4 (open bars), compared with the results obtained for stars with planets within the same mass regime. As we can see, the shape of the planet sample, particularly the sharp cutoff at high metallicity, is not correctly obtained for any of the models. The resulting samples are more symmetric, but most of all, in both models there are always a few points that end up with extremely high metallicities ( 0.8 dex). This is particularly unpleasant, since the inclusion of higher-mass stars (such as some of the observed exoplanet hosts) would even boost some bins to higher values, given that the mass of the convection zone is supposed to be lower. As discussed by Murray et al. (Mur01 (2001)), however, Li and Be observations suggest that the total “mixing” mass increases after 1.2 M☉, eventually reducing this problem. Note also that the strong cut-off in [Fe/H] for the planet host star sample remains, even though this time we have not included stars with 1.2 M☉. This shape is not at all reproduced by our computations.
We caution, however, that we are using very simple models to make this calculation. The inclusion of more parameters, such as a time- or disc-mass-dependent accretion (which might be related to the stellar mass), or a mass-dependent size of the central disc hole (e.g. Udry et al. Udr01 (2001)), might modify the results. In any case, we have shown that a simple “pollution” model cannot explain the observations.
4.3 The mass dependence
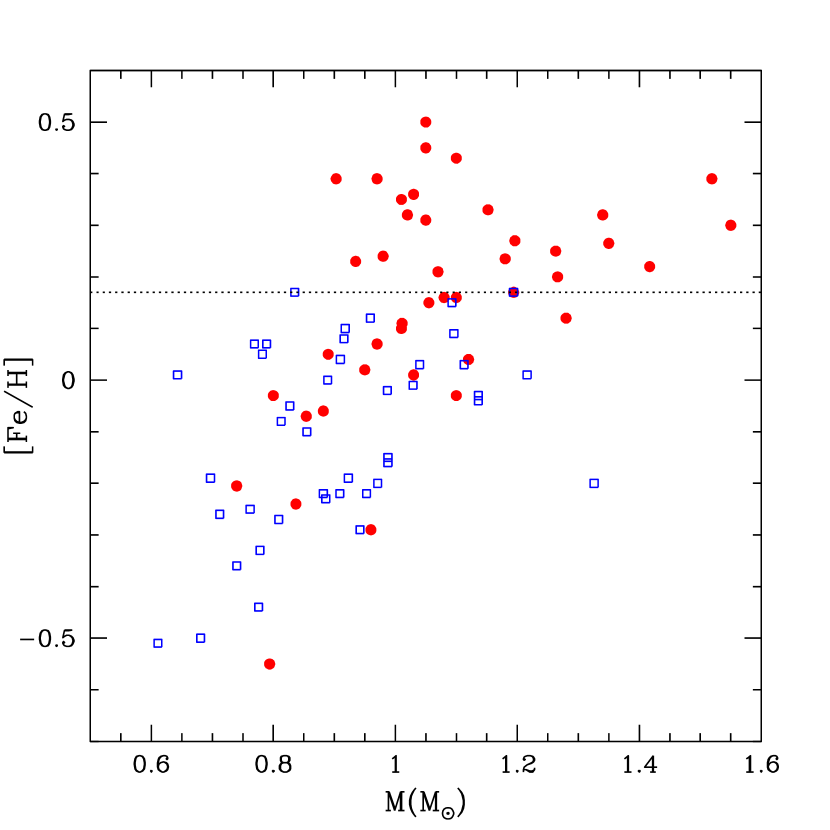
It has been suggested (Laughlin & Adams Lau97 (1997)) that if the pollution scenario is correct one would be able to see a trend of [Fe/H] with stellar mass, since the high-mass stars have tiny convective envelopes, and thus a higher probability of having a noticeable increase in [Fe/H] (here we have chosen stellar mass and not the mass of the convective shell, since if the pollution scenario is correct, the original mass for the convection zone for the stars with planets would not be correctly calculated). In Fig. 5 we present such a plot.
There are three features in the plot that deserve a comment. First, the region for 1.2 M☉ has a very low number of stars without planets. This is because in a volume-limited sample of stars, there are very few dwarfs in this mass regime (the IMF decreases with mass). However, these stars are bright, and thus easier targets for planet searches, which explains the high number of planetary candidates in this region. On the other hand, for masses 0.8 M☉, we see the opposite effect: stars are fainter, and thus difficult targets for planet searches, but are more numerous in a volume-limited sample. There are probably, however, two more biases in the diagram. In fact, the comparison sample was cut in . For a given temperature, a higher-metallicity star also has higher mass. Thus, stars in the upper part of the diagram (more metal-rich) are moved to the righthand side relative to stars in the lower part. For a fixed , 0.2 dex in metallicity imply 0.05 . On the other hand, if we take a given volume-limited sample of dwarfs, lower-mass dwarfs tend to be older than high-mass dwarfs; in proportion there are thus fewer metal-rich dwarfs in the “high”-mass region of the plot. These facts might explain the lack of stars with planetary companions presenting 1.2 M☉ and low [Fe/H].
In any case, the most striking thing in the diagram is the fact that all comparison stars have [Fe/H] 0.17 dex, while about 55% of stars with planets have metallicity above that value. Furthermore, contrary to former studies (Laughlin Lau00 (2000)) this diagram does not suggest that the metallicity of the upper envelope of stars with planets is increasing with stellar mass. This point renders unlikely the possibility that the high metallicity of these stars is due to pollution. As discussed above, however, for stellar masses higher than 1.2 M☉, the total “mixing” mass may increase. This may explain to some extent the lower value of the upper envelope of [Fe/H] for masses above this limit, but it is not certain that it is enough to explain the difference. An extension of our comparison sample for stars with 1.2 M☉ would be very useful.
As mentioned, our results and interpretations are opposed to those presented by Laughlin (Lau00 (2000)), who used photometric indices to compute the metallicities for a sample of stars with planets, and for a large volume-limited sample of dwarfs used as “comparison”. We believe that there are two important reasons for the difference. First, the trend he finds in [Fe/H] vs. stellar mass is mainly due to the few “low”-[Fe/H] planet host stars having 1 M☉. On the other hand, in his plot there are a few very high metallicity “comparison” stars in the region of 1.1 M☉. If we believe in the results presented in this paper, the probability that these stars harbour planets is very high. His sample might in fact be biased by the presence of planet host stars in his “comparison” sample.
| HD | Star | M | Period | a | e |
|---|---|---|---|---|---|
| number | () | (days) | (A.U.) | ||
| 1237 | GJ 3021 | 3.51 | 133.7 | 0.494 | 0.51 |
| 6434 | HD 6434 | 0.48 | 22.1 | 0.15 | 0.295 |
| 10697 | 109 Psc | 6.60 | 1072 | 2.12 | 0.12 |
| 12661 | HD 12661 | 2.93 | 264.0 | 0.789 | 0.33 |
| 13445 | Gl 86 | 3.77 | 15.8 | 0.11 | 0.04 |
| 16141 | HD 16141 | 0.23 | 75.8 | 0.35 | 0.28 |
| 17051 | $ι$ Hor | 2.36 | 311.3 | 0.93 | 0.22 |
| 19994 | HD 19994 | 1.88 | 454.2 | 1.23 | 0.2 |
| 22049 | $ϵ$ Eri | 0.84 | 2518 | 3.4 | 0.6 |
| 28185 | HD 28185 | 5.6 | 385 | 1.0 | 0.06 |
| 37124 | HD 37124 | 1.04 | 154.8 | 0.55 | 0.31 |
| 38529 | HD 38529 | 0.81 | 14.3 | 0.129 | 0.27 |
| 46375 | HD 46375 | 0.26 | 3.02 | 0.041 | 0.02 |
| 52265 | HD 52265 | 1.08 | 119.2 | 0.5 | 0.35 |
| 75289 | HD 75289 | 0.44 | 3.48 | 0.04 | 0.065 |
| 75732A | 55 Cnc | 0.82 | 14.66 | 0.12 | 0.03 |
| 80606 | HD 80606 | 3.51 | 111.8 | 0.44 | 0.93 |
| 89744 | HD 89744 | 7.54 | 265.0 | 0.91 | 0.7 |
| 92788 | HD 92788 | 3.77 | 340.8 | 0.97 | 0.36 |
| 95128 | 47 UMa | 2.57 | 1084 | 2.1 | 0.13 |
| 108147 | HD 108147 | 0.35 | 11.05 | 0.10 | 0.57 |
| 117176 | 70 Vir | 7.75 | 116.7 | 0.48 | 0.4 |
| 120136 | $τ$ Boo | 4.29 | 3.31 | 0.047 | 0.02 |
| 121504 | HD 121504 | 0.89 | 64.62 | 0.32 | 0.13 |
| 130322 | HD 130322 | 1.04 | 10.72 | 0.088 | 0.044 |
| 134987 | 23 Lib | 1.57 | 259.6 | 0.81 | 0.24 |
| 143761 | $ρ$ CrB | 1.15 | 39.6 | 0.23 | 0.07 |
| 145675 | 14 Her | 5.65 | 1650 | 2.84 | 0.37 |
| 168746 | HD 168746 | 0.25 | 6.41 | 0.066 | 0.00 |
| 169830 | HD 169830 | 3.04 | 229.9 | 0.82 | 0.35 |
| 177830 | HD 177830 | 1.26 | 391.6 | 1.1 | 0.41 |
| 186427 | 16 Cyg B | 1.75 | 804.4 | 1.61 | 0.67 |
| 187123 | HD 187123 | 0.60 | 3.10 | 0.042 | 0.01 |
| 190228 | HD 190228 | 5.03 | 1161 | 2.3 | 0.5 |
| 192263 | HD 192263 | 0.75 | 24.13 | 0.15 | 0.00 |
| 209458 | HD 209458 | 0.68 | 3.52 | 0.047 | 0.00 |
| 210277 | HD 210277 | 1.31 | 435.6 | 1.09 | 0.34 |
| 217014 | 51 Peg | 0.47 | 4.23 | 0.05 | 0.00 |
| 217107 | HD 217107 | 1.34 | 7.11 | 0.071 | 0.14 |
| 222582 | HD 222582 | 5.44 | 575.9 | 1.35 | 0.71 |
If we concentrate on the mass interval for which we have both stars with planets and comparison stars (region with 1.2 M M☉), we obtain a mean [Fe/H] = 0.13 for the star with planet sample, and 0.08 for the comparison star sample. This makes a difference of about 0.21 dex, for a mean stellar mass of 0.95 M⊙. To pollute the convective envelope of a 0.95 solar mass star containing about 0.04 M☉ in the convection zone (D’Antona & Mazzitelli 1994) in order to obtain the observed difference, one would need about 10 earth masses of pure iron. Considering the composition of C1 chondrites, this would mean 5 times more in silicate material, a value that seems excessively high. The addition of giant planets, also very rich in gas, would need even more material. For example, the addition of Jupiter to the present-day Sun would only be able to increase its metallicity by 0.05 dex, while adding two jupiters would increase 0.08 dex (e.g. Gonzalez Gon98a (1998)). We are supposing here that Jupiter has a rocky core, which is not necessarily true (Guillot Gui99 (1999)).
Murray et al. (Mur01 (2001)) have reported evidence that all stars in the solar neighbourhood have accreted about 0.4 Earth masses of iron, suggesting that “terrestrial-type material is common around solar type stars.” This seems to be particularly evident in the objects with 1.3–1.4 M☉, which is in accordance with expectations (Laughlin et al. Lau97 (1997)). If confirmed, and as discussed by these authors, this result further stresses the difficulty of obtaining the [Fe/H] differences we observe considering a pollution model: 0.4 Earth masses of iron are definitely not able to explain the observed differences between stars with planets and stars “without” planets.
4.4 Using evolved stars as a test
One other interesting note can be added by looking at the “star-with-planet” sample. If the pollution scenario were correct, we would expect evolved stars (sub-giants) having planetary companions to have lower metallicities than their dwarf counterparts, since the convection envelope increases in mass as the star evolves off the main sequence (Sackmann et al. Sac93 (1993)), diluting its metallicity content.
There are eight stars in Tables 2 and 3 having spectroscopic values below 4.10 dex (probably already slightly evolving away from the main sequence): HD 10697 (3.96), HD 38529 (4.01), HD 117176 (3.90), HD 143761 (4.10), HD 168443 (4.10), HD 169830 (4.04), HD 177830 (3.32) and HD 190228 (4.02). If we compute the mean [Fe/H] we obtain a value of 0.08 0.25 (with values going from 0.29 to 0.39), only slightly lower than the value of 0.15 0.22 for the sample comprising only stars with (values going from 0.55 to 0.50). As mentioned also by Gonzalez et al. (Gon01 (2001)), this is even more striking when we notice that the higher-metallicity star in this “low ” sample (HD 177830) is that having the lower surface gravity.
5 Metallicity and orbital parameters
Given that we already have more than 40 extrasolar planets with high-precision metallicity determinations, we can start to think about looking for possible trends in [Fe/H] with planetary mass, semi-major axis or period, and eccentricity.
Gonzalez (Gon98a (1998)) and Queloz et al. (Que00 (2000)) have suggested that stars with short-period planets (i.e. small semi-major axes) may be particularly metal-rich, even amongst the planetary hosts. The number of planets that were known by that time was, however, not enough to arrive at a definitive conclusion. Here we revisit that discussion with much better statistics.
In Fig. 6 we present a plot of the distribution of planets for two orbital “radius” regimes: stars with planets orbiting with semi-major axes lower than 0.1 AU (shaded histogram), and with semi-major axes greater than 0.1 A.U (open histogram). The values were taken from Table 4. Stars with multiple companions are denoted by the vertical lines and were not included in the histograms. These include, among the stars for which we have [Fe/H] values available, the multiple systems around $υ$ And (Butler et al. But99 (1999)), HD 83443 (Mayor et al. 2001a ), HD 168443 (Udry et al. Udr01 (2001)), and HD 82943 (Mayor et al. 2001b ).
Some trend can be seen in the plot (right panel) suggesting that stars with short period planets might be more metal-rich then their long-period counterparts. A Kolmogorov–Smirnov test, however, gives a probability that both distributions make up part of the same sample of 75%. We have tried to make the plot using different limits of the semi-major axes; no further conclusions can be drawn. It is interesting to note that one of the longest-period planets discovered up to now (around the star 14 Her) has a value of [Fe/H] = 0.50.
Similar conclusions are drawn respecting the eccentricity or the companion mass (Fig. 7). The current results do not suggest any clear difference in [Fe/H] between high- and low-mass/eccentricity planets. If there is some trend, then more data (and probably even more precise abundances) are needed to permit conclusions. In the same way, no conclusions are possible regarding the position of the planetary systems in the plot (Fig. 6).
6 Concluding remarks
We have presented for the first time a uniform and unbiased comparison between the metallicity distributions of a sample of stars with planets and a sample of stars “without” planets. The main results can be summarized as follows:
-
•
The currently known stars with planets are substantially metal-rich when compared with non-planetary host dwarfs. The mean difference in [Fe/H] is 0.25 dex and is clearly significant.
-
•
The shape of the metallicity distribution of stars with planets has a very clear rise with [Fe/H], i.e. with , the mass fraction of heavy elements. This result, although still based upon “only” 44 objects, may help put constraints on the models and conditions leading to giant-planet formation.
-
•
The clear cut-off seen for the star-with-planet distribution at [Fe/H] 0.5 may be interpreted as a “limit” for the metallicity of solar-type dwarf stars in the solar neighbourhood; it is very difficult to explain it in terms of a convective envelope “pollution” scenario.
-
•
The metallicity of stars with planets cannot be explained by a simple “pollution” model. The differences in [Fe/H] between stars with planets and field stars does not seem to be explained by such mechanisms, but needs an original (cloud) metallicity “excess”. Otherwise huge quantities of iron-rich material would have to be engulfed, which is not easy to explain in face of the current observations. Our results do not rule out, however, planet accretion as an ongoing process in the early stages of planetary formation (during which the convective envelopes are more massive).
-
•
An analysis of the planetary orbital parameters does not reveal any clear trends with [Fe/H]. This point might give further support to the “primordial” origin of the high metallicity of stars with planets (e.g. Gonzalez Gon98a (1998); Del Popolo et al. Pop01 (2001)). On the other hand, we cannot exclude the possibility that some trend may appear in the future, e.g. when some real solar system analogues are found.
The current result concerning the high metallicity of stars with planets may represent the simple fact that the higher the metallicity of the star, the higher will be the probability that planet formation will occur.
Recently, Israelian et al. (Isr01 (2001)) have discovered that the planet host star HD 82943 has 6Li in its atmosphere. This discovery is interpreted as evidence of the infall of a planet into the star, most probably by planet disruption (Rasio & Ford Ras96 (1996)). As discussed by the authors, however, the high [Fe/H] value of this star is not necessarily related to the infall of a planet, as this would not be able to enhance the [Fe/H] value by more than a few hundredths of a dex. This is exactly what was found for the pair 16 Cyg A and B (Laws & Gonzalez (Law01 (2001)).
In fact, the present results do not exclude the possibility that pollution may play a role (eventually important in some cases, such as for the most massive dwarfs), but rather that it is not the key process leading to the observed high metallicity of the planet host stars. Recent work by Murray et al. (Mur01 (2001)) supports the idea that pollution, on a small scale, is very common among the stars of the solar neighbourhood. If confirmed, however, this result does not change in any way the conclusions of this paper, since their models predict “pollution” of the order of 0.4 Earth masses of iron, only noticeable in stars with 1.5 M☉.
One remarkable point that becames evident from the current work is the fact that our Sun occupies a “modest” position in the low [Fe/H] tail of the metallicity distribution of stars with planets. A look at the orbital parameters in Table 4, however, tells us that, to date, no “real” Solar System analogs were found. This lead us to speculate about possible different formation histories for these systems. Note, however, that we cannot draw any conclusions until other Solar System analogs are found.
The future addition of more stars in both samples studied here, and the detailed analysis of other chemical elements (in particular the light elements Li, Be and B) are of particular interest for the future, both to consolidate current results, and to understand better the multitude of different planetary systems known today. The direct comparison of other elemental abundances (e.g. -elements, C, or O) between stars with planets and “single” field dwarfs will, on the other hand, not be an easy task given the apparent lack of stars with high [Fe/H] having no giant planet companions. Meanwhile, we expect that theoretical models of disc evolution and (giant) planetary formation will be constructed to explain in a detailed way the physics beyond the current results.
Acknowledgements.
We wish to thank the Swiss National Science Foundation (FNSRS) for the continuous support for this project. We would also like to thank Nami Mowlavi for help computing masses for the stars, and to Terry Mahoney for the useful english comments. Support from Fundação para a Ciência e Tecnologia, Portugal, to N.C.S. in the form of a scholarship is gratefully acknowledged.References
- (1) Boss A.P., 2000, ApJ 536, L101
- (2) Butler R.P., et al., 2001, ApJ, submitted
- (3) Butler R.P., Vogt S.S., Marcy G.W., et al., 2000, ApJ 545, 504
- (4) Butler R.P., Marcy G., Fisher D., et al., 1999, ApJ 526, 916
- (5) Butler R.P., Marcy G., Vogt S., Apps K., 1998, PASP 110, 1389
- (6) Butler R.P., Marcy G.W., Williams E., et al., 1997, ApJ 474, L115
- (7) Butler R.P., Marcy G.W., 1996, ApJ 464, L153
- (8) Cochran W., Hatzes A., Butler R.P., et al., 1997, ApJ 483, 457
- (9) D’Antona F., Mazzitelli I., 1994, ApJS 90, 467
- (10) Delfosse X., Forveille T., Mayor M., et al., 1998, A&A 338, L67
- (11) Del Popolo A., Gambera M., Nihal Ercan E., 2001, MNRAS, in press
- (12) ESA, 1997, The HIPPARCOS and TYCHO catalogue, ESA-SP 1200
- (13) Favata F., Micela G., Sciortino S., 1997, A&A 323, 809
- (14) Fischer D., Marcy G.W., Butler R.P., et al., 2000, ApJ, submitted
- (15) Fischer D., Marcy G.W., Butler R.P., et al., 1999, PASP 111, 50
- (16) Gilliland R. L., Brown T.M., Guhathakurta P., et al., 2000, ApJ 545, L47
- (17) Goldreich P., Tremaine S., 1980, ApJ 241, 425
- (18) Gonzalez G., Laws C., Tyagi S., Reddy B.E., 2001, AJ 121, 432
- (19) Gonzalez G., Laws C., 2000, AJ 119, 390
- (20) Gonzalez G., Wallerstein, G, Saar, S., 1999, ApJ 511, L111
- (21) Gonzalez G., 1998, A&A 334, 221
- (22) Gonzalez G., Vanture, A.D., 1998, A&A 339, L29
- (23) Gonzalez G., 1997, MNRAS 285, 403
- (24) Guillot T., 1999, Science 286, 72
- (25) Hatzes A.P, Cochran W.D., McArthur B., et al., 2000, ApJ 544, L145
- (26) Henry G.W., Marcy G.W., Butler R.P., Vogt S., 2000, ApJ 529, L41
- (27) Israelian G., Santos N.C., Mayor M., Rebolo R., 2001, Nature 411, 163
- (28) Korzennik S.G., Brown T.M., Fisher D.A., et al., 2000, ApJ 533, L147
- (29) Kürster M., Endl M., Els S., et al., 2000, A&A 53, L33
- (30) Kurucz, R. L., 1993, CD-ROMs, ATLAS9 Stellar Atmospheres Programs and 2 Grid (Cambridge: Smithsonian Astrophys. Obs.)
- (31) Latham D.W., Stephanik R.P., Mazeh T., Mayor M., 1989, Nature 339, 38
- (32) Laws C., Gonzalez G., 2001, ApJ, in press
- (33) Laughlin G., 2000, ApJ 545, 1064
- (34) Laughlin G., Adans F.C., 1997, ApJ 491, L51
- (35) Lin D., Bodenheimer P., Richardson D.C., 1996, Nat. 380, 606
- (36) Lissauer J., 1995, Icarus 114, 217
- (37) Mazeh T., Naef D., Torres G., 2000, ApJ 532, L55
- (38) Marcy G.W., Butler R.P., Vogt, S., 2000, ApJ 536, L43
- (39) Marcy G.W., Butler R.P, Vogt S., et al. 1999, ApJ 520, 239
- (40) Marcy G.W., Butler R.P., Vogt, S., 1998, ApJ 505, L147
- (41) Marcy G.W., Butler R.P, 1999, ApJ 464, L147
- (42) Mayor M., Naef D., Pepe F., et al., 2001a. In: Penny A., Artymowicz P., Lagrange A.-M., Russel S., “Planetary Systems in the Universe: Observations, Formation and Evolution”, ASP Conf. Ser., in press
- (43) Mayor et al., 2001b, ESO Press-Release 07/01 (www.eso.org/outreach/press-rel/pr-2001/pr-07-01.html)
- (44) Mayor M., Queloz D., 1995, Nature 378, 355
- (45) Mayor M., 1980, A&A 87, L1
- (46) Murray M., Chaboyer B., Arras P., et al., 2001, submitted to ApJ
- (47) Naef D., Mayor M., Pepe F., et al., 2001a, A&A, submitted
- (48) Naef D., Latham D., Mayor M., et al., 2001b, A&A, submitted
- (49) Noyes R., Jha S., Korzennik S., et al., 1997, ApJ 483, L111
- (50) Pont F., 1997, Ph.D. Thesis, University of Geneva
- (51) Queloz D., Mayor M., Naef D., et al., 2001. In: Penny A., Artymowicz P., Lagrange A.-M., Russel S., “Planetary Systems in the Universe: Observations, Formation and Evolution”, ASP Conf. Ser., in press
- (52) Queloz D., Mayor M., Weber L., et al., 2000, A&A 354, 99
- (53) Rasio F.A., Ford E.B., 1996, Science 274, 954
- (54) Sackmann I.-J., Boothroyd A.I., Kraemer K.E., 1993, ApJ 418, 457
- (55) Santos N.C., Israelian G., Mayor M., 2001. In: Penny A., Artymowicz P., Lagrange A.-M., Russel S., “Planetary Systems in the Universe: Observations, Formation and Evolution”, ASP Conf. Ser., in press
- (56) Santos N.C., Israelian G., Mayor M., 2000a, A&A 363, 228 (Paper I)
- (57) Santos N.C., Mayor M., Naef D., et al., 2000b, A&A 356, 599
- (58) Schaerer D., Charbonnel C., Meynet G., et al., 1993, A&AS 102, 339
- (59) Schaerer D., Meynet G., Maeder A., et al., 1992, A&AS 98, 523
- (60) Schaller G., Schaerer D., Meynet G., Maeder, A., 1992, A&AS 96, 269
- (61) Schmidt W., Henning T., Mucha R., 1997, A&A 325, 569
- (62) Sivan J.-P., Mayor M., Naef D., et al., 2001. In: Penny A., Artymowicz P., Lagrange A.-M., Russel S., “Planetary Systems in the Universe: Observations, Formation and Evolution”, ASP Conf. Ser., in press
- (63) Smith V.V., Cunha C., Lazzaro D., 2001, AJ, in press
- (64) Sneden C., 1973, Ph.D. thesis, University of Texas
- (65) Thi W.F., Blake G.A., Van Dishoeck E.F., et al., 2001, Nature 409, 60
- (66) Tinney C., Butler R.P., Marcy G., et al., 2001, ApJL, in press
- (67) Udry S., Mayor M., Queloz D., 2001. In: Penny A., Artymowicz P., Lagrange A.-M., Russel S., “Planetary Systems in the Universe: Observations, Formation and Evolution”, ASP Conf. Ser., in press
- (68) Udry S., Mayor M., Naef D., et al., 2000, A&A 356, 590
- (69) Vogt S.S., Marcy G.W., Butler R.P., Apps K., 2000, ApJ 536, 902