The stellar content of the super star clusters in NGC 1569⋆ 00footnotetext: ⋆Based on observations with the NASA/ESA Hubble Space Telescope, obtained at the Space Telescope Science Institute, which is operated by AURA for NASA under contract NAS5-26555
Abstract
We discuss HST FOS ultraviolet spectroscopy and NICMOS near-infrared photometry of four young super star clusters in the central region of the irregular starburst galaxy NGC 1569. The new observations coupled with previous HST WFPC2 photometry and ground-based optical spectroscopy allow us to isolate and age-date the hot and cool stellar components of these massive clusters.
We analyze the two components A1 and A2 of the brightest super star cluster NGC 1569-A. This cluster received previous attention due to the simultaneous presence of Wolf-Rayet stars and red supergiants. The FOS spectra provide the first evidence for O-stars in NGC 1569-A, indicating a young ( Myr) stellar component in A1 and/or A2. Comparison with other high-mass star-forming regions suggests that the O- and Wolf-Rayet stars are spatially coincident. If so, cluster A2 could be the host of the very young O- and Wolf-Rayet population, and the somewhat older red supergiants could be predominantly located in A1.
The mass-to-light ratio of NGC 1569-A1 is analyzed in five optical and infrared photometric bands and compared to evolutionary synthesis models. No indications for an anomalous initial mass function are found, consistent with a scenario where this cluster is the progenitor of present-day globular clusters.
The clusters A1 and A2 are compared to clusters B and #30. The latter two clusters are older and fully dominated by red supergiants. All four super star clusters provide a significant fraction (20 - 25%) of the total optical and near-infrared light in the central region of the galaxy. The photometric properties of the super star cluster population in NGC 1569 resemble those of the populous clusters in the Magellanic Clouds.
1 Introduction
NGC 1569 is a well studied nearby starburst galaxy with sub-solar metallicity (Z, Greggio et al. 1998 and referecne therein), hosting the two young super star clusters (SSCs) NGC 1569-A and B in its central region. A large body of observations at optical wavelengths exists for these luminous, high-density clusters, both ground-based (Arp & Sandage 1985; Prada, Greve, & McKeith 1994; Ho & Filippenko 1996a, b; González Delgado et al. 1997), and with HST (O’Connell, Gallagher, & Hunter 1994; Buckalew et al. 2000; Hunter et al. 2000). Spectroscopy and imaging photometry suggest a young stellar content of blue stars and red supergiants (RSG).
HI (Israel & van Driel 1990), as well as CO and H (Greve et al. 1996) surveys of NGC 1569 have revealed spatially coincident emission from neutral and ionized atomic and molecular gas, with a pronounced hole at the location of the clusters themselves. Such a hole is interpreted as the result of recent stellar winds and supernova explosions which should confine the ionized gas in a shell, such as actually observed around NGC 1569-A (Waller 1991; Hunter, Hawley, & Gallagher 1993). The supernova activity in the NGC 1569 SSCs can also provide a significant fraction of the soft and most of the hard X-ray emission, as measured by ASCA and ROSAT (Della Ceca et al. 1996).
Recently, the higher spatial resolution of the refurbished WFPC2 showed that cluster A is made of two components (A1 and A2, De Marchi et al. 1997). Hunter et al. (2000) analyzed deep WFPC2 images and resolved another 45 compact candidate star clusters. These clusters are distributed across the galaxy. About one quarter of the clusters are located in the vicinity of NGC 1569-A. The clusters span a wide range of ages, between a few Myr up to 1 Gyr, yet most of them are estimated to be quite young, having ,, optical colors consistent with ages 30 Myr.
While there is overall consensus that the SSCs in NGC 1569 are young, the precise age of their burst episodes is still under debate. This is particularly relevant for NGC 1569-A1 and A2 whose combined spectra show features from both red supergiants and Wolf-Rayet (WR) stars (González Delgado et al. 1997). The simultaneous presence of the two types of stars is not predicted by instantaneous burst models but could be understood if the two populations originated in different clusters. Alternatively, star formation (SF) episodes lasting several Myr and/or the formation of Wolf-Rayet stars in binary systems (e.g., Vanbeveren et al. 1998, Vanbeveren 1999) could account for their spatial coexistence.
A first step towards resolving this issue was made by Buckalew et al. (2000) whose HST He II imagery demonstrated that the WR and red supergiant light are spatially anti-correlated, the WR emission being concentrated on NGC 1569-A2. In this paper we tackle this question with new ultraviolet (UV) and near-infrared (IR) observations, using HST FOS spectra and NICMOS images. In § 2 we describe the observations and data reduction procedures. In § 3 we provide evidence for an O-star population in cluster A while in § 4 we discuss the red stellar component. Then we establish an age sequence of the four most luminous super star clusters (§ 5). The mass-to-light ratio of cluster A1 is used to discuss the initial mass function (§ 6). The overall properties of the cluster population are summarized in § 7. The conclusions are presented in § 8.
2 Observations and data reduction
2.1 Ultraviolet spectroscopy
Ultraviolet spectra of NGC 1569-A111Throughout this paper we will refer to the combined light of clusters A1 and A2 as NGC 1569-A. were obtained on 16 and 17 October 1996. We used HST’s FOS to secure H-mode spectra with the red and blue channels. The FOS was pointed at R.A.(2000) = 4:30:48.18 and Dec(2000) = +64:50:58.6, and a 4-stage peak-up sequence with the , , , and apertures was performed. This sequence was done for the red and blue channels separately. At the conclusion of each peak-up sequence, NGC 1569-A was centered in the circular science aperture with a precision of better than , as verified from an analysis of the individual peak-up images. Note that the post-Costar diameter of the aperture is .
The red-channel science observations were performed with the G190H and
G270H
gratings, which have dispersions of 1.45 and 2.05 Å per diode and
cover
1590 - 2312 Å and 2222 - 3277 Å, respectively.
The blue-side observations were done with G130H,
whose dispersion and spectral range are 1 Å per diode and
1140 -1606 Å, respectively.
Further information on the program and on the
observation strategy can be found under program 6408 at
http://presto.stsci.edu/public/propinfo.html.
The raw data were retrieved from the HST Archive and processed with the calfos pipeline using the recommended, best reference files. The main difference between the originally calibrated and the recalibrated data is due to the improved flat-fielding and dead-diode removal. We found these differences to be negligibly small in our case. A strong emission feature was found at 1960 Å. Since no astrophysically plausible emission line is expected around this wavelength, we interpreted this feature as due to an intermittent diode.
Transformation from pixel to wavelength space was done with the standard FOS wavelength scales for the three gratings. NGC 1569 has a heliocentric velocity of km s-1 (Kinney et al. 1993). This is small in comparison with the FOS wavelength scale uncertainty of about 0.3 Å. Therefore we did not apply the correction to the spectra shown below. Following the standard pipeline processing we combined the individual wavelength ranges into one spectrum covering 1200 to 3200 Å. The spectrum was smoothed with a 5-pixel boxcar filter. Since the original spectrum was oversampled by four pixels, the boxcar smoothing almost retains the original spectral resolution. Finally, we generated a second, rectified spectrum by division by a low-order spline function that had been fit to line-free regions in the continuum.
The flux-calibrated FOS spectrum of NGC 1569-A is plotted in Fig. 1. The FOS aperture has a diameter of , sampling most of the cluster luminosity, taking also into account the photometric correction included in the pipeline to compensate for Point Spread Function (PSF) light losses.
The broad absorption at 2200 Å is due to strong foreground extinction. The high noise level around 1600 Å is in the overlap region between the G130H and G190H spectra where the detector sensitivity is low. In Fig. 1 we also plot for comparison an IUE spectrum of NGC 1569, discussed by McQuade, Calzetti, & Kinney (1995). The IUE aperture has dimensions , covering the whole central SF region in this galaxy.
At wavelengths below about 2500 Å the shapes of the FOS and IUE spectra are essentially identical, suggesting a spatially uniform foreground and intrinsic reddening within the galaxy and negligible aperture effects. The flux level of the FOS data is lower by about a factor of 5 in comparison with IUE. The IUE spectrum becomes redder than the FOS spectrum at the longest wavelengths plotted in Fig. 1. We interpret this flux excess as due to a surrounding, somewhat older population, which is included in the IUE aperture.
The de-reddened FOS spectrum of NGC 1569-A is shown in Fig. 2. Conversion to luminosity units was done for an assumed distance of Mpc (De Marchi et al. 1997). We used the strength of the 2200 Å feature to obtain an independent estimate of the Galactic contribution to . Adopting the reddening curve of Mathis (1990), we varied to remove the 2200 Å depression. was found, in good agreement with the value quoted in the literature. The additional intrinsic component of was derived from a comparison of the observed spectral slope (after correction for foreground reddening) and the theoretical prediction (Leitherer & Heckman 1995). We adopted the starburst obscuration law of Calzetti (1997) to derive an intrinsic reddening of . The total reddening then becomes .
2.2 Near-infrared photometry
HST NICMOS IR imaging of NGC 1569 with the F110W and F160W filters using the NIC2 camera centered in between the SSCs A and B was obtained on 25 February, 1998. We performed a spiral dithering with a step size of for an on-source total integration time of about 85 min in each filter. The dithered frames have been combined using a drizzling technique, and the final images with pixel-1 have been photometrically calibrated by transforming the count rates into the VEGAMAG system, according to the PHOTNU and zero point values reported in the NICMOS web page.
Details of the photometry of the stellar population, with an extensive discussion of the reduction procedure used to correct the frames for the instrumental response are presented by Aloisi et al. (2001). Here we focus on the cluster photometry. The main objective of our study is the double cluster NGC 1569-A but we include the clusters B and #30 as well. The latter cluster was identified by Hunter et al. (2000) and has properties similar to those of A and B. By combining the NICMOS and WFPC2 data, we perform a multicolor analysis and are able to characterize the different blue and red stellar components of each cluster.
The SSCs are barely resolved due to the width of the NIC2 PSF. We used ROMAFOT (Buonanno et al. 1983) to fit each cluster luminosity profile with a Moffat function after subtraction of the local background. With such a technique we can also properly deconvolve the two components in the double cluster NGC 1569-A.
We applied this procedure to both the NIC2 F110W, F160W and the PC F380W, F439W, F555W images (De Marchi et al. 1997; Greggio et al. 1998). We also performed aperture photometry within a radius of 0.9” and the resulting magnitudes turn out to be 0.2 mag brighter than those obtained with the profile fitting technique. Finally, we compared our optical magnitudes obtained with the fitting technique with those by De Marchi et al. (1997, clusters A1, A2, and B) and Hunter et al. (2000, clusters B and #30) obtained from aperture photometry and once again we found that the latter values are a few tenths of a magnitude brighter. Although our profile fitting technique might somewhat underestimate the total cluster luminosity, it should however provide more reliable colors for an analysis of the cluster stellar populations since it is less contaminated by the galaxy field and/or foreground stars. We assume 0.2 mag as a conservative error in the derived magnitudes and colors. This value takes into account the uncertainty of the aperture effects and background subtraction.
Due to its low Galactic latitude of , Galactic
foreground extinction is significant in NGC 1569.
In Table 1 the dereddened F555W0 magnitude and
(F380W-F439W)0,
(F439W-F555W)0,
(F110W-F160W)0,
(F555W-F110W)0,
(F439W-F160W)0
colors of the four SSCs are listed, assuming ,
,
,
,
, and
,
according to the values quoted by Holtzmann et al. (1995, their
Table 12a,b) and Calzetti (private communication).
If a further intrinsic reddening of about 0.15 mag in
is taken into account (see § 2.1), the
(F555W-F110W)0 and (F439W-F160W)0 colors
become 0.2 and 0.3 mag bluer, respectively,
whereas the (F380W-F439W)0 and the
(F110W-F160W)0 colors are not significantly affected.
In Fig. 3 we plot the energy distribution of each SSC,
according to the HST photometry of Table 1 and the
zero-magnitude flux conversion reported by Holtzmann et al.
(1995, cf. their Table 9) and on the NICMOS web page.
We also transformed our HST colors into the ground-based Johnson ,,,, system with the relations described by Origlia & Leitherer (2000). Using these transformations we found that (F380W-F439W) corresponds to , while (F380W-F439W), measured in cluster #30, corresponds to . (F439W-F555W) is very similar to for (F439W-F555W), (F110W-F160W) corresponds to , while (F110W-F160W) implies 0.1 - 0.2 mag bluer colors.
3 Evidence for an O-star population
The strongest lines in the UV spectrum in Fig. 2 are all ground-level transitions, suggesting that they originate in stellar winds, interstellar gas, or in the Milky Way halo, but have little photospheric contribution. The spectral resolution of FOS is insufficient to resolve any Milky Way halo absorption (if present) from absorption in NGC 1569 due to the small heliocentric velocity of NGC 1569 ( km s-1). This must be kept in mind during the following discussion.
The wavelength zero point of the G130H spectrum can be determined from the strong geocoronal Ly. The observed velocity is +143 km s-1. This offset corresponds to a shift by half a diode, which is within the expectation. Assuming that geocoronal Ly should be unshifted, we corrected the G130H wavelength scale by -143 km s-1 and by and determined the velocities of C II 1335, Si IV 1400, Si II 1526, and C IV 1550. In the case of Si IV 1400 and C IV 1550 we ignored the blue wings due to stellar winds which are seen shortward of the narrow interstellar absorptions. The mean velocity is km s-1, consistent with no velocity shift. Since the G190H and G270H observations were done with an independent target acquisition several hours after the G130H observations, the velocity offset determined in G130H does not apply to G190H and G270H. Heliocentric velocities (without applying any other correction) were derived for Al II 1670, Si II 1808, Al III 1858, Mg I 2024, Fe II 2378, Fe II 2593, Mg II 2800, and Mg I 2852. We found a mean velocity of km s-1. This agrees with the G130H result; a zero point error of order 100 km s-1 is expected for these red-channel observations as well. Note that the zero point error is not caused by centering errors of the target but by the non-repeatability of the grating wheel.
The relatively low spectral resolution of FOS, combined with possible blending by Milky Way halo lines precludes any quantitative interpretation of the measured velocities. Heckman & Leitherer (1997), using HST’s GHRS, detected a blueshift of all interstellar lines in the starbursting dwarf galaxy NGC 1705 by 80 km s-1, and ascribed it to an outflowing galactic superwind. Such a blueshift could well be present in the spectrum of NGC 1569-A but it would remain undetected in our data.
The quality of the data is, however, adequate to address a central question we would like to answer: Is there evidence for a young O-star population in the SSC NGC 1569-A? O stars have powerful stellar winds whose associated broad absorptions and P Cygni profiles are detectable in young populations (Robert, Leitherer, & Heckman 1993; Leitherer, Robert, & Heckman 1995; de Mello, Leitherer, & Heckman 2000). Inspection of Fig. 2 suggests that hot-star winds are indeed seen in NGC 1569-A. Si IV 1400 and C IV 1550 have broad, blueshifted absorptions superimposed on the narrow interstellar lines. They are clearly broader than the purely interstellar lines of, e.g., Si II 1526 or C II 1335. Note that Si IV 1400 and C IV 1550 have blueshifted wings but we were not able to decompose the stellar and interstellar components since they are unresolved.
The case for an O-star component becomes more compelling when the NGC 1569-A data are compared to UV spectra of stellar populations with and without O component. This is done in Figs. 4 and 5, which show the spectral regions around Si IV 1400 and C IV 1550, respectively. The NGC 1705-1 data were taken with the GHRS (from Heckman & Leitherer 1997) and refer to a 10 to 15 Myr old cluster with no O stars. In this case, Si IV 1400 and C IV 1550 are narrow due to interstellar and weak photospheric contributions. NGC 4214 is a very young starburst cluster discussed by Leitherer et al. (1996). Its FOS spectrum shows strong P Cygni profiles due to O-star winds. NGC 1569-A is intermediate between the two cases. While its P Cygni profile is not as strong as in NGC 4214, excess wind emission and absorption with respect to NGC 1705-1 is clearly detected. NGC 1569 is a most unfavorable case for the application of ultraviolet synthesis models. The high foreground reddening and low systemic velocity lead to dominating Milky Way absorption almost coinciding with the stellar wind lines at the resolution of the FOS. Therefore tailored synthesis models would not be appropriate. Nevertheless we can attempt to narrow down the age range of the observed O-star population with the models of Leitherer et al. (2001). Using their Figure 6, we find that the blueshifted absorptions and the emission components in Si IV 1400 and C IV 1550 suggest ages between 4 and 7 Myr if the SF occurred instantaneously.
NGC 1569-A and NGC 1705-1 are two SSCs which were previously thought to have similar age, based on their optical colors (O’Connell, Gallagher, & Hunter 1994). The UV spectra indicate significant differences: NGC 1705-1 has no O-star component, consistent with an age above 10 Myr. NGC 1569-A, on the other hand, does have a weak O population.
4 The red stellar population
The UV data are sensitive to the hottest, youngest population. The presence or absence of an additional cooler and older population can be probed with the longer-wavelength data in Table 1 and Fig. 3.
A1, A2, and B have identical (F380W-F439W)0 colors, while cluster #30 is 0.4 mag redder. Both clusters B and #30 have slightly redder (F439W-F555W)0 than A1 and A2. The IR (F110W-F160W)0 and optical-to-IR (F555W-F110W)0 and (F439W-F160W)0 colors show more variations. NGC 1569-A2 is the bluest cluster, NGC 1569-B is the reddest and the brightest in the IR, while NGC 1569-A1 is the brightest in the visual range. The colors suggest that A1 and A2 are bluer, and therefore younger than B and #30.
Theoretical colors of evolving starbursts are quite sensitive to cool stars. Starburst99 models (Leitherer et al. 1999) predict a sudden reddening after about 6 to 8 Myr, depending on metallicity. As discussed by Origlia et al. (1999), the predictions are uncertain due to deficiency in the stellar evolution models of RSGs at low metallicity. Nevertheless, a safe prediction at any metallicity is that a redder color indicates a cooler stellar population and that the cool population has a more significant effect towards longer wavelengths. Using the Starburst99 colors for guidance, we expect and to vary less than 0.5 mag between Myr and 30 Myr, i.e. between the O-star and RSG dominated phases. This barely exceeds the photometric uncertainties and is therefore less useful in our particular case. The optical-to-IR and colors, however, are expected to change by up to 2 mag.
The photometry in Table 1 suggests that (i) clusters B and #30 are in a RSG dominated phase, (ii) A2 has few (if any) RSGs, and (iii) A1 is intermediate between A2 and B/#30.
Ground-based red and near-IR spectroscopy of clusters A and B show the Ca II 8600 triplet as well as the CO 2.3 feature in absorption (Prada et al. 1994; González Delgado et al. 1997; Hunter et al. 2000), indicating the presence of red supergiants. Ho & Filippenko (1996a, b) secured high-resolution spectra of cluster A between 5000 and 6300 Å. Numerous weak absorption lines from RSGs allowed them to estimate a stellar velocity dispersion of 15.7 km s-1. Moreover, many Balmer and Paschen absorption lines (Arp & Sandage 1985; Prada et al. 1994; González Delgado et al. 1997) have been detected in this cluster. These lines are common features in A-type stars and, in the case of the NGC 1569 SSCs, are most probably associated with luminous supergiants (Arp & Sandage 1985) rather than with an older (1 Gyr) main-sequence population.
5 The relative ages of the clusters
Prada et al. (1994) classified the SSCs A and B in the age sequence proposed by Bica, Alloin & Santos (1990) for the LMC clusters, which is based on the CaII triplet and Paschen line equivalent widths. They suggested that NGC 1569-A is slightly older than NGC 1569-B, and assigned NGC 1569-A to their Yc (12-35 Myr) and NGC 1569-B to their Yb (7-12 Myr) groups. However, even LMC clusters in the Ya (5-7 Myr) group have CaII triplet equivalent widths very close to that observed in NGC 1569-A (Hunter et al. 2000). Therefore NGC 1569-A can be very young as well, with luminous O-B stars starting to evolve into massive RSGs.
González Delgado et al. (1997) measured Balmer jumps 1.15 in both cluster A and B. Instantaneous burst models at metallicity below solar (but to some extent also continuous SF models) predict a very young ( Myr) age if and Balmer jumps1.15 are observed (Fig. 13 of Leitherer & Heckman 1995 and Fig. 5 of González Delgado et al. 1997). This appears to be too young to allow the simultaneous presence of hot stars and RSGs.
Nevertheless, Origlia et al. (1999) show that the colors predicted by Leitherer & Heckman (1995) using the Geneva evolutionary tracks at subsolar metallicity are too red compared to those observed in star clusters in the Magellanic Clouds. As a possible explanation they suggest that these tracks overestimate the lifetime in the blue portion of the loops during the core He-burning phase. In such blue excursions the massive stars are cooler (A-type stars) than the O-B main sequence population and tend to redden the blue portion of the optical spectrum. Shorter blue loop lifetimes can indeed produce bluer colors (a few tenths of a magnitude) and shallower (20%) Balmer jumps for a given age since the contribution to the blue luminosity by A-type stars is reduced.
If this bias is taken into account in the models, the measured color and Balmer jump in NGC 1569-A and B can be also consistent with somewhat older ages at which RSGs are actually predicted to be observed. is indeed typical of the youngest LMC and SMC clusters (e.g., van den Bergh 1981), which are known to contain red supergiants, on the basis of the strong CaII triplet, CO lines and the red color (Bica, Alloin & Santos 1990; Persson et al. 1983; Oliva & Origlia 1998).
González Delgado et al. (1997) also detected the 4686 WR bump in cluster A and no 5808 WR bump, indicating that these WR stars should be of the WN subtype. The equivalent width of the WR feature is 3.4 Å, while the inferred WR/WR+O ratio is 10%.
Continuous SF models predict a WR bump equivalent width 1 Å and a corresponding WR/WR+O value 2% at metallicities below solar (Fig. 6 of González Delgado et al. 1997; Figs. 2 and 4 of Cerviño & Mas-Hesse 1994). These values are well below the corresponding quantities measured in cluster A, so continuous SF does not seem adequate to explain the coexistence of both WR stars and RSGs in this cluster.
The coexistence of WRs and RSGs can be predicted by the so called binary channel scenario (Vanbeveren et al. 1998; Vanbeveren 1999) for the formation of the WR population. Stars with initial masses 40 M⊙ undergo mass loss mainly due to the strong stellar winds (the single-star channel; e.g.; Maeder & Meynet 1994 and references therein), while Roche lobe overflow in massive close binaries occurs at lower initial masses. This implies that the binary channel continues to form WR stars at later epochs than the single channel, and it extends the lifetime of the global WR population, since its progenitors can have initial masses smaller than the WR mass limit for single stars.
Recent models by Schaerer & Vacca (1998) using evolutionary tracks with enhanced mass loss (Meynet et al. 1994) and a WR binary frequency of 20%, show that there is a major age separation at 5 Myr between the single and binary channels. As a first order approximation the WR bump equivalent width scales proportionally to the binary frequency if the latter is not too large. According to the models of Schaerer & Vacca (1998), equivalent widths of 3-4 Å in the 4686 WR bump can be easily obtained at ages 10 Myr for binary frequencies 50%. González Delgado et al. (1997) used the Geneva evolutionary tracks with standard mass loss and obtained an equivalent width of 3.4 Å slightly later, around 14 Myr, for the same binary frequency. Nevertheless, it is rather well established that the lower the mass loss, the later the appearance of the WR phase (Maeder & Meynet 1994). Therefore the binary channel seems to be able to account for spatially coincident and coeval (10 Myr) WR and RSG populations, even though with a relative high binary frequency and some fine tuning for the burst age.
On the other hand, as discussed in § 4, there is strong observational evidence that cluster A is double and A1 is redder than A2. This constraint favors a scenario where cluster A1, slightly redder, contains RSGs, while A2, the bluest, contains the WR stars and the O-star population (cf. § 3), which can be likely coeval. If the blue and red populations are spatially separated, the single channel scenario for the formation of the WR stars is favored since in order to have only WRs and not RSGs the burst age should be 5 Myr. At this stage the binary channel is not yet fully active (Schaerer & Vacca 1998).
To summarize, the existing body of observations is consistent with the age sequence derived from the near-IR photometry: B and #30 are the most evolved clusters (10 Myr), A2 is the youngest (5 Myr), and A1 is intermediate.
6 Constraints on the initial mass function
The initial mass function (IMF) is of considerable interest for the interpretation of SSCs as progenitors of present-day globular clusters. If low-mass stars are not present in significant numbers, SSCs are unlikely to evolve into old globular clusters, either because their dynamical survival times would be too short or because they would simply fade on a cosmologically short time scale. The observed mass-to-light ratio () allows constraints on the IMF since the luminosity is dominated by the high-mass end, and the mass by the low-mass end of the distribution. Due to their low luminosity, low-mass stars can only be inferred via their gravitational forces, e.g., by measuring the velocity dispersion of the cluster. This experiment was done by Ho & Filippenko (1996a, b) who resolved the RSG features in the optical spectrum of NGC 1569-A. Their ground-based spectra could not separate the two components of this double cluster but since A1 is brighter than A2 one can reasonably assume that the spectrum is dominated by the former.
Sternberg (1998) analyzed the visual mass-to-light ratio, , using the mass derived from Ho’s & Filippenko’s measurement. Since the crossing time scale is much shorter than its age, the cluster is expected to be dynamically mixed, and the virial theorem can be used to infer the dynamical mass. Using the same methodology as Sternberg, but adopting a distance of 2.2 Mpc and a half-light radius of 1.6 pc (De Marchi et al. 1997), we infer a dynamical mass of M⊙. Our new near-IR data allow us to extend the mass-to-light ratio analysis to the wavelength region where RSGs are brightest. We transformed the luminosities from our HST optical and IR photometry (Table 1) into the standard Johnson system and adopted a conservative error of a factor of 2 in either direction for the ratio in each passband. The error is dominated by the systematic uncertainties of the cluster mass. In order to be able to perform a comparison with evolutionary synthesis models, we need to assume an age for cluster A1. We assign conservative upper and lower limits of 15 and 5 Myr, respectively. The upper limit comes from the presence of the CO feature (Hunter et al. 2000), which could bring the age of A1 close to that of B, and the lower limit is imposed by the occurrence of the first RSGs according to stellar-evolution models.
In Fig. 6 we compare the derived mass-to-light ratios to those expected from evolutionary synthesis models by Leitherer & Heckman (1995). The panels in this figure show the models for four different IMFs and for metallicities of Z⊙, 1/4 Z⊙, and 1/10 Z⊙. The 1/4 Z⊙ models should be most appropriate for NGC 1569 but we provide models with higher and lower metallicity as a guide for the expected uncertainties, since evolutionary tracks do not properly account for metallicity effects in RSGs (cf. Origlia et al. 1999).
We explored a variety of IMF parameters with the goal of constraining the relative fraction of low-mass stars. The IMF is approximated by a power law of the form between the adopted lower and upper mass limits, and , respectively. The low-mass star contribution is increased by increasing and/or by lowering . A Salpeter IMF has in this nomenclature. Fig. 6 illustrates four examples: models with a standard Salpeter’s IMF (top panel), models with a deficit in low-mass stars resulting either from a truncated or a flatter IMF compared to the standard Salpeter’s (central panels) and models with a low-mass truncation and a steeper IMF slope (bottom panel). The best fits to the data have been obtained with a standard Salpeter IMF with lower mass cutoff down to the hydrogen-burning limit or an IMF truncated at and with a very steep slope over the whole range of masses, but this latter IMF is not commonly observed in stellar populations. Hence, even accounting for the uncertainties in the evolutionary models, Fig 6 generally does not support an IMF deficient in low-mass stars. The strongest constraint comes from the and luminosities, which sample RSGs. These near-IR data support the previous result of Sternberg (1998) that NGC 1569-A has a normal IMF with no deficit in low-mass stars.
7 Large-scale properties of the cluster population
The four young SSCs are very luminous and can provide a significant fraction of the total light in the central region of NGC 1569. In order to estimate such a contribution at different wavelengths, we compare the luminosity of the clusters to the integrated galaxy luminosity within a circular aperture of 14′′ in diameter, centered on NGC 1569-A. This region corresponds to the overlap between the PC and NIC2 frames. A major uncertainty in the aperture photometry computations comes from the subtraction of the local background, particularly in the IR. As an upper limit to this background we assume the average value measured in the less crowded regions, and as a lower limit we assume zero background. The relative contributions of the SSCs to the total luminosities in the 14′′ area have been derived for both assumptions for the background. The fractional contribution of the four clusters in all five filters is plotted in Fig. 7. The SSCs provide 20 - 25% of the central luminosity in the blue and near-IR, due to the dominant OB and red supergiant populations, respectively.
A high efficiency of SF in SSCs was determined by Meurer et al. (1995) in a large sample of starburst galaxies, and recently confirmed, e.g., in the infrared-luminous galaxy merger NGC 3256 (Zepf et al. 1999). The fact that the efficiency is high in a wide variety of interstellar environments (low and high metal content; low and high galaxy luminosity) suggests that SF in clusters is a rather common process.
Aloisi et al. (2001) performed DAOPHOT PSF fitting photometry on the NIC2 frames and found objects with and sharpness parameters exceeding the typical values of well-fitted, single stars. Some of these anomalous stellar sources can be small star clusters which are not properly resolved and extended in comparison to the adopted PSF. We analyzed the properties of these cluster candidates in an attempt to clarify their relation to the four luminous super star clusters. In order to isolate such possible candidate clusters from pure blends or spurious detections we selected those objects with F110W19.5, and sharpness in the F110W filter and we rejected the ones in positional coincidence with the four SSCs for which we obtained more accurate photometry (cf. § 2.2). The selected sharpness threshold is somewhat less conservative than the 0.4 value adopted by Aloisi et al. (2001) since here we are considering only the brightest objects.
We identified 20 candidate clusters in our NIC2 field of view. Fig. 8 shows their spatial location. Most of them are found in the vicinity of the SSCs A and B. This mirrors the spatial distribution of the clusters studied by Hunter et al. (2000), which show a rather similar concentration towards cluster B and, even more strongly, towards A. Not surprisingly, six candidate clusters of our sample show a clear counterpart in the F555W PC field of Hunter et al. (2000; clusters #10, #15, #26, #29, #31, and #32 in their Fig. 3).
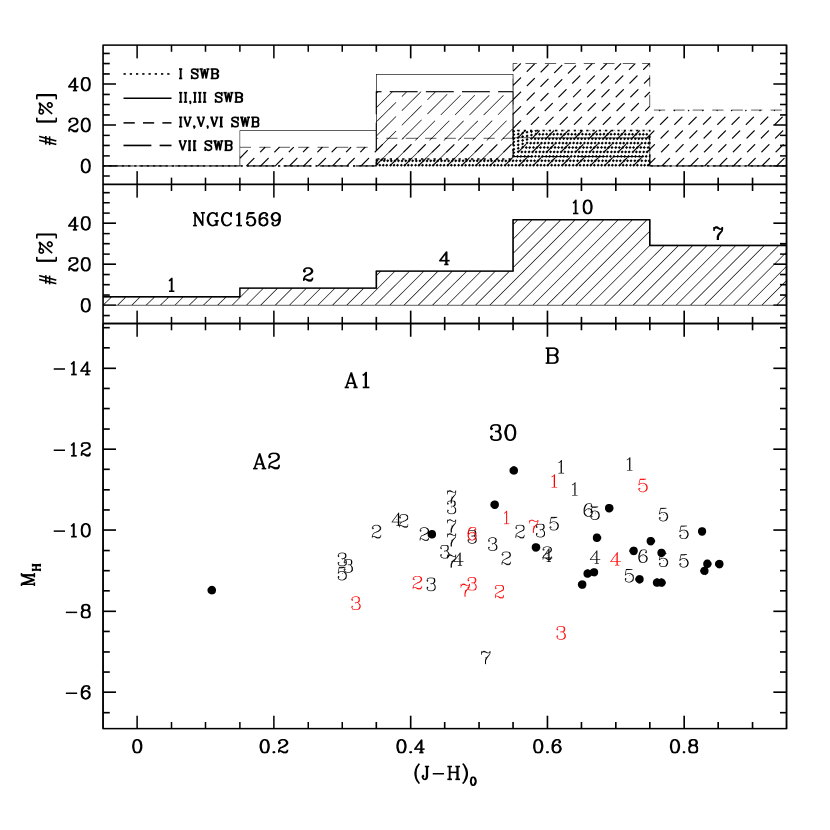
From the inferred NIC2 photometry of the four SSCs and the other 20 cluster candidates, and using the transformations into the ground-based system by Origlia & Leitherer (2000), we constructed the , color-magnitude diagram (Fig. 9, bottom panel), assuming a distance modulus . For comparison, we also included the integrated IR photometry of a sample of 60 Magellanic Cloud (MC) clusters (Persson et al. 1983), according to the age classification of Searle, Wilkinson, & Bagnuolo (1980, hereafter SWB). Since their sample is infrared-selected, even the youngest MC clusters are already in the RSG phase, hence they have ages 5 Myr.
As discussed by many authors (e.g., Chiosi et al. 1986; Girardi & Bica 1993; Santos & Frogel 1997; Brocato et al. 1999), the color distributions of the MC clusters as a function of cluster age can be affected by systematic biases, like stochastic effects due to the intrinsic small number of luminous red stars in the young and intermediate age clusters, but also by some metallicity spread among different clusters and the possible galaxy field contamination. Bearing in mind such biases, we can nevertheless follow a statistical approach to investigate their color distribution and ages. The youngest MC clusters (40 Myr, SWB type I) have between 0.4 and 0.8, with a peak distribution around 0.6 - 0.7 (see Fig. 9, top panel). The SSCs B and #30, whose near-IR luminosity is dominated by the red supergiants, have indeed such colors. The SSC A1 is at the border line, while A2 is definitively too blue to fit into this category. This classification agrees quite well with the age sequence we established before for the four clusters. The MC clusters with ages between 40 and 100 Myr (SWB type II,III) have on average slightly bluer , with a peak around 0.4 - 0.5, since less massive red stars contribute to their IR luminosity, hence some contamination by a warmer component can be possible. Older MC clusters (SWB type IV, V, VI) with ages between a few hundred Myr and a few Gyr show a peak around . The spread is much larger because stochastic effects become more important in this age range. Finally, the oldest (and possibly most metal-poor; Sagar & Pandey 1989) MC clusters of SWB type VII have .
The majority of the 20 candidate clusters identified in our NIC2 field of NGC 1569 have colors consistent with SWB type I MC clusters (i.e., they are RSG dominated), or with much older ones (SWB type IV,V,VI). Clusters with ages around 100 Myr seem to be deficient (middle panel of Fig. 9). Furthermore, we cannot exclude that some of the faintest objects with very red colors are massive AGB stars with somewhat contaminated luminosity profiles.
8 Conclusions
FOS UV spectroscopy and NICMOS IR photometry of the most luminous super star clusters in NGC 1569 allow a significant improvement over previous relative age-dating attempts.
The four most luminous clusters A2, A1, B, and #30 form an age sequence from 5 to 30 Myr. A1 and A2 are the two components of the double-cluster A. Most of the total light of A comes from A1, with the fractional contribution of A2 increasing towards shorter wavelengths. The subcomponents are shown to be in slightly different evolutionary stages. A1 is the older of the two clusters and has a significant RSG population. The UV spectrum of A1 and A2 combined reveals an O-star population with an age of less than 5 Myr. The spectroscopy does not provide clues as to whether the O stars are confined in one of the two components. However, if NGC 1569-A behaves like a typical high-mass star-forming region, the O population is anti-correlated with the RSGs, and is therefore located in cluster A2. The archetypal giant H II region 30 Doradus with its central cluster R136 can serve as a well studied nearby test case. Both hot and cool massive stars are found in 30 Doradus but they are separated on scales of a few pc. No RSGs are observed at the formation site of the youngest O- and WR stars, and vice versa, such hot stars are absent in Hodge 301, the cluster containing RSGs (Walborn 1984). If R136 were observed at a distance corresponding to NGC 1569, both the O-star and the RSG population would coincide spatially.
While the FOS spectroscopy lacks the spatial resolution for a definitive answer, HST WFPC2 He II imagery by Buckalew et al. (2000) clearly demonstrated an anti-correlation of the light from RSGs and WR stars. This is consistent with observations in the Magellanic Clouds: WR stars of type WNL and O stars are always observed together in metal-poor clusters and OB associations (Massey et al. 1995), but not in the vicinity of RSGs. It is therefore highly plausible that the O-star population in NGC 1569-A coincides with the WR population, which in turn is anti-coincident with the RSGs. This then implies that cluster A1 is older and contains RSGs, and A2 is younger and hosts the O- and WR population. NGC 1569-B and cluster #30 are older and fully dominated by red supergiants, as indicated by their red IR colors. The former is at the peak of the RSG phase (10 Myr), while the latter, with redder optical colors, is slightly older, close to the end of this evolutionary stage (30 Myr).
The four SSCs also provide a significant fraction (25%) of the total UV and IR light in the central region of the galaxy, suggesting that highly efficient star formation per unit area occurs in stellar clusters.
From a comparison of the optical to IR mass-to-light ratios in NGC 1569-A1 with evolutionary synthesis models, we find that a standard Salpeter IMF with lower mass cutoff down to the hydrogen-burning limit is consistent with the data. Unless gravitational forces lead to cluster disruption, NGC 1569-A1 can evolve into a system whose properties are quite similar to those of present-day globular clusters.
Other candidate stellar clusters, less luminous than the four SSCs discussed above, have been identified in the central region of NGC 1569. They span a wide range of ages, even though the majority of them have near IR colors more consistent with a dominant, young stellar population in the RSG phase. In that respect the clusters in NGC 1569 resemble the populous young clusters in the Magellanic Clouds.
References
- (1)
- (2) Aloisi, A. et al. 2001, AJ, 121, 1425
- (3)
- (4) Arp, H., & Sandage, A. 1985, AJ, 90, 1163
- (5)
- (6) Bica, E., Alloin, D., & Santos, J. F. C. Jr. 1990, A&A, 235, 103
- (7)
- (8) Brocato, E., Castellani, V., Raimondo, G., & Romaniello, M. 1999, A&AS, 136, 65
- (9)
- (10) Buonanno, R., Buscema, G., Corsi C.E., Ferraro, I., & Iannicola, G. 1983, A&A, 126, 278
- (11)
- (12) Buckalew, B. A., Dufour, R. J., Shopbell, P. L., & Walter, D. K. 2000, AJ, 120, 2402
- (13)
- (14) Calzetti, D. 1997, AJ, 113, 162
- (15)
- (16) Cerviño, M., & Mas-Hesse, M. J. 1994, A&A, 284, 749
- (17)
- (18) Chiosi, C., Bertelli, G., Bressan, A., & Nasi, E. 1986, A&A, 165, 84
- (19)
- (20) Della Ceca, R., Griffiths, R. E., Heckman, T. M., & MacKenty, J. W. 1996, ApJ, 469, 662
- (21)
- (22) De Marchi, G., Clampin, M., Greggio, L., Leitherer, C., Nota, A., & Tosi, M. 1997, ApJ, 479, L27
- (23)
- (24) de Mello, D. F., Leitherer, C., & Heckman, T. M. 2000, ApJ, 530, 251
- (25)
- (26) Frogel, J., Mould, J., & Blanco, V. M. 1990, ApJ, 352, 96
- (27)
- (28) Girardi, L., & Bica, E. 1993, A&A, 274, 279
- (29)
- (30) González Delgado, R. M., Leitherer, C., Heckman, T., & Cerviño, M. 1997, ApJ, 483, 705
- (31)
- (32) Greggio, L., Tosi, M., Clampin, M., De Marchi, G., Leitherer, C., Nota, A., & Sirianni, M. 1998, ApJ, 504, 725
- (33)
- (34) Greve, A., Becker, R., Johansson, L. E. B., & McKeith, C. D. 1996, A&A, 312, 391
- (35)
- (36) Heckman, T. M., & Leitherer, C. 1997, AJ, 114, 69
- (37)
- (38) Holtzman, J. A., Burrows, J., Casertano, S., Hester J., Trauger, J. T., Watson, A. M., & Worthey, G. 1995, PASP, 107, 1065
- (39)
- (40) Ho, L. C., & Filippenko, A. V. 1996a, ApJ, 466, L83
- (41)
- (42) ——. 1996b, ApJ, 472, 600
- (43)
- (44) Hunter, D. A., Hawley, W. N., & Gallagher, J. S. 1993, AJ, 106, 1826
- (45)
- (46) Hunter, D. A., O’Connell, R. W., Gallagher, J. S., & Smecker-Hane, T. A. 2000, AJ, 120, 2383
- (47)
- (48) Kinney, A., Bohlin, R. C., Calzetti, D., Panagia, N., & Wyse, R. F. G. 1993, ApJS, 86, 5
- (49)
- (50) Israel, F. P., & van Driel, W. 1990, A&A, 236, 323
- (51)
- (52) Leitherer, C., & Heckman, T. M. 1995, ApJS, 96, 9
- (53)
- (54) Leitherer, C., Leão, J. R. S., Heckman, T. M., Lennon, D. J., Pettini, M., & Robert, C. 2001, ApJ, 550, 724
- (55)
- (56) Leitherer, C., Robert, C., & Heckman, T. M. 1995, ApJS, 99, 163
- (57)
- (58) Leitherer, C., Vacca, W. D., Conti, P. S., Filippenko, A. V., Robert, C., & Sargent, W. L. W. 1996, ApJ, 465, 717
- (59)
- (60) Leitherer, C. et al. 1999, ApJS, 123, 3
- (61)
- (62) Maeder, A., & Meynet, G. 1994, A&A, 287, 803
- (63)
- (64) Massey, P., Lang, C., Degioia-Eastwood, K., & Garmany, C. D. 1995, ApJ, 438, 188
- (65)
- (66) Mathis, J. S. 1990, ARA&A, 28, 37
- (67)
- (68) McQuade, K., Calzetti, D., & Kinney, A. L. 1995, ApJS, 97, 331
- (69)
- (70) Meynet, G., Maeder, A., Schaerer, D., & Charbonnel, C. 1994, A&AS, 103, 97
- (71)
- (72) Meurer, G. R., Heckman, T. M., Leitherer, C., Kinney, A., Robert, C., & Garnett, D. R. 1995, AJ, 110, 2665
- (73)
- (74) Moore, C. E. 1950, An Ultraviolet Multiplet Table (Washington: US Government Printing Office)
- (75)
- (76) O’Connell, R. W., Gallagher, J. S., & Hunter, D. A. 1994, ApJ, 433, 65
- (77)
- (78) Oliva, E., & Origlia, L. 1998, A&A, 332, 46
- (79)
- (80) Origlia, L., Goldader, J. D., Leitherer, C., Schaerer, D., & Oliva, E. 1999, ApJ, 514, 960
- (81)
- (82) Origlia, L., & Leitherer, C. 2000, AJ, 119, 2018
- (83)
- (84) Persson, S., Aaronson, M., Cohen, J., Frogel, J., & Matthews, K. 1983, ApJ, 266, 105
- (85)
- (86) Prada, F., Greve, A., & McKeith, C. D. 1994, A&A, 288, 396
- (87)
- (88) Rieke, G. H., & Lebofsky, M. J. 1985, ApJ, 288, 618
- (89)
- (90) Robert, C., Leitherer, C., & Heckman, T. M. 1993, ApJ, 418, 749
- (91)
- (92) Sagar, R.,& Pandey, A. K. 1989, A&AS, 79, 407
- (93)
- (94) Santos, J. F. C., & Frogel, J. A. 1997, ApJ, 479, 764
- (95)
- (96) Schaerer, D., & Vacca, W. D. 1998, AJ, 497, 618
- (97)
- (98) Searle, L., Wilkinson, A., & Bagnuolo, W. G. 1980, ApJ, 239, 803
- (99)
- (100) Sternberg, A. 1998, ApJ, 506, 721
- (101)
- (102) Vanbeveren, D. 1999, in IAU Symp. 193, Wolf-Rayet Phenomena in Massive Stars and Starburst Galaxies, ed. K. A. van der Hucht, G. Koenigsberger, & P. R. J. Eenens (San Francisco: ASP), 196
- (103)
- (104) Vanbeveren, D., De Donder, E., Van Bever, J., Van Rensbergen W., & De Loore, C. 1998, New Astronomy, 3, 443
- (105)
- (106) van den Berg, S. 1981, ApJS, 46, 79
- (107)
- (108) Walborn, N. R. 1984, in IAU Symp. 108, Structure and Evolution of the Magellanic Clouds, ed. S. van den Bergh & K. S. de Boer (Dordrecht: Reidel), 243
- (109)
- (110) Waller, W. H. 1991, ApJ, 370, 144
- (111)
- (112) Zepf, S. E., Ashman, K. M., English, J., Freeman, K. C., & Sharples, R. M. 1999, AJ, 118, 752
- (113)
| SSC | (555W)0 | (380W-439W)0 | (439W-555W)0 | (110W-160W)0 | (555W-110W)0 | (439W-160W)0 |
|---|---|---|---|---|---|---|
| A1 | 13.7 | -0.5 | +0.0 | 0.5 | +0.2 | +0.7 |
| A2 | 15.1 | -0.5 | -0.1 | 0.3 | -0.2 | +0.0 |
| B | 14.5 | -0.5 | +0.3 | 0.9 | +1.2 | +2.4 |
| #30 | 16.3 | -0.1 | +0.4 | 0.8 | +1.2 | +2.4 |