Chandra measurements of 3C 220.1’s X-ray core and cluster
Abstract
We report results of an 18 ks exposure with the ACIS instrument on Chandra of the powerful radio galaxy 3C 220.1. The X-ray emission separates into cluster gas of emission-weighted keV and 0.7-12 keV luminosity (to a radius of 45 arcsec) ergs s-1, and unresolved emission (coincident with the radio core). While the extended X-ray emission is clearly thermal in nature, a straightforward cooling-flow model, even in conjunction with a point-source component, is a poor fit to the radial profile of the X-ray emission. This is despite the fact that the measured properties of the gas suggest a massive cooling flow of M⊙ yr-1, and the data show weak evidence for a temperature gradient. The central unresolved X-ray emission has a power-law spectral energy index and 0.7-12 keV luminosity ergs s-1, and any intrinsic absorption is relatively small. The two-point spectrum of the core emission between radio and X-ray energies has = 0.75. Since this is a flatter spectrum than seen in other sources where the X-ray emission is presumed to be radio-related, regions close to the AGN in this source may dominate the central X-ray output, as is believed to be the case for lobe-dominated quasars. Simple unification models would be challenged if this were found to be the case for a large fraction of high-power radio galaxies.
keywords:
galaxies:active – galaxies:clusters:individual: 3C 220.1 – galaxies:individual: 3C 220.1 – radiation mechanisms: non-thermal – X-rays:galaxies1 Introduction
Powerful radio sources of linear size kpc, through their very existence, point to gaseous atmospheres on scales of at least the radio-source diameter. Indeed, evidence suggests that many, and maybe most, such sources have lobe minimum pressures which lie below the external thermal pressure (Hardcastle & Worrall 2000). High-redshift sources are thus useful tracers of galaxy groups and clusters for cosmological studies, and, whereas X-ray selected clusters are biased towards only the more luminous clusters at higher redshift, radio selection should provide a more representative sample of cluster X-ray properties for tests of structure-formation theories and cosmological parameters.
ROSAT pioneered the detection of radio-source atmospheres at high redshift. The best catalogue available for the selection of the most luminous radio galaxies is 3CRR (Laing, Riley & Longair 1983), which is complete to 10.9 Jy at 178 MHz ( and ). There are 38 powerful radio galaxies with linear size kpc at . Of these, 12 were observed in ROSAT pointed observations, and most were detected (Table 1). The most significant detections (3C 220.1, 280, 324, and 294) provided evidence for source extent. The X-ray luminosities in Table 1 assume all the X-rays originate in plasma with 0.3 solar metallicity and 5 keV temperature, except for 3C 220.1 and 280 where a modelled component of compact emission has been subtracted. The total extended luminosity may exceed quoted values since the on-source extraction radii were relatively small (to maximize detection significance).
| Name | inst. | ref | ||
| ergs s-1 | ||||
| 3C 220.1 | 0.61 | HRI | 1,3 | 4.2 |
| 3C 220.3 | 0.685 | PSPC | 2,3,5 | 1.7 |
| 3C 247 | 0.7489 | HRI | 3 | 0.47 |
| 3C 277.2 | 0.766 | PSPC | 3,5 | 0.5 |
| 3C 263.1 | 0.824 | HRI | 3,5 | 8.2 |
| 3C 289 | 0.9674 | HRI, PSPC | 3,4,5 | 1.2 |
| 3C 280 | 0.996 | PSPC, HRI | 2,3,5 | 1.6 |
| 3C 356 | 1.079 | HRI, PSPC | 3,5 | 1.5 |
| 3C 368 | 1.132 | PSPC | 3,4 | 2.1 |
| 3C 324 | 1.2063 | HRI, PSPC | 3,5 | 4.2 |
| 3C 13 | 1.351 | PSPC | 3,5 | 4.2 |
| 3C 294 | 1.781 | HRI | 3,5 | 6.4 |
Refs: 1. Hardcastle et al. (1998); 2. Worrall et al. (1994); 3. Hardcastle & Worrall (1999); 4. Crawford & Fabian (1995); 5. Crawford & Fabian (1996). Ref. 5 contains additional 3C sources not in the complete 3CRR subset
| kpc/ | Galactic NH | J2000 X-ray core position | shift | Date | Screened | ||
|---|---|---|---|---|---|---|---|
| arcsec | (cm-2) | J2000 radio core position | (arcsec) | Exposure (ks) | |||
| 0.620 | 9.0 | 09 32 39.84 | 79 06 31.9 | 0.66 | 1999 Dec 29/30 | 18.121 | |
| 09 32 39.646 | 79 06 31.53 | ||||||
We use km s-1 Mpc-1, , throughout. Radio position (quoted with errors) is based on data shown in Fig. 1.
| 1.874 | 2.995 | 1.395 | 0.4494 | 0.9572 | 0.4931 | 0.8257 | 1.665 | 5.773 | 5.193 | 1.362 | 11.42 |
is in arcsec. The profile is normalized to 1.03 rather than 1.0; this is correct for use with 0.1 arcsec bins and any radial-profile extraction routine which works like iraf/imcnts in considering square pixels as falling entirely in or out of an annulus rather than weighted by area. See Worrall et al. (2001) for more details.
Under unification models, radio-loud quasars are believed to be powerful111isotropic luminosity at 1.4 GHz W Hz-1 radio galaxies whose relativistic jets are at a small angle to the line of sight, and so should be associated with similar X-ray atmospheres. Preliminary confirmation comes from the ROSAT detection of extended X-ray emission around four X-ray-bright 3CRR quasars at (Crawford et al. 1999; Hardcastle & Worrall 1999), one of which (3C 254) is at .
The atmospheres are not the only components of X-ray emission in powerful radio sources. Core-dominated quasars, where the dominant core X-rays are undoubtedly radio related and highly beamed, have a small dispersion of radio to soft X-ray two-point spectral index, , centered around a value of (Worrall et al. 1994; Worrall 1997). In broad emission-line objects, such as lobe-dominated quasars, a smaller is normally seen. This is thought to be due to the fact that in such objects there is little or no steep-spectrum () beamed emission to dominate the flatter spectrum () emission arising from regions close to the AGN. In powerful narrow-line radio galaxies, X-rays from the regions close to the AGN are expected from unification models to suffer high absorption from the torus of gas and dust invoked to obscure the broad emission-line regions, and so any flat-spectrum () component of the emission should be weak. The nearby powerful radio galaxy Cygnus A supports this picture, in that a component of highly absorbed ( cm-2) emission was seen at hard X-ray energies with EXOSAT and Ginga (Arnaud et al. 1987; Ueno et al. 1994) while a significant fraction of the soft core X-ray emission seen with ROSAT could plausibly be radio related with (Worrall 1997). For the powerful radio galaxy 3C 280, where point-like and extended components in the ROSAT data were separated, was measured to be 0.85 (within errors), suggesting it was predominantly radio-jet-related soft X-ray emission which was being detected (Worrall et al. 1994).
Sensitive, high-spatial resolution observations now possible with the Chandra X-ray Observatory (Weisskopf et al. 2000) can probe both the extended and compact emission from high-power radio galaxies, using them as signposts to clusters with significant atmospheres and as a test of unification models. In this paper we report results for the first high-power radio galaxy we have observed with Chandra. 3C 220.1 was selected for study since it was the ROSAT-observed 3CRR radio galaxy with the highest count rate, and the only source other than 3C 280 for which it had been possible to attempt X-ray component separation with the ROSAT data (Hardcastle, Lawrence & Worrall 1998).
2 Chandra Observations
| Energy (keV) | Weight |
| 0.65 | 0.474 |
| 1.35 | 0.343 |
| 2.4 | 0.081 |
| 3.4 | 0.057 |
| 4.5 | 0.021 |
| 5.5 | 0.024 |
We observed 3C 220.1 with the Advanced CCD Imaging Spectrometer (ACIS) on board Chandra on 1999 December 29/30. The target was near the aim point on the back-illuminated CCD chip S3. The observation was made in full-frame mode, and chips S2, S4, I2 and I3 were also active. The data provided to us had been processed using version R4CU4UPD5 of the pipeline software, with subsequent custom processing to alleviate the effect of a large (about 8 arcsec) positional offset which we reported present in the data (and which was subsequently found to affect all data processed during a roughly 7 week period). We followed the “science threads” from the Chandra X-ray Center (CXC) for CIAO v 1.1.5 to make the recommended corrections to these data, and in particular to apply the appropriate gain file, acisD1999-09-16gainN0004.fits. After screening out about 10 per cent of the observation to avoid intervals of high background, the exposure time was 18.121 ks. The radio core position is known with high precision (Table 2). The separation of the X-ray core position and the radio position is 0.66 arcsec, within the astrometric accuracy of Chandra (see http://asc.harvard.edu/mta/ASPECT/).
We followed the procedure described in Worrall, Birkinshaw & Hardcastle (2001) to find an analytical description of the Point Response Function (PRF) appropriate to our observation of 3C 220.1. The CXC-released PRF library was used to create an image of the PRF appropriate to the chip position and energy weighting of counts from the central region of 3C 220.1. The same analytical function as used in Worrall et al. (2001) was found to give a good fit to the radial profile extracted from the PRF image, and the fitted parameter values are given in Table 3. The energy weightings are in Table 4. The resulting profile has a half power diameter (HPD) of 0.8 arcsec, and full width half maximum (FWHM) of 0.58 arcsec. A slightly greater fraction of the PRF is in the large-scale wings than for the low-power radio galaxies from the B2 sample for which PRF parameters are given in Worrall et al. (2001); this is due to 3C 220.1’s harder X-ray spectrum.
3 X-rays from the cluster and core

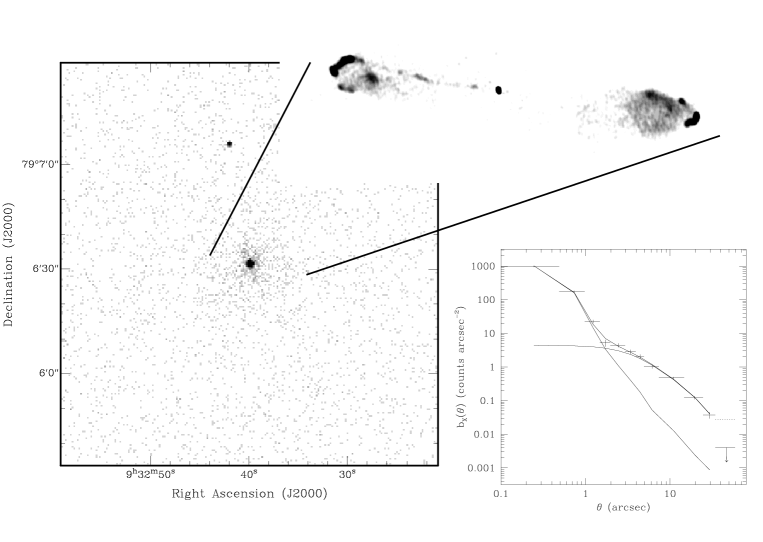
The inference from ROSAT of both point-like and extended X-ray emission in 3C 220.1 (Hardcastle et al. 1998) is verified in a dramatic way with Chandra, visible by eye in the image and confirmed by detailed analysis of the radial profile (Fig. 1). The radial profile is centrally spiked, fitting well the PRF in the inner bins, and extended emission is detected out to a radius of arcsec. The extended emission contributes some noticeable excess in the reference region () which we have used as background for our profile, and this excess is taken into account in the model fitting. As in our ROSAT analysis, we have modelled the radial profile as a composite of the PRF and a model, the form representing gas in hydrostatic equilibrium. The fit is excellent. Fig. 2 illustrates acceptable values of and core radius, , parameters which were poorly constrained with ROSAT. Values and errors for a large set of parameters are listed in Table 5, using the procedure described by Worrall & Birkinshaw (2001) to ensure realistic uncertainties. Our conclusion from ROSAT that the minimum pressures in the radio lobes lie below the external thermal pressure (Hardcastle & Worrall 2000) is confirmed by the Chandra data, and a similar conclusion can be drawn for the 9 arcsec-long eastern jet (see Tables 5 and 6).

Many of the source parameters rely not only on the spatial modelling of the components, but also their spectra. Since the unresolved component is so strong, a radius of 2 arcsec marks a reasonable boundary between regions dominated by the central component and those dominated by the extended emission. The extended emission gives a good fit to thermal emission seen through Galactic absorption (Fig. 3), and no significant improvement in the fit () is obtained if the absorption is allowed to be a free parameter. The X-ray spectrum alone does not require a thermal origin: no obvious X-ray line features are seen, and the spectrum can be fit with a power law of photon index () and an absorption of cm-2, in excess of the Galactic value (Table 2). However, the radial symmetry of the emission rules out a non-thermal origin related to the relativistic particles in the radio jets and lobes, and we conclude that the emission is undoubtedly predominantly thermal in origin. Independent support for the presence of a galaxy cluster arises from the luminous gravitational lens arc originally detected in an optical ground-based image (Dickinson 1994) and now known from HST data to have a redshift of (M. Dickinson, private communication, 1997).

Any attempt to fit the central emission to a single-temperature thermal model finds abundances of zero and a very hot temperature of greater than about 9 keV. Indeed, the spectrum is harder than that of the diffuse X-ray emission (as verified by a colour image of the field), and fits well a power law with modest intrinsic absorption (Fig. 4). Ota et al. (2000) measured the total emission within a radius of 3 arcmin in a 40 ks ASCA exposure to have a temperature of keV (90 per cent confidence for one interesting parameter), which is in good agreement with our results (Fig. 3) despite the non-negligible contamination of the central point-source emission in the ASCA spectrum: the point source provides 46 per cent of the 0.3-8 keV Chandra counts over the same region.


There is some evidence that the temperature of the gas increases to larger radius, as shown in Fig. 5. Taking counts only in an annulus of radii 10 and 45 arcsec, we find an emission-weighted of 8.5 keV (with a 90 per cent uncertainty range for one interesting parameter of 6.2 to 12.2 keV) which is hotter than the overall emission-weighted value shown in Fig 3. A temperature gradient would be expected from a cooling flow, and the cluster around 3C 220.1 should exhibit a massive one, with the gas in the -model estimated to have a cooling time of yr at a radius of 15.5 arcsec (Table 5). However, our fits to a straightforward cooling-flow model (Hardcastle, Worrall & Birkinshaw 1999) in combination with a point source are very bad, and too spiked for the Chandra radial profile (Fig. 6). The poorer angular resolution of ROSAT did not provide such strong constraints, and a 30 per cent contribution to the central emission from such a cooling-flow model (roughly the situation shown in Fig. 6) could not be ruled out with ROSAT. The temperature structure of the gas must be complicated, so that the statistics of the current Chandra data are inadequate to provide a detailed picture.
The core X-ray emission is even brighter than in our ROSAT models for the source. When we use the core counts from our two-component modelling of the ROSAT data, taking into account the rather large uncertainties, and use a range of spectral parameters within the inner contour shown in Fig. 4, we predict Chandra counts in 0.3–8 keV (90 per cent uncertainties). Despite this large uncertainty range, the probability of the predicted counts and the observed counts (Table 5) being the same is less than 1 per cent, suggesting variability over the four-year interval between the ROSAT and Chandra observations. In contrast, a similar test for the extended component finds agreement within errors, as expected.
Using our Chandra core measurement combined with data in Table 6, we find a value for (as defined in Table 5) of 0.75. This is less than for other powerful radio galaxies and core-dominated quasars (see section 1), suggesting perhaps that regions close to the AGN dominate the central output, as is believed to be the case for lobe-dominated quasars (Worrall et al. 1994). The new high-resolution radio data for the source (kindly provided by Guy Pooley; Fig. 1) reveal one-sided jet emission with a jet to counter-jet ratio of , so that it is possible we are seeing the X-ray emission from the vicinity of the AGN directly. Assuming a jet speed of , as statistical results for sources at comparable redshift suggest (Wardle & Aaron 1997), the angle of the jet to the line of sight should be less than degrees. The X-ray-measured intrinsic absorption is relatively low (Fig 4), consistent with expectations from the dusty medium which HST finds to be typical in lower-power radio galaxies like NGC 6251 (Ferrarese & Ford 1999). It is very different from the case of Cygnus A (see section 1), where the component of X-ray emission believed to be associated with regions close to the central black hole is seen only through a large absorbing column. Such a low column density in 3C 220.1, coupled with X-ray emission which is abnormally bright to be associated with the radio components, suggests that our line of sight does not significantly intersect a torus. The torus may be absent, in contradiction to unified models, but if it is present the geometry must be such as to obscure a strong nuclear optical continuum (not evident in HST images; McCarthy et al. 1997) while allowing us to see nuclear X-ray emission.
A major advance with Chandra has been the routine detection of X-rays from kpc-scale jets, but no such emission is evident from the eastern radio jet in 3C 220.1. The jet in the quasar PKS 0637-752, which is at a similar redshift to 3C 220.1, has an of 0.9, based on data in Chartas et al. (2000) for the X-ray brightest region of knot WK7.8. With such an applied to the 9 arcsec-long radio jet of 3C 220.1 (Table 6), we estimate 35 counts for the entire region of the jet in the Chandra observation. This corresponds to 6.6 cts arcsec-2, and from the radial profile in Fig. 1 we see this would have poor contrast against the extended thermal emission, particularly in the inner jet regions where X-ray emission is more likely to be seen. The outer radio knot at 6.3 arcsec from the core contains about 2.8 mJy of the jet flux density at 8.4 GHz, and is undetected in our X-ray data. The corresponding limit on the radio to X-ray spectral index is .
Similarly we might question why the radio hotspots in 3C 220.1 are not detected with Chandra, but the simplest assumption of equipartition between the magnetic-field and electron energy densities leads to estimates of 0.15 and 0.25 counts for the eastern and western hotspots, respectively.
Despite the relatively small sky coverage of the Chandra observation, square arcmin, a second bright diffuse X-ray source is present. Centered off-axis (in the S2 chip), at about J2000 9 31 01.46, 79 13 27.8, the emission is of similar surface brightness to 3C 220.1’s cluster but covers a larger angular region. An over-density of galaxies on deep sky survey plates suggests this emission is associated with a less distant cluster, of redshift between about 0.2 and 0.3.
| Parameter | Value | Notes |
| Core Counts 0.3-8 keV | a | |
| , | 0.7, cm-2 | b |
| Core | ergs s-1 | b |
| Core | ergs s-1 | b |
| Core | 44 nJy | b |
| Core | 0.75 | h |
| -model counts 0.3-8 keV, | a, c | |
| -model counts 0.3-8 keV, | a, c | |
| , abundance/solar | 4.6 keV, 0.16 | d |
| -model , | 5.6 ergs s-1 | d |
| -model , | 3.4 ergs s-1 | d |
| a, e | ||
| a, e | ||
| Central gas density | cm-3 | f |
| Gas density at | cm-3 | f |
| Central gas pressure | Pa | f |
| Gas pressure at | Pa | f |
| Central gas cooling time | yr | f |
| Cooling radius | arcsec | f, g |
| M⊙/yr, | f |
Notes: a. Errors for 2 interesting parameters; b. Best-fit spectral parameters from Fig. 4; c. -model counts per unit area per unit time ; d. Best-fit spectral parameters from Fig. 3; e. and highly correlated (see Fig 2); f. Errors for 1 interesting parameter; g. radius at which cooling time is 1010 yr; h. .
| Parameter | Value |
|---|---|
| Core | mJy |
| Jet | 7.9 mJy |
| Jet length | 9 arcsec |
| Jet radius | 0.3 arcsec |
| Counter Jet | mJy |
| 2.6 Pa | |
| Western Lobe | 1.2 Jy |
| Lobe length | 12 arcsec |
| Lobe radius | 3.5 arcsec |
| 1.2 Pa |
8.4 GHz data are from map shown in Fig. 1 and lobe measurements use the 1.4 GHz data of Harvanek & Hardcastle (1998). Minimum pressures assume an electron energy spectrum of number index 2.0 between and and the jet value is not corrected for possible effects of relativistic beaming and projection (see text)
4 Conclusions
The Chandra data for 3C 220.1 have strikingly confirmed our modelling of the ROSAT data for the source as a composite of point-like and extended emission, and have measured the spectral parameters of the extended and compact components with reasonable accuracy. The pressure in the X-ray emitting gas exceeds the minimum pressures both in the lobes and kpc-scale jet, and the results bode well for using powerful high-redshift radio galaxies as tracers of galaxy groups and clusters for tests of structure-formation theories and cosmological parameters.
There is an unsettled question pertaining to the structure of the gas around 3C 220.1; the emissivity suggests a large cluster-scale cooling flow, and yet the break at the boundary between the compact and extended emission in Fig. 1 is too sharp for a straightforward cooling-flow model. This suggests that the picture of the atmosphere as slowly cooling near a state of hydrostatic equilibrium is incorrect unless the atmosphere is relatively young, so that a massive cooling flow has not yet been established. Alternatively, a central input of mechanical energy (from the expanding radio lobes or a merger) might be disrupting the cooling flow. In either case, the X-ray emission should be irregular in appearance — although this is not supported by the radial profile, the statistics in the two-dimensional image (Fig. 1) are not good enough to exclude such possibilities.
The X-ray core emission is bright, with an closer to that of lobe-dominated quasars than to that of core-dominated quasars, where the core X-ray emission is dominated by a beamed component related to the radio emission, or to that of powerful narrow-line radio galaxies, where the core X-ray emission suffers high absorption. This suggests that in 3C 220.1, regions close to the black hole may dominate the central X-ray output. Simple unification models would be challenged if this were found to be the case for a large fraction of high-power radio galaxies, since the models predict that the central X-ray emission should be seen only through large absorption, with a large deficit of photons at soft X-ray energies. Chandra observations of carefully selected samples of high-power radio galaxies can test these models.
Acknowledgments
We are grateful to Guy Pooley for kindly providing the 8.4 GHz VLA A and B array data for 3C 220.1. We thank staff of the CXC for help concerning calibrations and the ciao and ds9 software.
References
- [] Arnaud, K.A., Johnstone, R.M., Fabian, A.C., Crawford, C.S., Nulsen, P.E.J., Shafer, R.A., Mushotzky, R.F. 1987, MNRAS, 227, 241
- [] Chartas, G. et al. 2000, ApJ, 543, 655
- [] Crawford, C.S., Fabian, A.C., 1995, MNRAS, 273, 827
- [] Crawford, C.S., Fabian, A.C., 1996, MNRAS, 282, 1483
- [] Crawford, C.S., Lehmann, I., Fabian, A.C., Bremer, M.N., Hasinger, G., 1999, MNRAS, 308, 1159
- [] Dickinson, M. 1994, Ph.D. thesis, University of California, Berkeley.
- [] Ferrarese, L., Ford, H.C., 1999, ApJ, 515, 583
- [] Hardcastle, M.J., Worrall, D.M., 1999, MNRAS, 309, 969
- [] Hardcastle, M.J., Worrall, D.M., 2000, MNRAS, 319, 562
- [] Hardcastle, M.J., Lawrence, C.R., Worrall, D.M., 1998, ApJ, 504, 743
- [] Hardcastle, M.J., Worrall, D.M., Birkinshaw, M., 1999, MNRAS, 305, 246
- [] Harvanek, M., Hardcastle, M.J., 1998, ApJS, 119, 25
- [] Laing, R.A., Riley, J.M. & Longair, M.S. 1983, MNRAS, 204, 151
- [] McCarthy, P. J., Miley, G.K., de Koff, S., Baum, S.A., Sparks, W.B., Golombek, D., Biretta, J., Macchetto, F. 1997, ApJS, 112, 415
- [] Ota, N., Mitsuda, K., Hattori, M., Mihara, T., 2000, ApJ, 530, 172
- [] Ueno, S., Koyama, K., Nishida, M., Yamauchi, S., Ward, M. 1994, ApJ, 431, L1
- [] Wardle, J.F.C., Aaron, S.E., 1997, MNRAS, 286, 425
- [] Weisskopf, M.C., Tananbaum, H.D., Van Speybroeck, L.P. & O’Dell, S.L. 2000, in Trümper, J.E., Aschenbach, B., eds, Proc. SPIE Vol. 4012, X-Ray Optics, Instruments, and Missions III, p. 2
- [] Worrall, D.M. 1997, in M. Ostrowski et al. eds., Relativistic Jets in AGNs, Astronomical Observatory of the Jagiellonian University, Krakow, p. 20
- [] Worrall, D.M., Birkinshaw, 2001, ApJ, 551, 178
- [] Worrall, D.M., Lawrence, C.R., Pearson, T.J., Readhead, A.C.S., 1994, ApJ, 420, L17
- [] Worrall, D.M., Birkinshaw, M., Hardcastle, M.J., 2001, MNRAS, submitted