AGN: The High-Energy Status before INTEGRAL
Abstract
Much progress in the knowledge of the high-energy emission (50 keV) from Active Galactic Nuclei has been made during the last decade, predominately by the experiments aboard the Compton Gamma-Ray Observatory. After the end of the CGRO mission and prior to the upcoming INTEGRAL mission the current status of high-energy emission properties and scenarios is summarized for different AGN classes. In addition, prospects for INTEGRAL observations of AGN are given.
keywords:
AGN: high energy emission; blazars; Seyfert galaxies; radio galaxies1 Introduction
Considerable progress on our knowledge about Active Galactic Nuclei (AGN) was made during the last decade, e.g., in the optical by the Hubble Space Telescope, by several new missions in the X-ray domain (e.g., ROSAT, ASCA). A lot of progress was also achieved at even higher photon energies in the -ray domain, in particular by the experiments aboard the Compton Gamma-Ray Observatory (CGRO) (50 keV to 20 GeV) and by improved ground-based Cherenkov telescopes at energies above several hundreds of GeV. In this paper I shall try to briefly summarize the current status of our knowledge on AGN at -ray energies by describing their observational properties and the anticipated emission scenarios. Because the launch of the INTEGRAL mission is on the horizon, I shall also mention some prospects for the INTEGRAL experiments.
Roughly 3% of all galaxies are classified as being ‘active’. Although there is no overall agreement amongst astronomers about a precise definition of active galaxies, one common criterion is the generation of large luminosities in small core regions. In many cases (e.g., quasars) the active and bright core overshines the remaining galaxy by far. A large number of classes and sub-classes exist, which developed historically and sometimes overlap in their parameters.
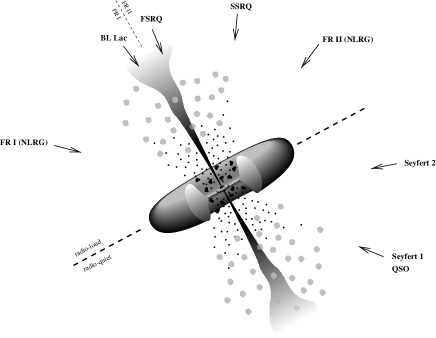
The ‘unification-by-orientation’ scenario assumes that all AGN are intrinsically similar. At the very center there is a supermassive black hole (106 to 10), which accretes matter from an accretion disk. This central region is surrounded by an extended molecular torus and moving gas clouds. In addition to these clouds a hot electron corona populates the inner region. In a radio-loud AGN a strong jet of relativistic particles emanates perpendicular to the plane of the accretion disc. The generation of such jets is still not understood; however, it is believed that strong magnetic fields play a fundamental role. The ‘unification-by-orientation’ scenario assumes such a general structure for all AGN. Depending on the spatial orientation with respect to our line of sight we observe the different types of AGN (Fig. 1; for a full discussion see e.g., Urry & Padovani 1995). If we look towards the ‘central engine’ along the jet axis (10o), i.e., basically directly into the jet, we observe a blazar. A regular quasar or a Seyfert-1 galaxy is observed if we look at an offset angle of the order of 30o, at which both the narrow-line and broad-line regions are visible. At larger angular offsets the broad-line region will be hidden by this extended molecular torus giving rise to Seyfert-2 galaxies. A typical radio galaxy, showing two strong opposite jets, is observed at angles approximately perpendicular to the jet axis.
Prior to the launch of CGRO in April 1991 the extragalactic -ray sky was largely unknown. Only the quasar 3C 273 had been detected significantly as an emitter of -radiation at energies above 50 MeV by the COS-B satellite (Swanenburg et al., 1978). For three more sources the detection of -rays up to 20 MeV had been reported. However, these measurements resulted from short-duration balloon flights and contained large systematic uncertainties. Now, after CGRO, about 100 AGN (the number depends on the assumed detection threshold level) are detected by the different CGRO instruments at energies above 50 keV: 90 blazars, 25 Seyfert galaxies, and 1 radio galaxy. These detections opened the field of extragalactic -ray astronomy and astrophysics and, in addition, provided an important step in the understanding of AGN physics in general. In the following I shall briefly summarize the -ray status for the different AGN types.
2 Blazars
2.1 ‘EGRET-type’ Blazars
The detection of many blazars at -ray energies above 100 MeV by the EGRET experiment aboard CGRO finally opened the field of extragalactic -ray astronomy. Blazars are radio-loud quasars or BL Lac objects which show a flat radio spectrum, strong and rapid variability in optical and radio bands, and strong optical polarization. Although the blazar 3C 273 had been discovered at these energies by COS-B about 25 years ago (Swanenburg et al., 1978), the detection of so many sources came as a surprise. Roughly 90 blazars are now detected by EGRET (Hartman et al., 1999), 10 of them are also observed at MeV -rays (0.75 - 30 MeV) by the COMPTEL experiment (Collmar et al., 1999a), and also 10 by the OSSE experiment (Kurfess, 1996), mainly at hard X-ray to soft -ray energies (50 keV to 500 keV). The term ‘EGRET-type’ refers to blazars which are prominent in the energy range from 1 MeV to a few GeV.
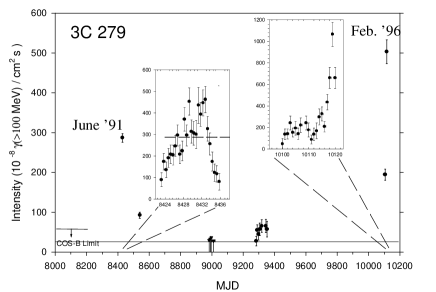
The -ray fluxes of blazars are found to be highly time variable, even on time scales as short as one day and less, showing flux variations up to a factor of 100. Fig. 2, as an example, shows the long-term light curve of 3C 279 as observed by EGRET at energies above 100 MeV. Large flux variations as well as short-term variability is clearly seen. The individual CGRO instruments measure spectra which typically can be represented by power-law shapes. However, if the spectra are combined a spectral turnover from a softer shape at high-energy -rays (100 MeV) to a harder shape at hard X-rays (50 keV) becomes often visible. This spectral turnover occurs at MeV energies (as an example see Fig. 3). By assuming isotropic emission, typical -ray luminosities of the order of 1048 erg/s with maxima up to several 1049 erg/s are derived (e.g., Mattox et al., 1997; Collmar et al., 1997). Keeping in mind that the bolometric luminosity of our ‘Milky Way’ is 1044 erg/s, blazars are spectacular objects, which are solely in -rays as luminous as thousands of galaxies, and can even switch on and off such luminosities on time scales of a day and less.
Comparison of -ray emission with that in other observing bands seems to be most illuminating in the form of spectral energy distribution (SED) plots of Fν as a function of frequency. Such figures show the relative amounts of power radiated in equal logarithmic frequency bands, and therefore provide the possibility to identify the major emission components. Two such spectra (for the blazars 3C 273 and 3C 279) are shown in Fig. 3. 3C 273 is bright at all wavelength regions and therefore is probably the best-studied blazar. First of all its SED proves that the high-energy emission (X to -rays) is a significant part of the bolometric luminosity. The spectrum shows (probably) four maxima indicating different emission components and processes, which are interpreted as synchrotron emission from relativistic electrons in the radio- and far-IR band, thermal emission from a dust torus in the IR and from an accretion disk in the UV (‘blue bump’), and inverse-Compton radiation generated by relativistic electrons and soft photons at X and -rays. In contrast to 3C 273 (z = 0.158), the simultaneous multifrequency spectra of the blazar 3C 279 (z = 0.538) shows probably only two maxima. One is in the radio/infrared region and one is in the -ray band, which, at least during -ray flaring events, clearly dominates the overall power output (Fig. 3). The spectrum is interpreted to be completely of non-thermal origin with only two visible emission mechanisms at work: synchrotron emission from radio to UV/soft X-rays and inverse-Compton emission from X-rays to -rays. The thermal signatures are not visible. Probably they are outshone by the dominance of the non-thermal radiation.


Lower panel: Broad-band spectra of 3C 279 for different times and different -ray flux states (from Collmar et al., 2000). Only two emission maxima are visible which are interpreted to be due to two non-thermal emission processes: synchrotron radiation from radio to UV/X-rays and IC emission from UV/X-rays to -rays. The thermal emission components are probably outshone by the dominance of the non-thermal ones.
2.2 TeV Blazars


The lower panel shows multifrequency spectra of Mkn 501 for two observational periods (TeV-quiet and flaring), which are supplemented by archival data (Catanese and Weekes, 2000). The curves in the figures are spline functions and do not represent proper model fits. They are meant to guide the eye for the anticipated broad-band spectrum of Mkn 501. It is obvious that during the TeV flaring period in April 1997 the TeV flux as well as the X-ray flux increased significantly compared to the TeV quiescent period in March 1996.
During the last decade a significant improvement in detector sensitivity was achieved for the Atmospheric Cherenkov Telescopes (ACTs) which measure photons at energies between 300 GeV and 10 TeV, in the so-called VHE (very high energy) band. Up to now, 6 sources (e.g., Weekes, 2000) have been reported to emit at these energies. The most prominent ones are Markarian (Mkn) 421 and Mkn 501 which were both detected several times by several groups (e.g., Whipple collaboration, HEGRA collaboration). Due to these multiple and significant detections both sources are well studied at TeV energies: Both blazars are time variable and show strong flaring activity with flux-doubling times as low as 15 minutes (Gaidos et al., 1996). Fig. 4 shows the long-term light curve of Mkn 501, which indicates quiescent and flaring periods. The VHE spectra are different for both sources. The one of Mkn 421 shows no obvious cutoff either at the lower or the upper end (e.g., Krennrich et al., 1999; Aharonian et al., 1999), and therefore is well represented by a power-law model. The spectrum of Mkn 501 in contrast, clearly shows a curved shape (e.g., Samuelson et al., 1998) during strong flaring events (see Fig. 4). This spectral difference is surprising because both sources belong to the same class of objects, X-ray selected BL Lacs (XBLs), and have roughly the same distance. Most likely the different spectra point to different intrinsic properties.
Multifrequency observations of both Mkn 421 and Mkn 501 indicated a connection between the TeV and X-ray band (e.g., Buckley et al., 1996; Catanese et al., 1997). Flares seem to occur simultaneously, but with larger amplitudes at TeV-energies. Surprisingly, both sources are weak -ray emitters in the MeV/GeV range. This is well illustrated by broad-band spectra, which during TeV-flares (making the measurement of a spectrum possible at these energies) show the same two-peak spectra as the usual EGRET-type blazars. However, both maxima are shifted to higher energies (Fig. 4). One appears in the X-ray or occasionally even in the hard X-ray band and the other one in the TeV-range.
INTEGRAL measurements will cover the decreasing part of the synchrotron spectrum and the ‘flux valley’ between the two peaks (Fig. 5). Correlated measurements with the new-generation ACTs, which will have lowered energy thresholds of 50 GeV and which will become operational in 2001/2, have the potential to improve our knowledge on the emission processes in these sources. In particular, they will distinguish between intrinsic source properties and photon propagation effects, i.e., whether the curved TeV spectra of Mkn 501 are intrinsically generated or are due to energy-dependent photon absorption between the sources and us.

2.3 Interpretation
The large -ray luminosities of blazars together with the observed short-term variability imply a highly compact emission region of the -ray radiation. For an isotropic luminosity of 1048 erg/s and a radius of 1 light day, as observed in 3C 279 for example, an optical depth for pair production of 200 is derived. This simply means that -rays cannot escape without generating electron-positron pairs. Nevertheless, these -rays are observed! This contradiction is resolved if emission from a relativistic jet is considered instead of central isotropic emission which was assumed in the example above. A jet origin of the observed -rays is consistent with 1) the fact that for many blazars superluminal motion has been observed, which is indicative of jets with a small offset angle to our line-of-sight, and 2) the redshift distribution of these sources, which shows that the source distance is not the critical parameter for their detection, because -ray blazars are observed far out into the universe up to redshifts of z=2.3. A relativistic jet origin of the -rays would imply beamed emission. The beamed emission has another effect: the observed -ray luminosity overestimates the internal generated luminosity by a factor of up to 104 due to relativistic Doppler boosting of the emitted photons. Therefore internally the optical depth for pair production is well below 1, which is in accord with the observation of these -rays.
Since the CGRO discovery of -ray blazars, the origin of their -ray emission has been widely discussed. As concluded above, isotropic core emission has to be excluded. The favoured scenario to explain the blazar spectral continua is that we are viewing nearly along the axis of a relativistically outflowing plasma jet which has been ejected from an accreting supermassive black hole. This broadband radiation is thought to be produced by non-thermal electron synchrotron radiation in outflowing plasma blobs or shocked jet regions. The high-energy blazar continuum emission appears to constitute a distinct second component in the broadband spectral energy distribution of blazars. Two classes of models have been proposed to explain the blazar -ray radiation, in which either leptons or hadrons are the primary accelerated particles, which then radiate directly or through the production of secondary particles which in turn emit photons.
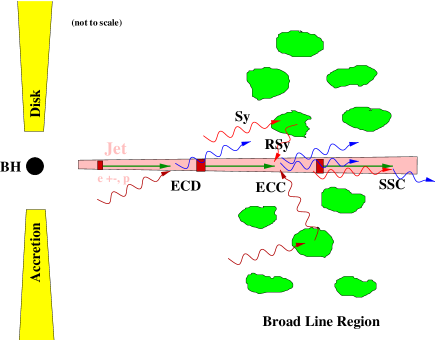
In leptonic models (Fig. 6 sketches the central part of an AGN with a leptonic emission scenario), the -ray emission of blazars is produced by non-thermal relativistic leptons (electrons and positrons) which scatter soft photons to -ray energies via the inverse-Compton (IC) process. These leptonic models come in two flavors depending on the nature of the soft photons. The synchrotron-self Compton models (SSC) assume the SSC process to be dominant (e.g., Maraschi et al., 1992; Bloom and Marscher, 1996). In this process the relativistic electrons moving along the magnetized jet generate synchrotron photons which are boosted by the same relativistic electron population to -ray energies via the IC-process. The IC-spectrum follows to first order the shape of the synchrotron spectrum (just shifted to higher energies), which explains the observed spectral turnover at MeV-energies in the -ray spectra.
The so-called external Compton scattering (ECS) models consider a different origin for the soft photons. They assume the soft X-ray and UV-photons which are radiated from the accretion disk directly into the jet (e.g., Dermer and Schlickeiser, 1993) or scattered into the jet by the broad line region clouds (e.g., Sikora et al., 1994) to be the soft target photons for the relativistic jet electrons. The ECS-models also can reproduce the broad-band non-thermal spectral shape of the -ray blazars. These models explain the spectral bending at MeV-energies by the so called incomplete Compton cooling of the electrons. When a blob of relativistic electrons is injected into the jet, a power-law shaped IC-spectrum is generated with a low and high-energy cutoff in photon energy which correspond to the low - and high-energy cutoffs in the electron spectrum. Because the high-energy photons cool first, the high-energy cutoff in the IC-spectrum moves towards lower energies with time. The electron cooling by the IC-process stops when the blob has moved out into regions where the photon field becomes too thin to maintain this process. Integrating the individual spectra over time generates the spectral turnover at MeV energies observed by CGRO in time-averaged (days to weeks) -ray spectra.
Models have also been proposed in which accelerated hadronic particles (mainly protons) carry the bulk of the energy (e.g., Mannheim & Biermann, 1992; Bednarek, 1993). Because protons do not suffer severe radiation losses, they can be accelerated up to energies of 1020eV, reaching the thresholds for photo-pion production. In these processes the protons transfer energy into photons, pairs, and neutrinos via pion production. The photons and pairs are reprocessed and initiate a cascade through inverse-Compton and synchrotron processes to form a power-law photon spectrum in the end. Electrons and positrons generated via charged pion decay will be accompanied by energetic neutrino production. The detection of a strong neutrino flux from blazar jets would definitively identify hadrons as the primary accelerated particles.
3 Seyferts
3.1 Radio-quiet Seyferts

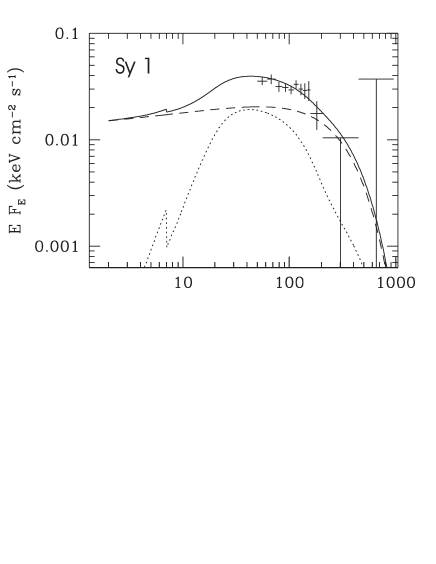
Lower panel: Average spectrum of the Seyfert 1 class as measured with OSSE. The best-fit model (solid line) together with the individual model components are shown throughout the X-ray and hard X-ray band. The dashed curve represents the best-fit thermal Comptonization spectrum and the dotted curve the reflected component including a flourescent Fe K line (from Johnson et al., 1997).
Radio-quiet Seyferts, the standard Seyfert classes 1 and 2, are nearby AGN without strong jets. Prior to CGRO Seyferts were considered to be promising candidates for -ray emission. An extrapolation of their hard power-law spectra measured at X-rays (2 - 20 keV) and hard X-rays (20 keV) into the -ray domain (500 keV) resulted in large -ray fluxes, and subsequently in strong and significant sources for the CGRO instruments. Now, after the end of the CGRO mission, roughly 25 Seyferts are detected by the OSSE (e.g., Johnson et al., 1997) and BATSE experiments (e.g., Bassani et al., 1996; Maliza et al., 1997). The detection occur mainly in the hard X-ray band between 50 and 300 keV. No Seyfert has been ‘seen’ at 1 MeV and above, making them rather hard X-ray than -ray sources (e.g., Maisack et al., 1995).
The brightest and best-studied object is NGC 4151, from which much of the current knowledge is derived. OSSE measured time variability of up to a factor of 2 on long time scales (years) and up to 25% on a day-to-day basis (Johnson et al., 1997). Its spectrum at these energies is well described by a power law which cuts off exponentially (Fig. 7):
| (1) |
where is the photon index, and is the cutoff energy. Such a mathematical shape approximates a thermal Comptonization spectrum. Best-fit values of of 1.6 and of 100 keV are derived. In particular, no (strong) 511 keV pair–annihilation emission is found, which severely restricts emission models for Seyferts. In summary, the OSSE data on NGC 4151 suggest that its high-energy emission is well described by thermal processes. An upper limit of 15% for the contribution of non-thermal processes is derived (Johnson et al., 1997). The results on NGC 4151 are consistent with the results of analysing the sum of several weaker sources (Fig. 7).
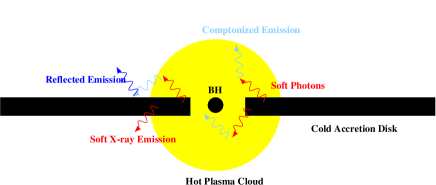
To test emission models for the high-energy emission of Seyferts, combined X-ray and hard X-ray spectra have been compiled. Such spectra from radio-quiet Seyferts are well described by a power–law shape at X-rays which cuts off around 100 keV (as described above), and which is interpreted to be the Comptonized emission from a hot plasma. This primary component is modified by the presence of nearby matter, i.e. a reflection component becomes visible at energies above 10 keV (Fig. 7). A correlation of the strength of the Compton reflection component with the spectral index of the primary emission, the Comptonized one, is found by Zdziarski et al. (2000). This implies that the Comptonizing plasma and the cold medium are connected. Zdziarski et al. (2000) suggest that the cold medium provides the soft photons which are Compton upscattered in the hot plasma.
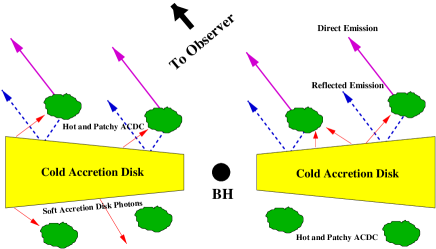
According to current data, two emission geometries appear to be possible (Fig. 8): a patchy corona above a cold accretion disk, and a hot accretion disk with an overlapping cold medium, e.g., a hot inner ADAF-type (advection dominated accretion flow) disk and a cold outer one. Both geometries fulfill the requirement that the reflection component subtends a solid angle less than 2.
INTEGRAL will provide improved measurements of Seyferts in the hard X-ray to -ray band. This will – in particular – result in improved constrains on the contribution of non-thermal processes (i.e., the level of particle acceleration taking place in these sources), and in more sensitive searches for pair annihilation.
3.2 Radio-loud Seyferts
The class of radio-loud Seyferts, which are also called broad-line radio galaxies, is populated by only a few sources. These sources show jets and one member – 3C 120 – even superluminal motion. The spectra at X-ray energies are of power-law shape with an average photon index () of 1.7 (Wozniak et al., 1998). Like the radio-quiet Seyferts these spectra break around 50 - 100 keV to a softer shape, which however, unlike the radio-quiet Seyferts, does not show an obvious cutoff (Fig. 9). It is consistent with a power-law shape of of 2.2 (Wozniak et al., 1998), which might indicate the presence of non-thermal Compton scattering. However, the statistical significance of the OSSE spectra of these sources is well below those of the radio-quiet Seyferts, and therefore this conclusion is only tentative.

More sensitive hard X-ray measurements of these sources are needed to draw improved conclusions. INTEGRAL can provide such measurements, and therefore might be able to decide whether radio-loud Seyferts have a different or the same type of emission scenario than radio-quiet ones. If non-thermal emission would be important in these sources, then they would be a link between the radio-quiet Seyferts and the blazars.
4 Radio Galaxies
Centaurus A (Cen A), the closest (3.5 Mpc) active galaxy, is detected from radio to GeV -rays. It is a unique and interesting object, because it is the only non-blazar AGN detected at MeV-energies and above. Its X to -ray spectrum can be described by different power-law shapes, showing a spectral steepening towards higher energies (Fig. 10). In hard X-rays, the spectrum has the canonical hard power–law shape with photon index 1.7, like the radio-loud and radio-quiet Seyferts. It breaks at 150 keV to a softer power–law shape (2.3) which holds up to 30 MeV, and has to break again (3.3) to match the weak EGRET flux above 100 MeV (Steinle et al., 1998). Since there is no exponential cutoff visible in hard X-rays, resembling the spectra of the radio-loud Seyferts, non-thermal processes are probably operating in this object at these energies. The emission around 1 MeV and above is generally considered to be of non-thermal origin.
The emission scenario of Cen A is unclear. It is still an open question whether we ‘see’ thermal and/or non-thermal emission, and therefore it is still open whether the origin of the emission is located in the nucleus and/or the jet. This might be changing with respect to energy. Because Cen A is viewed from the ‘side’– the angle between its jet axis and our line–of–sight is 70o (e.g., Jones et al., 1996) – the hypothesis of a ‘misdirected’ blazar can be considered. In this case we might observe the intrinsically (not Doppler-boosted) generated -ray luminosity, which is of the order of 1042 erg/s at MeV energies. This MeV luminosity – if viewed close to ‘jet on-axis’ and subsequently Doppler boosted by a factor of 103 - 104 – would place Cen A in luminosity near the weaker blazars detected by COMPTEL.

5 Summary
Substantial progress has been made in the study of AGN at -ray energies during the last decade. Before the launch of CGRO only 4 sources had been reported to emit detectable -rays around 500 keV and above, which led to a vague and patchy knowledge about their emission properties and scenarios. Now, after the end of the CGRO mission, more than 100 sources are detected in the energy band from hard X-rays (50 keV) to GeV -rays by the different CGRO experiments. Even at VHE -rays at least two AGN are convincingly detected and well studied now. Due to these many observations and source detections, a consistent picture has emerged during these years, which is generally understood. However, most details are still unknown.
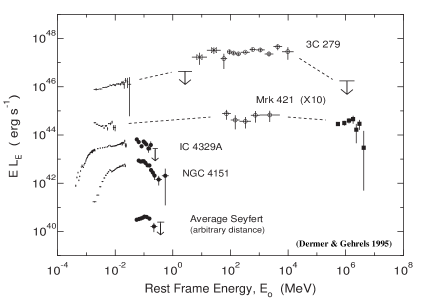
The general picture is, that radio-loud AGN, especially blazars, can occasionally be strong emitters of -ray radiation, which is detectable from MeV to GeV, and for a few sources even to TeV energies. It is generally agreed that this radiation emerges from a relativistic plasma jet and is generated via inverse Comptonization of soft photons by relativistic electrons. On the other hand, radio-quiet sources show the signs of thermally Comptonized spectra, which cut off at energies around 100 keV. This emission is thought to be generated in the central AGN region, i.e. in the vicinity of the putative supermassive black hole. This general picture is shown in Fig. 11, which compares the high-energy luminosity spectra (assuming isotropic emission) of different sources belonging to different source classes. This figure, in fact, allows one to compare the radiated power as a function of energy. The different spectral behaviour of blazars, having non-thermal jet emission, and Seyferts, showing thermal emission from the accretion disk, is obvious. Additionally, the figure shows that the BL Lac type blazar Mkn 421 even maintains its emission into the TeV range.
The recent progress in this field has not only provided new results and answers, but as usual has also posed many new questions. ‘What causes the -ray flares in blazars?’, ‘What kind of emission – thermal and/or non-thermal – do we observe in Cen A and radio-loud Seyferts?’, are only two examples. They can and will be ‘attacked’ by future missions which are already on the horizon, like INTEGRAL, AGILE and GLAST, to improve on the current general picture.
References
- Aharonian et al. (1999) Aharonian, F., Akhperjanian, A.G., Andronache, M., et al., 1999, A&A 350, 757
- Bassani et al. (1996) Bassani, L., Malaguti, G., Paciesas, W.S., et al., 1996, A&AS 120, 559
- Bednarek (1993) Bednarek, W., 1993, ApJ 402, L29
- Bloom and Marscher (1996) Bloom, S.D., Marscher, A.P., 1996, ApJ 461, 657
- Buckley et al. (1996) Buckley, J.H., Akerlof, C.W., Biller, S., et al., 1996, ApJ 472, L9
- Catanese et al. (1997) Catanese, M., Bradbury, S.M., Breslin, A.C., et al., 1997, ApJ 487, L143
- Catanese and Weekes (2000) Catanese, M. and Weekes, T.C., 1999, PASP, 111, 1193
- Collmar et al. (1997) Collmar, W., Bennett, K., Bloemen, H., et al., 1997, A&A 328, 33
- Collmar et al. (1999a) Collmar, W., Bennett, K., Bloemen, H., et al., 1999a, Proc. of the 3rd INTEGRAL Workshop, Astrophys. Letters and Communications, 38, 445
- Collmar et al. (1999b) Collmar, W., Bennett, K., Bloemen, H., et al., 1999b, Proc. of the 26th ICRC, Vol. 3, 374
- Collmar et al. (2000) Collmar, W., Benlloch, S., Grove, E., et al., 2000, Proc. of 5th Compton Symp., AIP Conf. Proc. 510, 303
- Dermer and Schlickeiser (1993) Dermer, C.D., Schlickeiser, R., 1993, ApJ 416, 458
- Dermer and Gehrels (1995) Dermer, C.D., Gehrels, N., 1995, ApJ 447, 103
- Gaidos et al. (1996) Gaidos, J.A., et al., 1996, Nature 383, 319
- Ghisellini & Madau (1996) Ghisellini, G., Madau, P., 1996, MNRAS 280, 67
- Hartman et al. (1997) Hartman, R.C., Collmar, W., v. Montigny, C., Dermer, C.D., 1997, in Proc. of the 4th Compton Symposium, AIP Conference Proceedings 410, 307
- Hartman et al. (1999) Hartman, R.C., Bertsch, D.L., Bloom, S.D., et al., 1999, ApJS 123, 203
- Johnson et al. (1997) Johnson, W.N., Zdziarski, A.A., Madejski, G.M., et al., 1997, in Proc. of the 4th Compton Symposium, AIP Conference Proceedings 410, 283
- Jones et al. (1996) Jones, D.L., Tingay, S.J., Murphy, D.W., et al., 1996, ApJ 466, L63
- Krennrich et al. (1999) Krennrich, F., Biller, S.D., Bond, I.H., et al., 1996, ApJ 511, 149
- Kurfess (1996) Kurfess, J., 1996, A&AS 120, 5
- Lichti et al. (1995) Lichti, G.G., Balonek, T., Courvoisier, T.J.-L., et al., 1995, A&A 298, 711
- Maisack et al. (1995) Maisack, M., Collmar, W., Barr, P., et al., 1995, A&A 298, 400
- Maliza et al. (1997) Maliza, A., Bassani, L., Malaguti, G., et al., 1997, Proc. of 2nd INTEGRAL Workshop, The Transparent Universe, St. Malo, France, Eds. C. Winkler, T.J.-L. Courvoisier, P. Durouchoux, p. 439
- Mannheim & Biermann (1992) Mannheim, K., Biermann, P., 1992, A&A 253, L21
- Maraschi et al. (1992) Maraschi, L., Ghisellini, G., Celotti, A., 1992, ApJ 397, L5
- Mattox et al. (1997) Mattox, J.R., Wagner, S.J., Malkan, M., 1997, ApJ 476, 692
- Samuelson et al. (1998) Samuelson, F.W., Biller, S.D., Bond, I.H., et al., 1998, ApJ 501, L17
- Sikora et al. (1994) Sikora, M., Begelman, M.C., Rees, M.J., 1994, ApJ 421, 153
- Steinle et al. (1998) Steinle, H., Bennett, K., Bloemen, H., et al., 1998, A&A 330, 97
- Swanenburg et al. (1978) Swanenburg, B.N., Hermsen, W., Bennett, K., et al., 1978, Nat 275, 298
- Urry & Padovani (1995) Urry, M., Padovani, P., 1995, PASP 107, 803
- Weekes (2000) Weekes, T.C., 2000, astro-ph/0010431
- Wozniak et al. (1998) Wozniak, P. R., Zdziarski, A., Smith, D., et al., 1998, MNRAS 299, 449
- Zdziarski et al. (2000) Zdziarski, A., Poutanen, J., Johnson, W. N., 2000, ApJ 542, 703