Deep Near–Infrared Imaging Surveys and the Stellar Content of High Redshift Galaxies \toctitleDeep Near–Infrared Imaging Surveys 11institutetext: Space Telescope Science Institute, Baltimore MD 21218, USA 22institutetext: The Johns Hopkins University, Baltimore MD 21218, USA
*
Abstract
Deep, near–infrared imaging surveys have been motivated by the desire to study the rest–frame optical properties and stellar content of galaxies at high redshift. Here we briefly review their history, and illustrate one application, using HST NICMOS imaging of the Hubble Deep Field North to examine the rest–frame optical luminosities and colors of galaxies at , and to constrain their stellar masses. The rest–frame –band luminosity density at is similar to that in the local universe, but the galaxies are evidently less massive, with rapid star formation and low mass–to–light ratios. There are few candidates for red, non–star–forming galaxies at these redshifts to the HDF/NICMOS limits. We estimate a stellar mass density at that is % of the present–day value, with an upper bound of %. Future headway will come from wide–field ground–based surveys, multiplexing infrared spectrographs, and new space–based facilities such as HST/WFC3 and SIRTF/IRAC.
1 Introduction and history
Observing proposals and article introductions almost universally list a set of basic, interrelated themes that motivate deep near–infrared (NIR, here regarded as 1–3 m) blank sky surveys:
-
•
The integrated stellar spectra of normal galaxies peak in the NIR
-
•
The stellar component of the extragalactic background peaks in the NIR
-
•
NIR light measures familiar rest–frame optical wavelengths at high
-
•
Optical/NIR rest–frame light comes primarily from mid– to low–mass stars with long lifetimes relative to
-
•
NIR light traces total stellar content/mass
-
•
Evolutionary corrections are smaller and easier to model
-
•
–corrections are small or negative and similar for most galaxy types
-
•
Effects of dust extinction are greatly reduced
-
•
Access to , where galaxy light shifts beyond optical wavelengths.
The earliest, heroic efforts [1, 2] used single–element photometers to search for sky background fluctuations from primeval galaxies (PGs) whose light might be redshifted beyond the optical wavelength range. The field really came to life with the advent of array detectors, leading to the first faint NIR imaging surveys [3, 4]. It is interesting to read these and other early papers, where we find discoveries, concerns and hypotheses that have stayed with us ever since: PGs, extremely red objects (“EROs” as PG candidates, or high– ellipticals, or dust–enshrouded galaxies), extremely blue objects (with rapid, cosmologically significant star formation), ERO clustering, UV–excess ellipticals, photometric redshifts, NIR number counts (to constrain space curvature and/or galaxy evolution), etc. While many of the issues remain the same today, the data quality has advanced tremendously, largely driven by progress in array technology, and most recently by the leap into space with HST/NICMOS (affording high angular resolution and far lower backgrounds). Survey sensitivities have improved by a factor of , source densities have increased –fold, and we can now image the detailed morphologies of high redshift galaxies in their rest–frame optical light.
2 Infrared observations of the Hubble Deep Fields
The HST WFPC2 and STIS observations of the Hubble Deep Fields (HDFs, North and South) are the deepest optical images of the sky, and correspondingly deep NIR observations of these areas are valuable for all the reasons outlined above. The HDF–N was observed from the ground in several different NIR programs [5, 6, 7, 8, 9], while the HDF–S has been imaged from the ESO NTT [10] and more recently to with ISAAC on the VLT [11]. The deepest observations at 1.1–1.6 m have come from HST NICMOS imaging of the HDF–N [12, 13] and for the HDF–S NICMOS field [14] (which is distinct from the HDF–S WFPC2 field). The depth and angular resolution of our “wide–field” (only arcmin2, smaller than the first NIR array surveys!) HDF–N/NICMOS program, combined with the great wealth of supporting imaging and spectroscopy at other wavelengths from the ground and from space, make this a premier resource for studying the NIR properties of galaxies at high redshift. Discussion of the NIR morphological and photometric properties of galaxies at [15] and [16], and of galaxy candidates at [16, 17, 18, 19, 20, 21] have appeared elsewhere.
3 Stellar populations of galaxies at
We have carried out a detailed study [22] of the stellar population properties of star–forming “Lyman break galaxies” (LBGs) from the HDF–N at , using NICMOS data to extend previous work based on ground–based NIR photometry [23]. Using a sample of 33 spectroscopically confirmed galaxies [24], we compared 7–band (0.3–2.2 m, observed frame) photometry to empirical spectral templates for nearby galaxies and to population synthesis models in order to evaluate constraints on the LBGs’ stellar content and evolutionary histories. The LBGs are much bluer than local, Hubble sequence galaxies, and than comparably luminous HDF galaxies at lower redshift (Fig. 1), but are similar to nearby, UV–bright starburst galaxies [16, 22].

Even with high–quality HST optical/infrared photometry, we find only weak constraints on most parameters of the LBG stellar populations, with degeneracies between age, star formation time scale, metallicity and extinction. Perhaps the best constraints, however, are those on the total stellar mass (see Fig. 2). If the LBG star formation history is modeled by an exponential, , with and (and extinction) as free parameters, then with fixed assumptions about the IMF and metallicity, the typical 68% confidence interval on log is approximately dex. For LBGs with UV luminosities [29], the inferred stellar masses (assuming a Salpeter IMF, and varying the model metallicities) are 1 to for , , (used here unless otherwise noted). These are th the stellar masses of galaxies today [30]. We may compare these masses to those derived from virial estimates using nebular line–widths and HST–measured sizes [31, 32], which are also . This suggests that these kinematic measurements underestimate the full mass of the dark matter halo, reinforcing a point emphasized by Max Pettini in this volume.

We set an upper bound on the allowable stellar mass by considering how much light from a hypothetical, maximally old stellar population (formed at ) could be hidden beneath the glare of the young, star–forming population. On average, this upper bound is a factor of to larger than the mass derived for the “young” models. If this were generally the case, however, then virtually all galaxies with previous generations of star formation at must also be forming stars rapidly at . We see very few candidates for mature, red, non–star–forming galaxies in this redshift range, even with a NICMOS–selected sample where photometric redshifts should, in principle, readily identify such galaxies if they are present (see Fig. 1).
4 The optical luminosity function and stellar mass density at
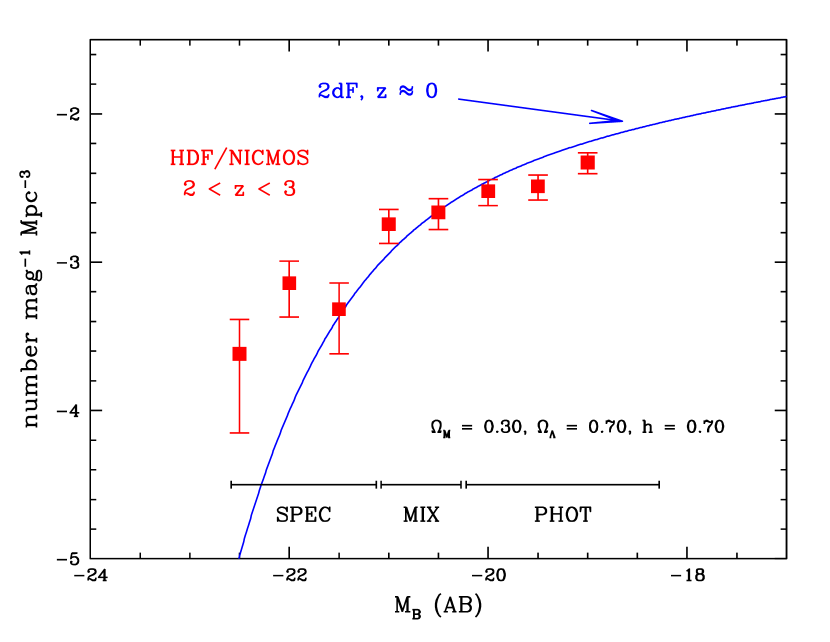
Using photometric and spectroscopic redshifts and NICMOS photometry for HDF–N galaxies, we may examine the rest–frame –band luminosity distribution of galaxies at (Fig. 3). Over the luminosity range we can examine, this is not dissimilar to the local –band luminosity function (LF) [33]. Galaxies with and contribute a total blue luminosity density . Without further correction for incompleteness or extrapolation to fainter magnitudes, this is that from the integrated 2dF LF, and nearly equal to that from the preliminary SDSS LF [34].
Although the optical luminosity densities are similar at and , the implied stellar mass densities are quite different. Galaxies at are far bluer than local counterparts (Fig. 1), indicating much smaller mass–to–light ratios. From our modeling [22] for 22 HDF–N LBGs at , we derive an average to 0.25 (in solar units), depending on assumptions about metallicity and IMF. These values refer to emergent luminosities, i.e., here is not corrected for the effects of extinction – the intrinsic for the stellar populations are smaller. There is a trend of with rest–frame color, amounting to a factor of over the observed color range of the spectroscopic LBG sample, but we neglect this here and apply from the spectroscopic LBGs to the photometric redshift sample. The majority of galaxies with photometric redshifts have colors similar to or bluer than those in the spectroscopic sample (Fig. 1).
Restricting our attention to a Salpeter IMF, the starburst dust attenuation law [35], and model metallicities 0.2 to 1, we estimate a stellar mass density to at these redshifts. Comparing this to the present–day stellar mass density computed from the 2dF+2MASS –band luminosity function [30], using the same IMF assumptions, we find to 0.058. It is also 8–14 smaller than the estimated mass density from bright galaxies at [36]. This is presumably a lower limit for several reasons. First, our assumed cosmology results in a nearly minimal luminosity density for currently acceptable values of the cosmological parameters. An Einstein–de Sitter model increases by the luminosity and mass densities by 80%. Second, we have made no corrections for incompleteness in the NICMOS–selected galaxy sample, nor any attempt to extrapolate to objects fainter than the HDF/NICMOS detection limit. Finally, as described in §2, the galaxy masses may be larger if there were earlier generations of star formation. If we assign every LBG its maximum (at 68% confidence) stellar mass (see §2) allowing for a older generation of stars formed at , then for the adopted cosmology we may set a conservative upper bound on the total stellar mass density contained within NICMOS–detected galaxies, .
This upper bound is barely consistent with the hypothesis that all stars in present–day galactic spheroids formed at [37]. In this scenario, all galaxies must have already formed most of their stars at , but must also be forming more stars at (since there are are few candidates for evolved, non–star–forming HDF galaxies at that redshift). As described above, a more direct accounting for the mass present in NICMOS–detected galaxies at implies a much smaller fraction, %, of the present–day stellar mass density.
5 Future directions
Infrared surveys described here have really just begun to address the most important questions about the mass assembly history of galaxies. A new generation of infrared instrumentation, on the ground and in space, will carry us further along down this road. Deep NIR surveys are still limited to very small solid angles and thus volumes at high redshift. New large format detectors will greatly improve this situation, although unfortunately very few cameras for 8–10m telescopes (whose aperture is really needed to study galaxies) are being configured with wide fields of view. The first multi–object NIR spectrographs are just now coming on line; these will permit wholesale spectroscopy of distant galaxies at rest–frame optical wavelengths, offering a means of measuring kinematic masses and chemical abundances at high redshift. On HST, the infrared channel of Wide Field Camera 3 will offer a big advance for faint galaxy surveys, offering a field of view larger than that of NICMOS, with 1.7 better pixel sampling. Deep 1.0–1.6 m observations of HDF–sized regions will become routine, enabling wholesale studies of the rest–frame optical morphologies, luminosities and colors of galaxies at , and color–selected surveys for galaxies at .
Despite the promises usually made for NIR surveys (see §1),
our census of the stellar content of galaxies at is still
fundamentally limited by the wavelengths at which we can observe.
The and –bands measure rest–frame and –band light
at , leaving large uncertainties on estimates of stellar mass,
ages, and other such parameters, while brave first attempts at 3–7 m
do not go deep enough to detect galaxies at [38, 9].
The SIRTF Infrared Array Camera (IRAC), observing at
3.6–8.0 m, can measure rest–frame –band light from
galaxies out to and m emission
out to . Extremely deep exposures will be required,
however, to detect ordinary galaxies at such large redshifts.
We will be carrying out a SIRTF Legacy Program,
the Great Observatories Origins Deep Survey (GOODS), which will
push observations at 3.6–24 m to their limits in two
fields (the HDF–N and Chandra Deep Field South) totaling
approximately 330 arcmin2. The survey goal is to provide
multiwavelength data suitable for tracing the mass assembly
history of galaxies and their energetic output from star formation
and AGN activity out to the highest accessible redshifts.
The SIRTF data, along with extensive supporting
observations from ESO and other facilities, will be distributed
to the community, providing a rich archive for research
and a pathfinder to future work with NGST.
MD would like to thank the conference organizers for hosting this important and timely meeting. This work was supported by NASA grant GO-07817.01-96A.
References
- [1] Boughn, S. P., Saulson, P. R., & Uson, J. M., 1986, ApJ, 301, 17
- [2] Collins, C. A., & Joseph, R. D., 1988, MNRAS, 235, 209
- [3] Elston, R., Rieke, G. H., & Rieke, M. J., 1988, ApJ, 331, L77
- [4] Cowie, L. L., Lilly, S. J., Gardner, J., & McLean, I. S., 1988, ApJ, 332, L29
- [5] Hogg, D. W., Neugebauer, G., Armus, L., Matthews, K., Pahre, M. A., Soifer, B. T., & Weinberger, A. J. 1997, AJ, 113, 2338
- [6] Barger, A. J., Cowie, L. L., Trentham, N., Fulton, E., Hu, E. M., Songaila, A., & Hall, D. 1999, AJ, 117, 102
- [7] Dickinson, M., 1998, in The Hubble Deep Field, eds. M. Livio, S. M. Fall & P. Madau (Cambridge: Cambridge Univ. Press), 219
- [8] Hogg, D. W., et al., 2000a, ApJS, 127, 1
- [9] Hogg, D. W., et al., 2000b, AJ, 119, 1519
- [10] da Costa, L., et al., 1998, A&A, submitted (astro–ph/9812105)
- [11] Franx, M., et al., The Messenger, 99, 20
- [12] Thompson, R. I., Storrie–Lombardi, L. J., Weymann, R. J., Rieke, M., Schneider, G., Stobie, E., & Lytle, D. 1999b, AJ, 117, 17
- [13] Dickinson, M., 1999, in After the Dark Ages: When Galaxies were Young, eds. S. Holt & E. Smith, AIP, 122
- [14] Fruchter, A., et al., 2001, in prep.
- [15] Dickinson, M., 2000a, in Building Galaxies: From the Primordial Universe to the Present, eds. F. Hammer, T. X. Thuan, V. Cayatte, B. Guiderdoni, & J. Tranh Than Van, Ed. Frontières, 257
- [16] Dickinson, M., 2000b, in Phil. Trans. Royal Soc. Lond. A, 358, 2001.
- [17] Dickinson, M., et al., 2000, ApJ, 531, 624
- [18] Lanzetta, K. M., Yahil, A., & Fernández–Soto, A., 1998, AJ, 116, 1066
- [19] Lanzetta, K. M., Chen, H.–W., Fernández–Soto, A., Pascarelle, S., Yahata, N., & Yahil, A., 1999, in The Hy-Redshift Universe, ed. A. J. Bunker & W. J. M. van Breugel, (San Francisco: ASP), 544
- [20] Yahata, N., et al., 2000, ApJ, 538, 493
- [21] Thompson, R. I., Weymann, R. J., & Storrie-Lombardi, L. J., 2000, ApJ, 546, 694
- [22] Papovich, C., Dickinson, M., & Ferguson, H. C., 2001, ApJ, in press
- [23] Sawicki, M., & Yee, H. K. C., 1998, AJ, 115, 1329
- [24] Cohen, J. G., et al., 2000, ApJ, 538, 29
- [25] Richards, E. A., Fomalont, E. B., Kellermann, K. I., Windhorst, R. A., Partridge, R. B., Cowie, L. L., & Barger, A. J., 1999, ApJ, 526, L73
- [26] Hornschemeier, A. E., 2000, ApJ, 541, 49
- [27] Aussel, H., Cesarsky, C. J., Elbaz, D., & Starck, J. L., 1999, A&A, 342, 313
- [28] Downes, D., et al., 1999, A&A, 347, 809
- [29] Steidel, C. C., Adelberger, K. L., Giavalisco, M., Dickinson, M., & Pettini, M., 1999, ApJ, 519, 1
- [30] Cole, S., et al., 2000, MNRAS, submitted (astro–ph/0012429)
- [31] Pettini, M., et al., 2001a this volume
- [32] Pettini, M., et al., 2001b, ApJ, submitted
- [33] Folkes, S., et al., 1999, MNRAS, 308, 459
- [34] Blanton, M. R., 2000, AJ, submitted (astro–ph/0012085)
- [35] Calzetti, D., Armus, L., Bohlin, R. C., Kinney, A. L., Koornneef, J., & Storchi–Bergmann, T., 2000, ApJ, 533, 682
- [36] Brinchmann, J., & Ellis, R. S., 2000, ApJ, 536, L77
- [37] Renzini, A., 1999, in The Formation of Galactic Bulges, eds. M. Carollo, H. C. Ferguson & R. F. G. Wyse, (Cambridge: Cambridge University Press), 9
- [38] Serjeant, S. B. G., et al., 1997, MNRAS, 289, 457