The Evolution of the Lyman Alpha Forest From
Abstract
I review results obtained from studies of the high-redshift Ly forest, and present new results from HST/STIS spectra of low-redshift quasars in comparison with cosmological hydrodynamic simulations. The evolution of the Ly forest from is well-described by current structure formation models, in which Ly forest absorbing gas at all redshifts traces moderate-overdensity large-scale structures. I describe some of the insights provided by hydrodynamic simulations into the observed statistical trends of Ly absorbers and the physical state of the absorbing gas.
Steward Observatory, Univ. of Arizona, 933 N. Cherry Ave., Tucson, AZ, USA
1. Introduction
Quasar absorption lines have been used as probes of the high-redshift universe for some time (e.g. Sargent et al. 1980), since the Ly (1216Å) transition is redshifted into the optical at . HIRES (Vogt et al. 1994) on the Keck 10m telescope has been at the forefront in providing high S/N, high resolution quasar spectra that has enabled dramatic advances in our understanding of the high-redshift intergalactic medium (Rauch 1998). Conversely, studies of low-redshift Ly absorbers require ultraviolet spectroscopy, which has only recently become routinely possible with the Hubble Space Telescope. The HST Quasar Aborption Line Key Project (Bahcall et al. 1993) observed over 80 quasars using the Faint Object Spectrograph (FOS), and found a surprisingly large number of absorbers as compared to an extrapolation from high-redshift (Bahcall et al. 1996; Weymann et al. 1998). Recently the deployment of the Space Telescope Imaging Spectrograph (STIS) has provided a dramatic increase in resolving power (resolution as opposed to FOS’s ), thereby fully resolving all Ly absorbers seen in UV quasar spectra. While only the brightest quasars and AGN may be easily observed with STIS, this has still resulted in significant gains in our understanding of low-redshift Ly absorbers and their relation to high-redshift absorbers. In these proceedings I report some recent results from HST/STIS.
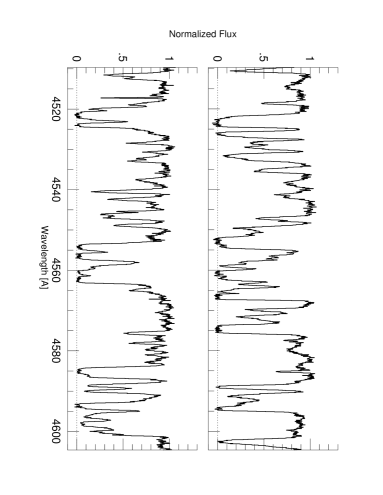
In conjunction with these observations, hydrodynamic simulations of structure formation in currently favored cosmological scenarios have elucidated a new paradigm for the nature of Ly forest absorbers, particularly at high redshift. These simulations indicate that Ly absorbers arise in highly photoionized diffuse intergalactic gas tracing the dark matter in non-equilibrium large-scale structures. Their temperature is set by a balance between photoioinization heating from a metagalactic UV background (presumably from quasars; Haardt & Madau 1996) and adiabatic cooling due to Hubble expansion, resulting in a tight relation . These simulations are able to reproduce various statistical properties of high-redshift Ly absorbers in detail, spanning the range of damped Ly systems to the weakest observed detected with HIRES, all within a model that generically arises in CDM cosmologies (Hernquist et al. 1996; Davé et al. 1997). Figure 1 shows a comparison of a portion of the HIRES spectrum of Q1422+231 (Songaila & Cowie 1996) with a simulated spectrum covering the same redshift interval, having resolution and noise properties that emulate the data. Can you tell which is which? (answer at the end).
Due to the relatively simple relationship between H I and the underlying dark matter, a formula known as the “Fluctuating Gunn-Peterson Approximation” (FGPA; see Croft et al. 1998 for full formula) provides a remarkably accurate description of Ly absorbing gas:
| (1) |
where is the H I optical depth, is the density of dark matter (or baryons), and is the metagalactic H I photoionization rate incident on the absorber.
2. Results From High-Redshift Ly Forest Studies
The FGPA has been combined with HIRES quasar spectra to provide stringent constraints on many aspects of the physics of high-redshift intergalactic gas. For instance, a measurement of the mean optical depth together with an independent estimate of result in a robust estimate of (Rauch et al. 1997), in good agreement with D/H measurements (Burles & Tytler 1998) and recent CMB analyses (e.g. Pryke et al. 2001).
The FGPA also implies that a given Ly optical depth (or flux, in the optically-thin regime) corresponds to a particular density of gas at a particular temperature. Hence ionization corrections can be accurately obtained to constrain the metallicity of the diffuse high-redshift intergalactic medium (IGM) from metal-line observations of C IV (Songaila & Cowie 1996; Rauch, Haehnelt & Steinmetz 1997; Davé et al. 1998). These studies found [C/H] for a Haardt & Madau (1996) ionizing background shape, and significantly lower for a spectrum with fewer high-energy photons (as would be expected if Helium had not yet reionized; see Heap et al. 2000). Furthermore, recent VLT/UVES observations of O VI absorption suggests the presence of some metals even in voids (Schaye et al. 2000), presenting a significant theoretical challenge to models of metal ejection and transport in the IGM (e.g. Aguirre et al. 2001).
The most ambitious use of the FGPA, and the one for which it was originally developed, is a reconstruction of the matter power spectrum at from Keck/HIRES quasar spectra. Since the optical depth in the Ly forest traces the matter density, fluctuations in the optical depth reflect a 1-D probe of the amplitude and shape of the matter power spectrum, at scales of (comoving). For a flat universe, this measurement yields a constraint on the matter density of , where is the power spectrum shape parameter (Croft et al. 2000). This value is slightly higher that in the “concordance model” (; Bahcall et al. 1999), but the latest CMB measurements combined with the Key Project value (Mould et al. 2000) suggest a higher as well (Pryke et al. 2001). Thus the Ly forest provides an independent avenue for doing “precision cosmology”, alongside CMB, Type Ia supernovae, etc.
3. Evolution of the IGM to Low Redshift
Recently, hydrodynamic simulations have been evolved to redshift zero to investigate the nature of low-redshift Ly absorbers and the evolution of the Ly forest. They indicate that while many of the baryons have moved into galaxies, clusters, and a diffuse shocked “warm-hot intergalactic medium” (Cen & Ostriker 1999; Davé et al. 2001), roughly one-third of all baryons continue to reside in photoionized gas tracing large-scale structure.
These simulations are able to explain a wide range of Key Project observations quite naturally within the context of hierarchical structure formation scenarios. For instance, the Key Project data showed that high-redshift () Ly absorbers are evolving away quite rapidly, whereas for the absorber number density evolution slows abruptly and dramatically (Bahcall et al. 1996). In the simulations of Davé et al. (1999) and Theuns et al. (1998), this occurs due to the dimunition of the quasar population providing the metagalactic photoionizing flux. As a result, the rapid evolution of absorbers due to Hubble expansion in the high- universe is countered by the increase in neutral fraction of Ly absorbing gas at . These simulations disfavor a scenario in which a different population of absorbers dominates at low redshift as compared to high redshift, and instead suggest that the nature of absorbing gas is quite similar.

Weymann et al. (1998) found that stronger absorbers disappear more rapidly than weaker absorbers, and in fact the weakest absorbers seen in the FOS sample (rest equivalent width ) show an increase in number between . Davé et al. suggested that this arose due to differential Hubble expansion, in particular that low-density regions expand faster than high-density ones and therefore provide an increasing fractional cross-section of absorption to lower redshifts.
Motivated by the good agreement between simulations and FOS observations, Davé et al. investigated the physical state of the gas giving rise to Ly absorption at low redshift. They found that the gas follows similar physical relationships as deduced at high-redshift, and is thus of the same basic character, but that a given column density absorber corresponds to different physical densities at different redshifts.
This effect is shown in Figure 2. The top left panel shows the density-column density relation at from a CDM simulation. The tight relation reflects the accuracy of the FGPA; much of the scatter about the best-fit relation (solid line) comes from errors in Voigt profile fitting (noise with S/N=30 was added to the artificial spectra to roughly match observations). At low redshift, the relationship persists, though there is more scatter due to the presence of absorbers arising in shock-heated intergalactic gas (Davé et al. 1999; Cen & Ostriker 1999). The best-fit slope of the relation is similar, but the amplitude has shifted considerably from . This shift arises because of the interplay between Hubble expansion and the evolution of the ionizing background.
The bottom panel of Figure 2 focusses on the evolution of this trend with redshift. Here, we show the typical column density of an absorber arising in gas with three different densities, as a function of redshift. For instance, gas at the mean density (which typically remains around that density over a Hubble time) produces a strong absorber of atr , but by it produces only a very weak absorber of . In general, a given density corresponds to a column density lower at as compared to . Thus studying physically and dynamically equivalent absorbers at high and low redshift requires comparing across different column densities.
Using this trend, the knowledge and intuition gained from studies of the Ly forest at high redshift can be translated to expectations at low redshift. For instance, it is known that most absorbers with at are enriched (Songaila & Cowie 1996); thus one expects that absorbers with should be enriched to at least a similar level (though detecting these metal lines will be challenging).
4. Low-Redshift Ly Forest Observed with HST/STIS
A new window on the low-redshift Ly forest has opened with the deployment of STIS aboard HST. STIS’s E140M Echelle grating provides resolution, a level of detail comparable to HIRES albeit with somewhat more noise. STIS can thus probe weak forest absorbers that are predicted to be physically similar to those at high-redshift, and allows a detailed comparison to be made with hydrodynamic simulations.
Dave & Tripp (2001) compared the quasar spectra of PG0953+415 and H1821+643 to carefully-constructed artificial spectra drawn from a CDM simulation. The statistical properties of absorbers in the simulations were in remarkable agreement with observations, as shown in Figure 3. The column density distributions agree down to the smallest observable absorbers, in both slope and amplitude. Interestingly, the slope of the column density distribution (from ) is measured to be , which is considerably steeper than at high redshift (; Kim et al. 2000). This indicates, in agreement with Weymann et al., that stronger absorbers have evolved away faster than weaker ones. Our result is also in broad agreement ( higher) with Penton et al. (2000), who found from GHRS data.


The distribution of line widths (-parameters) is also in excellent agreement with observations. The median -parameter is around , but this value is sensitive to the column density detection threshold, because the column density and -parameter are correlated. This can be understood from the fact that higher column density systems arise in higher density gas that has higher temperature. Since thermal broadening contributes significantly to line widths (compare the dotted and dashed lines in the right panel of Figure 3), higher column density absorbers will tend to have larger widths. Thus Shull et al. (2000), who find a median -parameter of from FUSE and GHRS data, are not in disagreement with our result because their sample has a higher column density detection limit.
The large thermal component of linewidths facilitates a measurement of the typical temperature of Ly absorbing gas at low redshift. By comparing the observed median -parameter to simulations, Davé & Tripp found that purely photoionized Ly absorbers (those that have not been shock-heated) at the mean density have a temperature of K, in agreement with Ricotti, Gnedin & Shull (2000).
The agreement in amplitude of the column density distribution can be translated into a constraint on the H I photoionization rate , since varying would shift the simulated column density distribution proportionally in the horizontal direction (assuming optically thin lines, which is valid for most STIS absorbers). Davé & Tripp obtain , with the errors dominated by systematic uncertainties in modeling, providing among the most precise constraints on the metagalactic to date.
5. Conclusion
The Ly forest has proved to be a powerful tool for constraining a wide variety of physical and cosmological parameters, when hydrodynamic simulations and the FGPA are used in conjunction with high-resolution quasar spectra. Much progress has already been made at high redshift, where the metallicity, ionization state, and mass fluctuation spectrum have all been derived from Ly forest data.
Hydrodynamic simulations of structure formation also provide an excellent description of low redshift Ly forest absorbers, particularly for the weak absorbers that reside in moderate-overdensity regions analogous to high-redshift absorers. HST/STIS has opened up a new era in the study of the low-redshift IGM, which promises to progress considerably further with the deployment of the Cosmic Origins Spectrogaph aboard HST (in 2003). Initial results indicate that the low-redshift Ly forest can yield important constraints on physical parameters in the IGM, as well as provide a more complete picture of the evolution of baryons in the Universe.
References
Aguirre, A., Schaye, J., Hernquist, L., Weinberg, D. H., Katz, N., & Gardner, J. P. 2000, ApJ, in press, astro-ph/0006345
Bahcall, J. N., et al. 1993, ApJS, 87, 1
Bahcall, J. N., et al. 1996, ApJ, 457, 19
Bahcall, N., Ostriker, J. P., Perlmutter, S., & Steinhardt, P. J. 1999, Science, 284, 1481
Burles, S. & Tytler, D. 1998, ApJ, 507, 732
Cen, R. & Ostriker, J. P. 1999, ApJ, 514, 1
Croft, R. A. C., Weinberg, D. H., Katz, N., & Hernquist, L. 1998, ApJ, 495, 44
Croft, R. A. C., Weinberg, D. H., Bolte, M., Burles, S., Hernquist, L., Katz, N., Kirkman, D., & Tytler, D. 2000, ApJ, in press, astro-ph/0012324
Davé, R., Hernquist, L., Weinberg, D.H. & Katz, N. 1997, ApJ, 477, 21
Davé, R., Hellsten, U., Hernquist, L., Katz, N., & Weinberg, D. H. 1998, ApJ, 509, 661
Davé, R., Hernquist, L., Katz, N., & Weinberg, D. H. 1999, ApJ, 511, 521
Davé, R., Cen, R., Ostriker, J. P., Bryan, G. L., Hernquist, L., Katz, N., Weinberg, D. H., Norman M. L., & O’Shea, B. 2001, ApJ, in press, astro-ph/0007217
Davé, R. & Tripp, T. M. 2001, ApJ, in press
Haardt, F. & Madau, P. 1996, ApJ, 461, 20
Heap, S. R., Williger, G. M., Smette, A., Hubeny, I., Sahu, M. S., Jenkins, E. B., Tripp, T. M., & Winkler, J. N. 2000, ApJ, 534, 69
Hernquist, L., Katz, N., Weinberg, D.H., & Miralda-Escudé, J. 1996, ApJ, 457, L51
Jannuzi, B. T., et al. 1998, ApJS, 118, 1
Kim, T.S., Hu, E.M., Cowie, L.L., & Songaila, A. 1997 AJ, 114, 1
Mould, J. R. et al. 2000, ApJ, 529, 786
Penton, S. V., Shull, J. M., & Stocke, J. T. 2000, ApJ, 544, 150
Pryke, C., Halverson, N. W., Leitch, E. M., Kovac, J., Carlstrom, J. E., Holzapfel, W. L., Dragovan, M. 2001, ApJ, submitted, astro-ph/0104490
Rauch, M., Haehnelt, M. G., & Steinmetz, M. 1997, ApJ, 481, 601
Rauch, M. 1998, ARA&A, 36, 267
Rauch, M., Miralda-Escudé, J., Sargent, W.L.W., Barlow, T.A.,Hernquist, L., Weinberg D.H., Katz, N., Cen, R., Ostriker, J.P. 1997, ApJ, 489, 7
Ricotti, M., Gnedin, N. Y., & Shull, J. M. 2000, ApJ, 534, 41
Sargent, W.L.W., Young, P.J., Boksenberg, A., & Tytler, D. 1980, ApJS, 42, 41
Schaye, J., Rauch, M., Sargent, W. L. W., & Kim, T.-S. 2000, ApJ, 541, L1
Shull, J. M., Giroux, M. L., Penton, S. V., Tumlinson, J., Stocke, J. T., Jenkins, E. B., Moos, H. W., Oegerle, W. R., Savage, B. D., Sembach, K. R., York, D. G., Green, J. C., & Woodgate, B. E. 2000, ApJ, 538, L13
Songaila, A. & Cowie, L. L. 1996, AJ, 112, 335
Theuns, T., Leonard, A., & Efstathiou, G. 1998, MNRAS, 297, L49
Vogt, S. S., et al. 1994, SPIE, 2198, 326
Weymann, R., et al. 1998, ApJ, 506, 1
Acknowledgments.
I thank Todd Tripp, Lars Hernquist, Neal Katz, David Weinberg, and Ray Weymann for collaborative efforts on these projects and helpful discussions. The Q1422 spectrum is in the top panel.