Mgii Absorber Number Density at : Implications for Evolution11affiliation: Based in part on observations obtained with the NASA/ESA Hubble Space Telescope, which is operated by the STScI for the Association of Universities for Research in Astronomy, Inc., under NASA contract NAS5–26555
Abstract
An unbiased sample of 147 quasar/AGN spectra, obtained with the Faint Object Spectrograph on board the Hubble Space Telescope, has been searched for intervening Mgii absorbers over the redshift range . The total redshift path searched is 18.8, with the survey being % complete to a rest–frame equivalent width, , of Å and % complete to Å. Main results of this work are the following. (1) Four systems were found, with a mean redshift of , yielding a redshift number density for absorbers with Å. This is consistent with the value expected if these systems do not evolve from higher redshifts (). (2) No systems with Å were found. Based upon no evolution expectations and accounting for the survey completeness, it is a result to have a null detection of smaller systems. If this implies a turnover in the low region of the equivalent width distribution at , then there is at least a % reduction in the average galaxy gas cross section from galaxies. (3) These systems have strong Feii absorption and, based upon the results of Rao & Turnshek (2000, ApJS, 130, 1), are good candidates for damped Ly absorbers (DLAs). This translates to a redshift number density of for DLAs at . In tandem with the data analyzed by Rao & Turnshek, these results indicate that the redshift number density of DLAs does not evolve from to . If the Hi mass function does not evolve from to , then the cosmological Hi mass density, , is also deduced to not evolve from to . These results for Mgii absorption–selected DLAs are at odds with those based upon 21–cm emission from Hi galaxies by a factor of five to six.
1 Introduction
At low to intermediate redshift (), strong intervening Mgii absorption systems are known to arise in the proximity of normal, bright galaxies (Bergeron & Boissé, 1991; Steidel et al., 1994). The projected size111Throughout this paper, we assume km s-1 Mpc-1. of absorbing regions around galaxies was shown to be kpc, with a very weak proportionality with galaxy luminosity (Steidel, 1995). However, there is some evidence that by , the Mgii absorbing gas cross sections of galaxies may be less than kpc (Bowen, Blades, & Pettini, 1995).
Rao & Turnshek (2000) showed that strong Mgii absorption serves as an efficient selection method for finding damped Ly absorbers (DLAs; defined as having [atoms cm-2]). They found that the equivalent widths of both Mgii and Feii are very often greater than Å when the system is a DLA (also see Boissé et al., 1998). Measuring the cosmic evolution in the number densities of DLAs is useful for measuring evolution in the cosmological mass density of neutral gas, . Selecting DLAs using Mgii absorption renders the computation of directly proportional to the measured redshift number density for Mgii systems. Using this approach, Rao & Turnshek have shown that there is no compelling evidence that DLAs evolve from to , though currently published 21–cm emission surveys require strong evolution to . This would suggest a strong evolution in at the lowest redshifts.
A measurement of the redshift number density, , for Mgii systems at could be useful to either corroborate or to challenge these findings and to place constraints on scenarios of global galaxy evolution. If Mgii absorbers evolve away over the interval , observed as a down–turning break in the distribution, it would imply that either the number or typical size of the absorbers is decreasing. If there is a paucity of large equivalent width systems having strong Feii absorption, this would indirectly indicate strong evolution in DLAs.
Measuring at requires ultraviolet (UV) spectroscopy (because the Mgii doublet is not redshifted to wavelengths redward of the atmospheric cut off). There exists a large database of UV spectra obtained with the Faint Object Spectrograph (FOS) on board the Hubble Space Telescope (HST). Because of the G270H grating wavelength coverage, especially the upper wavelength cut off, these data are tailored for comparing the of Mgii absorbers from to to that published by Steidel & Sargent (1992, hereafter SS92) for . They observed 103 quasars, covering a total redshift path of . Fortuitously, the FOS spectra have the same resolution and similar pixel sampling rate as the SS92 spectra. A smaller, lower resolution, Mgii survey by Boissé et al. (1992) covered redshifts –, with very non–uniform sensitivity down to . They observed a total of 35 quasars, covering a total redshift path of .
In this paper, the redshift number density of Mgii absorbers with is measured using 147 archival FOS/HST spectra with a total redshift path of . In § 2, the data, the quasar and active galactic nuclei (AGN) selection, and the data analysis are presented. Results are given in § 3 and discussed in the context of the Mgii absorber redshift number density measured for . In § 4, the implications for evolution in are discussed. A brief discussion of possible evolution in the gas cross sections of galaxies is presented in § 5. Concluding remarks are given in § 6.
2 Data and Analysis
A total of 207 FOS/HST quasar/AGN G270H spectra have been archived. The G270H spectra cover the wavelength region to Å and provide a redshift coverage for Mgii absorption from (Galactic) to . These spectra have a resolution of with four diodes per resolution element.
Many of the FOS spectra were observed and published by the HST Quasar Absorption Line Key Project (KP, Bahcall et al., 1993, 1996; Jannuzi et al., 1998) and have kindly been made available for this work. The remaining archived spectra were generously provided by Dr. S. Kirhakos in fully reduced form and with continuum normalization. These reductions were performed using KP software (Schneider et al., 1993) in the same fashion that Dr. Kirhakos reduced the KP sample; thus, there has been uniform treatment of the reductions of all spectra for the Mgii survey.
Quasars and/or AGN with emission redshifts larger than 1.7 were removed from the database. This constraint was applied to ensure that the quasar Ly emission line was not redward of the wavelength region covered by the G270H spectra. This was to avoid confusion with the Ly forest and/or Lyman series lines of relatively strong, higher redshift metal–line absorbers.
For each quasar/AGN in the resulting sample, the search for Mgii absorption was limited to wavelength regions 1000 km s-1 redward of Galactic Mgii absorption in order to avoid possible confusion with high velocity cloud and/or Galactic absorption. The search was also limited to redward of the Ly emission line peak. Again, this was to avoid confusion with Ly forest and/or Lyman series lines. Since this survey is for intervening Mgii absorption, the search was also limited to km s-1 blueward of the quasar/AGN Mgii emission line. Application of this constraint hopefully avoided the possible inclusion of any absorption that may be intrinsic to the quasars themselves.
Of the original 207 spectra, 60 were eliminated due to the above selection criteria. Of the 147 spectra remaining, 104 had full G270H wavelength coverage (1000 km s-1 redward of Galactic Mgii) available for the survey. The partial wavelength regions surveyed in the remaining 43 spectra ranged from a small Å to just short of Å, with a typical coverage of – Å.
The equivalent width detection threshold in each pixel was computed, and the identification of absorption features and Mgii doublet candidates was performed using the software of Churchill et al. (1999, 2000). Candidate doublets were then examined visually for inclusion into the list of absorbers. The equivalent widths were measured using the interactive fitting software of Churchill et al. (2000), which allows multiple Gaussian fits to resolved lines. The Mgii rest–frame equivalent widths are presented in Table 1.
2.1 Accounting for Biased Lines of Sight
The KP spectra represent an unbiased sample of quasar/AGN lines of sight, in that the sample was objectively compiled without consideration of a priori knowledge of absorption systems. However, the archive spectra do not constitute an unbiased sample. Quasars/AGN observed for the purpose of finding metal–line absorption near low redshift galaxies would introduce a bias into this survey. Inclusion of Mgii systems from biased lines of sight would yield a measured larger than the true value. Conversely, including biased lines of sight along which no systems are found would result in a larger total redshift path for the survey, and thus yield a measured smaller than the true value.
In the final sample of quasars/AGN, 74 were observed for the Key Project and are thus unbiased lines of sight (apart from concerns for gravitational lensing). The remaining 73 spectra are a heterogenous sample from the point of view of why the quasars/AGN were observed. A study of the on–line proposal abstracts for these quasars revealed that, for all but five, the scientific motivations for the observations were either to study the Ly forest lines or the environment surrounding or intrinsic to the quasar/AGN themselves.
The five biased lines of sight were excluded from the survey statistics and all subsequent analysis. However, they were included in the survey for systems in order to “test” the search algorithm. The previously published systems that lie in the redshift range searched in this survey were found and are discussed below.
3 Results
The automated doublet finding software yielded a total of 16 candidate Mgii doublets. Eight were clearly blends of known metal lines from other, known intervening systems. One of the remaining eight candidates ( in PG ) was an artifact of flat fielding residuals (e.g., Jannuzi & Hartig, 1994); its redshifted and transitions were misaligned by . A second, large equivalent width candidate ( in B2 ) was dropped from the sample because it was a spurious feature; the absorption had no doublet structure and there were no corroborating Feii transitions (which are common for very strong systems).
The remaining six candidates were found to be bonafied Mgii systems, particularly when Feii and/or Mgi absorption corroborated the Mgii absorption. Four of these systems were found along unbiased lines of sight, whereas two were found along biased lines of sight. These two lines of sight and the two systems were dropped from the survey analysis, as described below.
3.1 The Four Unbiased Systems
3.1.1 C ; ;
This object was observed for the Key Project, and is thus an unbiased line of sight. A subsequent literature search revealed that this system was cataloged by Jannuzi et al. (1998). Both a G130H and G190H spectrum were available. The G130H covered the location of Ly absorption for this system, but it was heavily obscured by Galactic geocoronal Ly emission. The signal strength was too low to discern whether Siiv or Civ absorption was present. Feii , 2374, 2382, and 2600 absorption and Mgi absorption were measured. The data are presented in Figure 1 and the rest–frame equivalent widths are presented in Table 2.
3.1.2 PKS ; ;
This object was also observed for the Key Project, and is thus an unbiased line of sight. As with the 3C 232 absorber, a subsequent literature search revealed that this system was cataloged by Jannuzi et al. (1998). The Mgii absorption profiles are resolved and required a two–component Gaussian fit. A G190H spectrum was also available for this line of sight. Feii absorption is strong in this system. Mgi was also detected. The data are presented in Figure 2 and the rest–frame equivalent widths are presented in Table 2.
3.1.3 Q ; ;
This object was observed for a program (PID 5654) to catalog Ly forest absorptions lines; thus, the line of sight is unbiased for intervening–metal line absorbers. The stronger absorption profiles are resolved and required a two–component Gaussian fit. Mgii is blended with Galactic Mgi ; this resulted in an unphysical doublet ratio for the red component of the Gaussian fit. Only a G270H spectrum was available for this line of sight. Because of the relatively high redshift of this emission line object, the strong Feii transitions fell in the Ly forest. Feii is just redward of the Ly emission, but it is hopelessly blended in a strong absorption complex. Mgi is quite strong. The data are presented in Figure 3 and the rest–frame equivalent widths are presented in Table 2.
3.1.4 PG ; ;
This object was observed for a program (PID 6781) to investigate the ionizing continuum in AGN; this is an unbiased line of sight. The Mgii system is the weakest of the four and the only one in which the profiles are unresolved at FOS resolution (subsequently, the widths of the Gaussians used for the equivalent width measurements were held constant at the value of the FOS instrumental spread function; this leaves a somewhat significant residual to the fit in the line cores). Both a G130H and a G190H spectrum were available for this line of sight. The Ly rest–frame equivalent width is Å, indicating that this systems is not a DLA. No Siiv nor Civ absorption was detected to a detection limit of Å and Å, respectively. Cii was detected. Also detected were Feii , 2374, 2382, and 2600. Mgi was not detected to 0.49 Å (). The data are presented in Figure 4 and the rest–frame equivalent widths are presented in Table 2.
3.2 The Two Biased Systems
3.2.1 PKS ; ;
In the spectrum of PKS (Boissé et al., 1998), Mgii absorption at is associated with a post–star burst dwarf galaxy (Steidel, Dickinson, & Bowen, 1993). Boissé et al. state that the presence of this galaxy was “one additional motivation for observing this quasar”. Thus, this quasar was dropped from this survey.
3.2.2 Q ;
Bowen, Blades, & Pettini (1996) published this system, which arises in the inclined galaxy M61. This quasar was observed because it was a sightline that “lies fortuitously behind [a galaxy] whose existence is already known.” Thus, this line of sight was also dropped from this survey.
3.3 Redshift Path Density
The total redshift path, over which an absorber with a specified rest–frame equivalent width, could be detected in an unbiased survey was computed using the the formalism of Lanzetta, Turnshek, & Wolfe (1987), (their Eqs. 6 & 7) and SS92 (their Eqs. 1 & 2). The total redshift path density, , of the survey is shown in Figure 5, where we have adopted the notation of Lanzetta, Turnshek, & Wolfe (1987) and a detection limit. The total redshift path is above Å and then drops rapidly below Å. The survey is % complete at Å and % complete at Å.
The redshift number density, is given by and its variance by (Eqs. 9 & 10 of Lanzetta, Turnshek, & Wolfe, 1987). The sum is over all Mgii absorbers having , where is a chosen lower cut off equivalent width. The measured number densities are,
| (1) |
and
| (2) |
with mean redshifts and , respectively.
3.4 Evolution
The redshift evolution of can be written
| (3) |
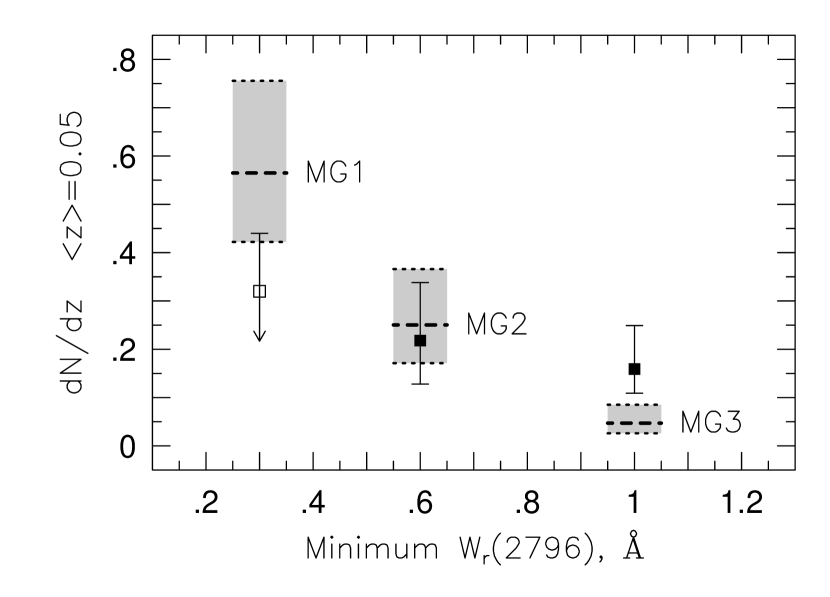
where gives the expectation and the power law index, , parameterizes the redshift evolution. A non–evolving population of objects would have for , respectively. SS92 divided their large, higher redshift sample into three subsamples; MG1 ( Å), MG2 ( Å), and MG3 ( Å).
For subsample MG1, SS92 found with at . The smallest equivalent width detected in this survey is Å; no systems with Å were observed. In this equivalent width bin, extrapolation of SS92 data yield at ; a null detection in this bin is a event. This is suggestive of a paucity of smaller equivalent width systems at very low redshift, which would imply a turnover in the Mgii equivalent width distribution compared to intermediate and higher redshifts.
The expected number of systems with Å from this survey can be estimated using the Mgii equivalent width distribution and correcting for the survey completeness. At , this distribution was observed to follow a power law, , down to Å (Churchill et al., 1999). The normalization constant, , is defined so that is the number of systems with equivalent width per unit equivalent width per unit redshift at . This is written,
| (4) |
where the integral is performed over the minimum and maximum found in the survey, and is the completeness of the survey at .
Assuming and normalizing to the subsample at , the expected for Å is . The quoted errors do not include the uncertainty in the power–law slope (%) of .
In Figure 6, the SS92 data (filled circles) for subsample MG1 and the best fit (solid curve) are shown. The dashed curves show how the slope varies with the uncertainty in power law. For subsample MG1, the SS92 results extrapolate to give at . If the true equivalent width distribution declines for small , then the expected value of for Å serves as an upper limit compared to a non–evolving equivalent width distribution. The expected for Å from this survey is plotted as a open–square data point.
Accounting for the uncertainty in the expected , it is consistent with the SS92 extrapolated value, assuming a non–evolving equivalent width distribution. This consistency lends further support to the suggested turnover for Å. However, one cannot place a significance level on this statement without a priori knowledge of the equivalent width distribution. Again, based only upon the observed data, the lack of a detection in the bin covering Å is significant to the level. As such, the data are suggestive of a turnover in the equivalent width distribution for Å.
The extrapolation for the SS92 subsample MG2 at is and for subsample MG3 is at . These mean redshifts are taken to match those of the and Å subsamples of this survey. In Figure 7, these extrapolated low redshift and their ranges are plotted as horizontal lines in shaded regions for each of the SS92 subsamples. The measured for each are also plotted in Figure 7, where the “no–evolution predicted” value (upper limit) is plotted for Å. The error bars are . These data are also listed in Table 3.
The measured redshift number density for Å is fully consistent with the extrapolations from higher redshift. This would suggest that there is no departure from the SS92 results all the way to for subsample MG2. For Å, there is a marginal suggestion for an overabundance of very strong Mgii systems at . However, this is not a significant result ().
With regard to the equivalent width distribution, the results are slightly at odds with the results of Boissé et al. (1992). They found five systems at redshifts 0.1920, 0.2216, 0.2220, 0.2255, and 0.3937 with rest–frame equivalent widths 0.33, 0.52, 0.55, 0.51, and 0.34 Å, respectively. Their redshift number density is in agreement with SS92 for Å, but is marginally lower for Å. If there is a turnover at very low redshift in the equivalent width distribution below Å, the SS92 and Boissé et al. data would require that it occur rapidly from to .
4 Implications for DLAs at
4.1 Redshift Number Density
Based upon an efficient Mgii–selection method for finding and counting damped Ly absorbers (DLAs), with [atoms cm-2], Rao & Turnshek (2000) showed that there is little to no indication that the redshift number density of DLAs evolves from to . However, at , the inferred redshift number density of Hi galaxies with [atoms cm-2], based upon 21–cm emission surveys, is apparently a factor of five to six lower (Rao & Briggs, 1993; Rao, Turnshek, & Briggs, 1995; Zwaan et al., 1997; Zwaan, Verheijen, & Briggs, 1999). This implies strong evolution of for DLAs, though it is not clear if it is rapid from or more gradual from (Rao & Turnshek, 2000).
Rao & Turnshek found that half of all Mgii systems with and both greater than Å are DLAs with [atoms cm-2]. All four of the Mgii absorbers found in this survey are members of the Å subsample and have strong Feii absorption; they are good candidates for DLAs. Statistically, if half are DLAs, then the implied redshift number density of DLAs at is , which is fully consistent with the values found by Rao & Turnshek at intermediate redshifts (for Å). Note that the system is not a DLA (see § 3.1.4). However, eliminating this system and using the Å subsample yields the same value for .
From Figure 29 of Rao & Turnshek (2000), we see that the at from this work is consistent with their measured at and . Thus, a main result of this Mgii survey is that there is apparently little to no evolution of DLAs over the full redshift range to . This also places the previously inferred DLA redshift number density of 21–cm selected, Hi galaxies with [atoms cm-2] at odds with that determined for Mgii–absorption selected DLAs at .
The bulk of the local Hi resides in the massive–Hi spiral galaxies (Zwaan, Verheijen, & Briggs, 1999). However, for very low to intermediate redshifts, DLAs are associated with galaxies having a variety of morphologies and luminosities ranging down to (Le Brun et al., 1997; Rao & Turnshek, 1998; Turnshek et al., 2001), including low surface brightness (LSB) galaxies (Turnshek et al., 2001; Bowen, Tripp, & Jenkins, 2001). In one case a DLA has no measurable optical counterpart (Steidel et al., 1997) nor narrow band H emission (Bouché et al., 2001). Unless the integral number of LSB and low luminosity Hi–selected galaxies with [atoms cm-2] dominate the number counts (requires a steep faint–end slope to the Hi–selected galaxy luminosity function), these observational facts remain unreconciled, as do the redshift number densities. Some recent 21–cm results are suggestive that the integral number of LSB and low luminosity Hi–selected galaxies may bring the observations into better agreement (Briggs & Zwaan, 2001, private communication; Zwaan et al., 2001).
The roughly constant redshift density of DLAs from strengthens arguments based upon data that DLAs are not tracing galaxies undergoing the bulk of cosmic star formation (e.g., Rao & Turnshek, 2000; Pettini et al., 1999; Steidel et al., 1999), especially since the global star formation rate evolves (decreases) rapidly below .
4.2
The cosmological Hi mass density, , is proportional to the product of the redshift number density and the mean Hi column density of the sample of systems. Rao & Turnshek (2000) found that from absorption lines (ALs) at is dominated by the largest systems, of which there is a relatively large fraction in their sample. That is, the Hi column density distribution function of DLAs is weighted more heavily toward larger column densities than it is for Hi–selected galaxies.
If the distribution of does not evolve from that observed by Rao & Turnshek (2000) for , then the measured from this survey results in an at comparable to that found at intermediate redshift. This is at odds with the cosmological Hi mass density from Hi–selected galaxies, , at . This quantity is a factor of five to six smaller than the value deduced from this work using absorption line statistics.
An accurate measurement of is dependent upon the details of the faint–end slope of the 21–cm emission, Hi mass function. The bulk of the local Hi resides in the massive–Hi spiral galaxies (Zwaan, Verheijen, & Briggs, 1999), so that this slope would need to be quite steep if Hi–rich dwarf and LSB galaxies were to significantly contribute to the value of . Even if the integral number of low luminosity, Hi–rich dwarf and large cross–section LSB galaxies reconciled the absorption–selected DLA and Hi–selected DLA redshift number densities at , it would not necessarily translate to a similar reconciliation for and . This is because the Hi–rich dwarf and LSB galaxies have relatively low Hi masses (Zwaan et al., 2001), so even if their large cross sections reconcile the numbers, their combined mass/numbers are likely not large enough for their integrated Hi mass to raise the value of at .
As such, it seems unlikely that the factor of five to six discrepancy between the absorption line data and the 21–cm emission cosmological Hi mass density can be reconciled by integrating to smaller and smaller decades of Hi mass.
These conclusions are based upon the assumption that there is (1) no bias for a large mean Hi column density from the Rao & Turnshek (2000) Hi column density distribution, and (2) no evolution in the Hi column density distribution from . Note that the distribution at was observed to significantly evolve from in that the lower redshift distribution has a greater fraction of large systems (Rao & Turnshek, 2000). If this evolutionary trend continued, the deduced would be greater, a result that would increase the discrepancy between the absorption line and Hi data.
5 Evolution in Galaxy Gas Cross Sections?
Since is proportional to the product , redshift evolution in would imply redshift evolution in this product. There is also a dependence on the faint–end slope of the luminosity function, which has been seen to weakly evolve from intermediate redshifts (e.g., Marzke et al., 1998). However, this will not be considered here.
For , the normalization of the galaxy luminosity function, , for Mgii absorption selected galaxies (Steidel et al., 1994) is consistent with that of photometric galaxies surveys (e.g., Lilly et al., 1995; Ellis et al., 1996; Lin et al., 1999). However, there is some ambiguity and disagreement as to whether is smaller by a factor of over the redshift range (e.g., Maddox et al., 1990; Loveday et al., 1992; Bertin & Dennefeld, 1997; Marzke et al., 1998).
Assuming no evolution in , the upper limit on Mgii absorber sizes would be kpc. Smaller absorbing cross sections could result from a general relaxation of “halo” gas with time. As such, this might result in the average Mgii absorber at having a relatively large equivalent width and arising at relatively lower impact parameters. This might explain why no Å systems were found in this survey. This is also consistent with the results of Bowen, Blades, & Pettini (1995), who found Å within kpc for four out of five galaxies and no absorption down to Å () beyond kpc for nine of ten galaxies. Unfortunately, they did not sample the impact parameters between and kpc.
These statements depend upon a relatively small survey in which the lack of detected small systems could be dominating the number statistics. Smaller galaxy gas cross–sections would require some level of turnover at small in the equivalent width distribution at .
6 Conclusion
An unbiased survey for Mgii absorption systems at was conducted in 147 FOS spectra. The total redshift path was , with a rapid decline below Å (). Main results of this work are:
(1) Four “unbiased” systems were found, two of which were previously published (Jannuzi et al., 1998). The mean redshift of these systems is . All have Å and three of the four have Å. Each system has strong Feii absorption. They are all candidates for DLAs, though the smallest equivalent width system ( toward PG ) was verified to have well below [atoms cm-2].
(2) The redshift number density of Mgii absorbers at with Å is consistent with the expected value if these systems do not evolve with respect to the number density of higher redshift systems.
(3) No systems in the equivalent width bin Å were found; a null detection in this equivalent width bin is a result. This is somewhat suggestive of a turnover in the equivalent width distribution at Å. If true, this implies that the Mgii gas cross sections of galaxies decreases by at least % from .
(4) Applying the Mgii statistics of Rao & Turnshek (2000) for selecting DLAs, it is found that the redshift number density for DLAs at is consistent with the values they measure at and . Thus, accounting for very high redshift data, there is no evidence for evolution in the number density of DLAs from to .
(5) Assuming no evolution in the Hi column density distribution function, the deduced at is also consistent with the values measure at and ; thus it appears that does not evolve from to .
(6) At , there are now inconsistencies between both the redshift number density and cosmological mass density of absorption selected DLAs and those measured from 21–cm emission Hi–selected galaxies. Even if can be reconciled, it is unlikely that will also be reconciled unless the Hi column density distribution function evolves from to .
With regards to the absorption line data, it must be cautioned that there are concerns about small numbers statistics (including the conversion from Mgii statistics), biasing due to gravitational lensing (overestimates ), and the effects of dust in DLAs (underestimates ). These issues have been discussed in Rao & Turnshek (2000). It would be useful to directly confirm if the strong Mgii absorbers found in this survey are bonafied DLAs.
References
- Bahcall et al. (1993) Bahcall, J. N., et al. 1993, ApJS, 87, 1
- Bahcall et al. (1996) Bahcall, J. N., et al. 1996, ApJ, 457, 19
- Bergeron & Boissé (1991) Bergeron, J., & Biossé 1991, A&A, 243, 344
- Bertin & Dennefeld (1997) Bertin, E., & Dennefeld, M. 1997, A&A, 317, 43
- Boissé et al. (1992) Boissé, P., Boulade, O., Kunth, D, Tytler, D., & Vigroux, L. 1992, A&A, 262, 401
- Boissé et al. (1998) Boissé, P., Le Brun, V., Bergeron, J., & Deharveng, J.–M. 1998, A&A, 333, 841
- Bouché et al. (2001) Bouché, N., Lowenthal, J.D., Charlton, J.C., Bershady, M.A., Churchill, C. W., & Steidel, C.C. 2001, ApJ, 550, 585
- Bowen, Blades, & Pettini (1995) Bowen, B. V., Blades, J. C., & Pettini, M. 1995, ApJ, 448, 634
- Bowen, Blades, & Pettini (1996) Bowen, B. V., Blades, J. C., & Pettini, M. 1996, ApJ, 472, L77
- Bowen, Tripp, & Jenkins (2001) Bowen, D. V., Tripp, T. M., & Jenkins, E. J. 2001, AJ, 121, 1456
- Briggs & Zwaan (2001, private communication) Briggs, F. M., & Zwaan, M. A. 2001, private communication
- Churchill et al. (2000) Churchill, C. W., Mellon, R. R., Charlton, J. C., Jannuzi, B. T., Kirhakos, S., & Steidel, C. C., 2000, ApJS, 130, 91
- Churchill et al. (1999) Churchill, C. W., Rigby, J. R., Charlton, J. C., & Vogt, S. S. 1999a, ApJS, 120, 51
- Ellis et al. (1996) Ellis, R. S., Colles, M., Broadhurst, T., Heyl, J., & Glazebrook, K. 1996, MNRAS, 280, 235
- Jannuzi et al. (1998) Jannuzi, B. T., et al. 1998, ApJS, 118, 1
- Jannuzi & Hartig (1994) Jannuzi, B. T., & Hartig, G. F. 1994, in Calibration of the Science Instruments on HST, ed. J. C. Blades & S. Osmer (Baltimore : STScI), 215
- Lanzetta, Turnshek, & Wolfe (1987) Lanzetta, K. M., Turnshek, D. A., & Wolfe, A. M. 1987, ApJ, 322, 739
- Le Brun et al. (1997) Le Brun, V. Bergeron, J., Boissé, P., & Deharveng, J. M. 1997, A&A, 321, 733
- Lilly et al. (1995) Lilly, S. J., Tresse, L, Hammer, F., Crampton, D., & Le Fèvre, O. 1995, ApJ, 455, 108
- Lin et al. (1999) Lin, L., et al. 1999, ApJ, 518, 533
- Loveday et al. (1992) Loveday, J. Peterson, B. A., Efstathiou, G., & Maddox, S. J. 1992, ApJ, 390, 338
- Maddox et al. (1990) Maddox, S. J., Sutherland, W. J., Efstathiou, G., Loveday, J., & Peterson, B. A. 1990, MNRAS, 247, 1P
- Marzke et al. (1998) Marzke, R. O., Da Costa, L. N., Pellegrini, P. S., Willmer, C. N. A., & Geller, M. J. 1998, ApJ, 503, 617
- Pettini et al. (1999) Pettini, M. Ellison, S. L., Steidel, C. C., & Bowen, D. V. 1999, ApJ, 510, 576
- Rao & Briggs (1993) Rao, S. M., & Briggs, F. H. 1993, ApJ, 419, 515
- Rao & Turnshek (1998) Rao, S. M., & Turnshek, D. A. 1998, ApJ, 500, L115
- Rao & Turnshek (2000) Rao, S. M., & Turnshek, D. A. 2000, ApJS, 130, 1
- Rao, Turnshek, & Briggs (1995) Rao, S. M., Turnshek, D. A., & Briggs, F. H. 1995, ApJ, 449, 499
- Schneider et al. (1993) Schneider et al. 1993, ApJS, 87, 45
- Steidel (1995) Steidel, C.C. 1995, in QSO Absorption Lines, ed. G. Meylan (Garching : Springer Verlag), 139
- Steidel et al. (1999) Steidel, C. C., Adelberger, K. L., Giavalisco, M., Dickinson, M., Pettini, M. 1999, ApJ, 519, 1
- Steidel et al. (1997) Steidel, C. C., Dickinson, M., Meyer, D. M., Adelberger, K. L., & Sembach, K. R. 1997, ApJ, 480, 568
- Steidel, Dickinson, & Bowen (1993) Steidel, C. C., Dickinson, M. & Bowen, D. V. 1993, ApJ, 413, L77
- Steidel et al. (1994) Steidel, C. C., Dickinson, M., & Perrson, E. 1994, 437, L75
- Steidel & Sargent (1992) Steidel, C. C., & Sargent, W. L. W. 1992, ApJS, 80, 1 (SS92)
- Turnshek et al. (2001) Turnshek, D. A., Rao, S., Nestor, D., Lane, W., & Monier, E. 2001, ApJ, 553, 288
- Zwaan et al. (1997) Zwaan, M. A., Briggs, F. H., Sprayberry, D., & Sorar, E. 1997, ApJ, 490, 173
- Zwaan, Verheijen, & Briggs (1999) Zwaan, M. A., Verheijen, M. A. W., & Briggs, F. H. 1999, PASA, 16, 100
- Zwaan et al. (2001) Zwaan, M. A., et al. 2001, to appear in PASP Proceedings for the Ray Fest
| TABLE 1. Unbiased Absorbing Systems | |||
|---|---|---|---|
| Object | , Å | , Å | |
| 3C 232 | |||
| PKS | |||
| Q | |||
| PG | |||
| a Blended with Galactic Mgi | |||
| TABLE 2. Equivalent Widths | |
|---|---|
| ID | , Å |
| 3C 232 | |
| Feii 2344 | |
| Feii 2374 | |
| Feii 2382 | |
| Feii 2600 | |
| Mgii 2796 | |
| Mgii 2803 | |
| MgI 2852 | |
| PKS | |
| Feii 2344 | |
| Feii 2374 | |
| Feii 2382 | |
| Feii 2586 | |
| Feii 2600 | |
| Feii 2600 | |
| Mgii 2796 | |
| Mgii 2796 | |
| Mgii 2803 | |
| Mgii 2803 | |
| Mgi 2852 | |
| Q | |
| Feii 2344 | |
| Feii 2374 | |
| Feii 2382 | |
| Mgii 2796 | |
| Mgii 2796 | |
| Mgii 2803 | |
| Mgii 2803 | |
| Mgi 2852 | |
| PG | |
| Ly 1215 | |
| Cii 1334 | |
| Feii 2344 | |
| Feii 2374 | |
| Feii 2382 | |
| Feii 2600 | |
| Mgii 2796 | |
| Mgii 2803 | |
| a In the Ly forest | |
| b Blended with Galactic Mgi | |
| TABLE 3. Redshift Number Density at | |||
|---|---|---|---|
| SS92 | This Survey | ||
| 0.3 Å | |||
| 0.6 Å | |||
| 1.0 Å | |||