On the Escape of Ionizing Radiation from Starbursts
Abstract
Far-ultraviolet spectra obtained with show that the strong 1036 interstellar absorption-line is essentially black in five of the UV-brightest local starburst galaxies. Since the opacity of the neutral ISM below the Lyman-edge will be significantly larger than in the line, these data provide strong constraints on the escape of ionizing radiation from these starbursts. Interpreted as a a uniform absorbing slab, the implied optical depth at the Lyman edge is huge (). Alternatively, the areal covering factor of opaque material is typically 94%. Thus, the fraction of ionizing stellar photons that escape the ISM of each galaxy is small: our conservative estimates typically yield . Inclusion of extinction due to dust will further decrease . An analogous analysis of the rest-UV spectrum of the star-forming galaxy at =2.7 leads to similar constraints on . These new results agree with the constraints provided by direct observations below the Lyman edge in a few other local starbursts. However, they differ from the recently reported properties of star-forming galaxies at 3. We assess the idea that the strong galactic winds seen in many powerful starbursts clear channels through their neutral ISM. We show empirically that such outflows may be a necessary - but not sufficient - part of the process for creating a relatively porous ISM. We note that observations will soon document the cosmic evolution in the contribution of star-forming galaxies to the metagalactic ionizing background, with important implications for the evolution of the IGM.
1 Introduction
The intergalactic medium (IGM) contains the bulk of the baryons in the universe (e.g., Fukugita, Hogan, & Peebles 1998). Determining the source and strength of the metagalactic ionizing radiation field and documenting its cosmic evolution is crucial to understanding the fundamental properties of the IGM at both low- and high-redshift. The two prime candidates for producing the background are QSOs and star-forming galaxies. While the contribution to the ionizing background from QSOs can be estimated with reasonable accuracy, considerably less is known about the contribution from galaxies. QSOs alone appear inadequate to produce the inferred background (e.g, Madau, Haardt, & Rees 1999), especially at 3 where their co-moving space density declines steeply with increasing redshift (Fan et al. 2000). Moreover, there are only rather indirect constraints on the contribution of galaxies to the ionizing background in the low-redshift universe (e.g., Giallongo, Fontana, & Madau 1997; Devriendt et al. 1998; Shull et al. 1999).
The cosmic history of the formation of massive (ionizing) stars has now been determined in broad terms (e.g., Madau, Pozzetti, & Dickinson 1998; Steidel et al. 1999; Barger, Cowie, & Richards 2000). On-average several thousand ionizing photons are produced for each nucleon processed into stars, so the galactic contribution to the ionizing background is potentially both substantial and calculable. However, the greatest single uncertainty in this calculation is the value for - the fraction of the ionizing photons that escape from star-forming galaxies.
Uncertainties in the value of also map directly into uncertainties in the use of standard emission-line diagnostics to infer the basic properties of star-forming galaxies. Most crucially, the luminosity of the Hydrogen recombination-lines is a widely utilized measure of the formation rate of massive stars in both the local and high-redshift universe (e.g. Gallego et al. 1995; Yan et al. 1999; Pettini et al. 2001). This approach generally assumes that . However, the smaller-than-predicted equivalent widths of the Balmer emission lines in starbursts could imply that this assumption is suspect (e.g. Moy et al. 2000; Stasinska et al. 2001).
An column of only 1.6 1017 cm-2 produces = 1 at the Lyman edge. Mean galactic gas columns are much larger of course, ranging from 1021 cm-2 in normal galactic disks to 1024 cm-2 in nuclear starbursts (e.g., Kennicutt 1998). Starburst-like mean gas columns are inevitable in the Lyman Break Galaxies (Heckman 2000), given their high star-formation rates per unit area (Meurer et al. 1997). The leakage of ionizing radiation out of galaxies must then be determined by the topology of the ISM. As such, theory gives us scant guidance, and so direct measurements of are required.
Leitherer et al. (1995) reported the first direct measurements of using the Hopkins Ultraviolet Telescope to observe far-ultraviolet (far-UV) light below the rest-frame Lyman edge in a sample of four local starbursts, and these data were later reanalysed by Hurwitz, Jelinsky, & Dixon (1997). The resulting upper limits on were typically 3% to 10%. In a very surprising development, Steidel, Pettini, & Adelberger (2001 - hereafter SPA) have reported the detection of escaping Lyman continuum in the combined spectrum of 29 Lyman Break Galaxies at a mean redshift = 3.4. They estimate that the ratio of at 900 Å and 1500 Å ranges from 0.5 to 1 in this composite spectrum (i.e., there is no definite detection of photoelectric opacity due to ). Haehnelt et al. (2001) reach similar conclusions, but point out that star-forming galaxies at only slightly smaller redshifts can not be this porous without violating constraints set by the observed HeII/HI opacity ratio in the forest.
It is clearly important to obtain more determinations of , and to use these measurements to better understand the physical processes that determine . This latter goal can be best accomplished in the local universe, where detailed multiwaveband observations of star-forming galaxies can be made. Unfortunately, direct observations of the emerging Lyman continuum require observing galaxies at redshifts greater than a few percent, so that the foreground opacity of the Milky Way is not significant at the relevant wavelengths (Leitherer et al. 1995; Hurwitz, Jelinsky, & Dixon 1997). Given the modest sensitivity of far-UV telescopes, this has limited such investigations to rather small (and possibly unrepresentative) galaxy samples.
Against this backdrop, we describe our analysis of new far-UV data obtained with for the UV-brightest local starbursts (section 2). We point out that the strongest interstellar lines that trace the phase in these starbursts are black (or very nearly black) at line-center. We show that this implies low values for (section 3). This not only more than doubles the sample of local starbursts with good upper limits on , it illustrates a technique that can potentially be used on a much larger sample of galaxies. Indeed, similar arguments can be applied to high-redshift galaxies (section 4), and show that is also low in the bright star-forming galaxy at =2.7 (Pettini et al. 2000). We discuss these results and their implications in section 5.
2 Observations
2.1 The Sample
We are carrying out a program with the ( - Moos et al. 2000) to obtain spectra of the six starburst galaxies from the Kinney et al. (1993) ‘Ultraviolet Atlas of Star-Forming Galaxies’ having the largest UV flux at 1500 Å through the IUE aperture (Fλ 10-13 erg cm-2 s-1 Å-1). These targets span broad ranges in: 1) metallicity, from 1/8 (NGC 1705) to 2.5 (M 83) times solar, 2) starburst bolometric luminosity, from 3 (NGC 1705) to 2 (NGC 3310) L⊙, 3) internal dust-reddening, from A 0.0 (NGC 1705) to 0.6 (NGC 3310 and M 83), and 4) host galaxy properties, from dwarfs (NGC 1705 and NGC 5253), to irregulars (NGC 4214 and NGC 4449), to spirals (NGC 3310 and M 83). The sample therefore spans most of the multidimensional parameter space of starbursts in the local universe (Heckman et al. 1998). The selection on the basis of rest-frame brightness makes this an appropriate sample to compare to the UV-selected Lyman Break Galaxies at high-redshift.
2.2 Observational Details
The observations undertaken to date are summarized in Table 1. Data have been obtained for 5 of the 6 targets (only NGC 4449 has not yet been observed). Analyses of the dynamics of the ISM in individual galaxies based on these data are being reported elsewhere: Heckman et al. (2001a,b), Martin et al. (2001). The large (LWRS, ) aperture on was used for the observations of 4 of the 5 targets, while NGC 5253 was observed with the medium (MDRS, ) aperture. The corresponding physical sizes of the projected aperture are kpc-scale in all cases but NGC 5253 (Table 1).
The starburst was centered in the aperture of the LiF1 (guiding) channel for each observation by the standard guide-star acquisition procedure. For four targets, flux was recorded through the LWRS apertures in both long wavelength (LiF, Å) channels and both short wavelength (SiC, Å) channels. We obtained no useful data in the SiC channels during our MDRS observations of NGC5253 (A0460404) due to a loss of mirror alignment. We note that while the data do extend slightly below the wavelength of the starburst’s Lyman edge in the SiC1 channel, these data do not usefully constrain . This is because the opacity of foreground Galactic is still significant at these wavelengths, largely due to the confluence of the high-order Lyman series absorption lines (cf. Hurwitz et al. 1997).
Most of the data for this program were obtained at night, which minimizes O I and N I terrestrial airglow contamination in the spectra. The percentage of night to total exposure time averaged , except for NGC 1705 for which the ratio was .
The velocity resolution of the data depends on how the far-UV light illuminates the apertures. The resolution for a filled aperture (NGC 5253) or for a point-like source in the aperture (NGC 1705) is km s-1. We estimate a resolution of 50 to 70 km s-1 in NGC 3310, M 83, and NGC 4214 based on the widths of the narrowest Galactic (foreground) absorption-lines.
2.3 Data Processing
The raw time-tagged photon event lists for each exposure were processed with the standard calibration software () available at the Johns Hopkins University as of January 2001. The lists were screened for valid data, and corrections for geometric distortions, spectral motions, and Doppler shifts were applied (see Sahnow et al. 2000). The individual calibrated extracted spectra for each channel were cross-correlated, shifted to remove residual velocity offsets due to image motion in the apertures, and combined to produce a composite spectrum. These composite spectra in the 1000–1070 Å region were then compared, and any remaining velocity offsets were removed by referencing the Galactic absorption lines to the appropriate Local Standard of Rest velocities.
Since we are interested in measuring the fluxes in the cores of saturated lines, accurate determinations of the residual fluxes are essential. We applied the standard detector background corrections available within for each observation. These corrections account only for the particle event backgrounds ( cnt cm-2 s-1) and do not correct for scattered Ly emission or other stray light. These additional sources of background light are negligble in the LiF1 data at the wavelengths of Å (typically erg cm-2 s-1 Å-1, or less than of the continuum flux). A description of the FUSE backgrounds can be found in the (Blair & Andersson 2001)111This guide (v3.0) can be found on-line at http://fuse.pha.jhu.edu/support/guide/guide.html..
In the following discussion we consider data from the LiF1 channel, which has the highest S/N at the wavelengths of interest for this study ( Å). The data for the other channels are consistent with our findings presented below.
3 Results from the FUSE Data
In Figure 1 we show the spectral region around the , C II 1036.337 and O I 1039.230 absorption-lines in the five galaxies in our sample. It is immediately apparent that the cores of the C II 1036 and Lyman lines are quite black. The residual normalized intensities in the C II line are typically 6% (Table 2). These C II residual intensity estimates account for overlying Galactic absorption due to the Milky Way O VI or H2 R(1) and P(1) lines. There are no H2 lines within the starbursts themselves that contribute to the depth of the C II line. We modeled the Galactic absorption features using the shorter wavelength member of the O VI doublet () or other H2 R(1) and P(1) lines (typically P(1) 1003.294, 1014.326 and R(1) 1013.435) to get both the velocity extents and expected depths of the overlying lines. We note that the calculation of the residual intensity is also corrected for the effect of the maximum plausible stellar contribution to the C II line. Model starburst spectra (Gonzalez Delgago, Leitherer, & Heckman 1997) show that the stellar photospheric line (which is entirely due to B stars) will depress the local continuum by a factor of 1.2 to 2 (primarily depending on the age of the starburst). In our sample, the stellar contribution to C II should be largest in the B-star-dominated spectrum of NGC 1705. Even in this case the C II line is primarily interstellar, since it (like the other interstellar lines) is blueshifted by roughly 40 km s-1 relative to the galaxy systemic velocity (Heckman et al. 2001, and see also Heckman & Leitherer 1997).
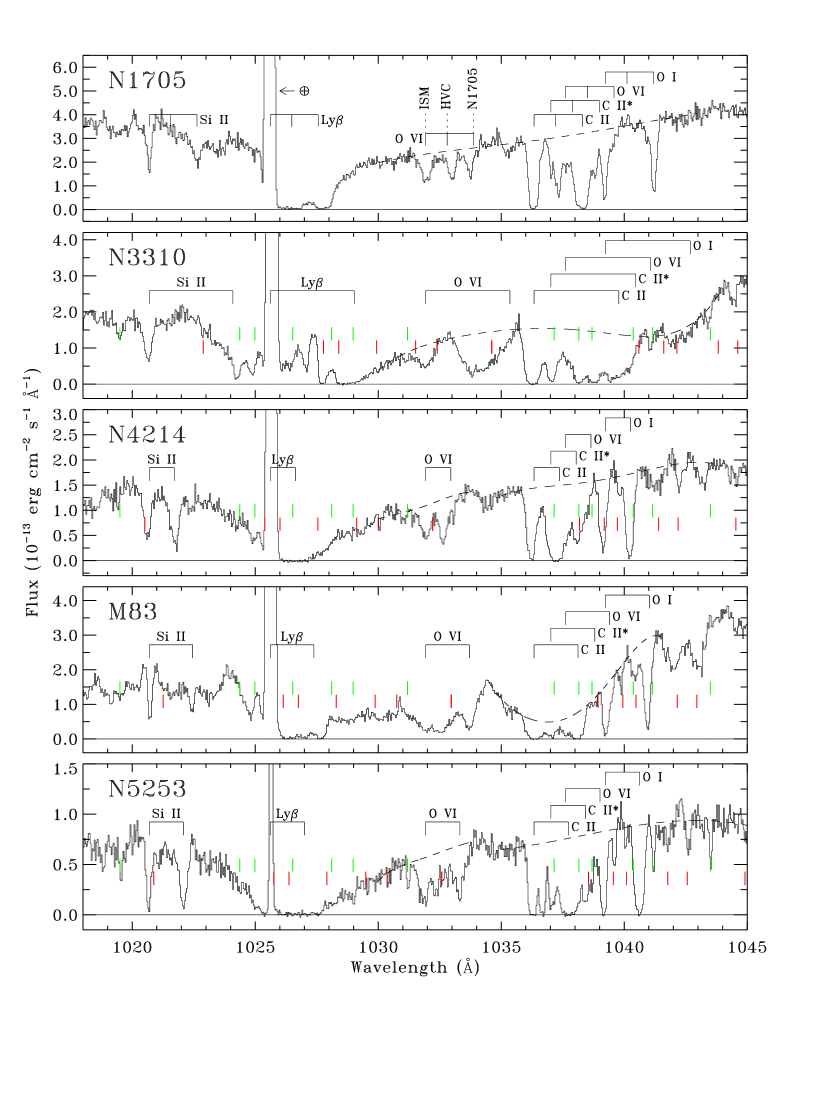
The O I 1039 line shows behavior ranging from a normalized residual intensity of about 15% in NGC 1705 to 6% in NGC 5253. Overlying Galactic absorption is not an issue for the O I at the resolution of the data. Both O I and C II arise in H I regions and contain direct information about the H I column density and areal covering factor of the neutral gas.
We begin by writing the ratio of the optical depth at the Lyman edge to the optical depth at line center. Following Spitzer (1977), this is
| (1) |
where is the ratio of the H I and ground-state ionic columns, is the normal Doppler parameter (), is the oscillator strength, and the wavelength is measured in . Assuming that O I and C II are the dominant ionic species of their respective element in the H I phase, this can be written as
| (2) |
where is the gas-phase or abundance in solar units and = 8.6 for C II 1036 and = 50 for O I 1039 (Morton 1991). The important point is that the optical depth at the Lyman edge is much larger than the optical depth at line-center for either line for typical values of and . Corrections for grain-depletion will only increase the implied ratio of . Ionization corrections are unimportant for O I since it is closely coupled to H I through charge exchange reactions, and will only increase the implied ratio of for C II.
As an example, consider the case of NGC 1705 (Heckman et al. 2001). Based on the nebular emission-lines, the gas-phase Oxygen abundance is 1/8 solar, and this is consistent with the abundances derived in the H I gas for , , and from the spectra. The measured value is 4010 km s-1. The residual intensity at the core of the 1039 line implies = 1.8 (for unit covering factor - see below). Equation 2 above then implies that = 280. This is roughly consistent with the column we derived from fitting the series lines: = 1.5 cm-2. Thus, in the context of a homogeneous absorbing slab, the escaping fraction of ionizing photons will be almost identically zero in NGC 1705. In principle, even more severe constraints on can be placed using weaker absorption-lines (transitions having smaller values of ). We do not take this approach, since even the strong O I 1039 line already implies 0.
Less stringent (more realistic) constraints on can be placed by adopting a “picket fence” model in which the areal covering factor of optically-thick is not unity (e.g., ionizing radiation can escape through “holes” in the ). In this case, the upper limit on the residual intensity at the center of the 1036 line implies that the covering factor must be 94%, so that the upper bound on the escape fraction for ionizing radiation is 6%.
We have undertaken this analysis for the other four galaxies in our sample, and report the results in Table 2. In all cases, the results are similar to those in NGC 1705, with implied values for that are almost identically zero (for the homogeneous slab model) and 6% for the picket-fence model. The values listed in Table 2 should be considered stringent upper limits for the following reasons: 1) We list only the limits derived from the picket fence model. 2) We measured at velocities where the residual flux was greatest after accounting for possible contamination by other absorption features. 3) Scattered light may contribute at low levels () and only serves to strengthen the limit on . 4) The FUSE line spread function (LSF) likely consists of two components: a narrow component accounting for of the LSF area and a broad component accounting for and having times the width of the narrow component. While the exact details of the LSF are presently unknown, such a model more accurately describes the shapes of the cores of the Galactic H I lines toward nearby stars than a single component LSF. As a result, it is possible that some of the observed flux in the line cores is simply redistributed light from nearby continuum regions within Å of the line. 5) The continuum estimates for the interstellar lines shown in Figure 1 are conservative estimates and are unlikely to be lower than those shown. 6) The upper limits on can be pushed to even smaller values by including the opacity due to dust (that is, our technique measures only the contribution of the photoelectric opacity of H I). Application of the empirical starburst dust attenuation law (Calzetti 1997; Meurer, Heckman, & Calzetti 1999) to the spectra of these galaxies implies an extinction due to dust at 1500Å ranging from negligible (NGC 1705) to 3 magnitudes in M 83 and NGC 3310. The mean dust opacity in the Lyman continuum (1 to 4 Ryd) should be larger still (Mathis 1990).
We conclude that our UV-selected starbursts are quite opaque to their own ionizing radiation. This confirms the results of Leitherer et al. (1995) and Hurwitz, Jelinsky, & Dixon (1997), but generalizes and strengthens them.
4 Galaxies at High-Redshift
The technique described above can be applied to galaxies at high-redshift. As an application, we consider the star-forming galaxy at =2.7 (Yee et al. 1996). Thanks to strong gravitational lensing, its flux has been amplified by a factor of 30 (Seitz et al. 1998). Thus, the rest-frame UV spectrum discussed by Pettini et al. (2000) is by far the best of its kind. We display the spectral region from to 1335 in Figure 2. The quoted spectral resolution in these data is 200 km s-1 FWHM, while the interstellar lines are much broader (500 to 700 km s-1) and very deep. It is instructive to note that the value for (equation 1) for the 1335 (1302) line is 0.1 (0.8) dex larger than for the 1036 (1039) line in our spectra. Thus, the spectrum of can be straightforwardly compared to the local starbursts.

The measured residual intensites in the line cores in the spectrum are: (1%), 1260 (7%), 1302 (6%), and 1335 (2%). To apply equations 1) and 2) above, we adopt a gas-phase metallicity of 1/4 solar (Pettini et al. 2000; Leitherer et al. 2001; Tremonti et al. 2001) and take = 300 km s-1 based on the line-widths reported by Pettini et al. (2000). The implied optical depth at the Lyman edge assuming a uniform slab is 300. Pettini et al. (2000) derive an column of 7.51020 cm-2 from the damped line, yielding an even larger value for for a uniform slab. Alternatively, the residual intensity at the core of the 1335 line implies an areal covering factor of optically-thick gas of 98%. The implied value for ranges from 0 to 2%. These values are consistent with the results for the local starbursts in section 3 above.
The situation is quite different in the faint Lyman Break Galaxies at 3. As SPA point out, the interstellar lines in their composite spectrum are far from black (the apparent residual intensities are roughly 70% at line center). The composite spectrum of Lyman Break Galaxies at = 3.0 in the Hubble Deep Field is similar (Lowenthal et al. 1997). It is possible in these cases that spectra with higher spectral resolution and signal-to-noise would show that the lines are in fact nearly black over narrow ranges in velocity. However, the existing data are consistent with the conclusion of SPA that the escape fraction of ionizing radiation is large in these galaxies.
5 Discussion
The results we have reported for five of the six UV-brightest local starbursts (NGC 1705, NGC3310, NGC 4214, NGC 5253, and M 83) implies that UV-bright starburst galaxies today are highly opaque to their own ionizing radiation. This agrees with results for a small sample of more distant starbursts described by Leitherer et al. (1995) and Hurwitz et al. (1997). These results in turn are consistent with the estimate by Shull et al. (1999) that the strength of the local metagalactic ionizing background implies that the fraction of ionizing photons that escape from star-forming galaxies can not exceed a global average value of about 5%.
These results are in striking contrast to the detection of significant escaping Lyman continuum radiation from Lyman Break Galaxies at 3 to 4 by SPA. Our analysis shows that the star-forming galaxy at 2.7 is similar to the local starbursts: it too must be highly opaque below the Lyman break. Taking the current results at face value, we are left with a puzzle. Why is the topology/structure of the neutral interstellar medium apparently so different between the galaxies studied by SPA and those in the present paper?
In some ways this is a surprising result, because local starbursts and Lyman Break Galaxies are remarkably similar in most respects (e.g., Heckman 2000). Meurer et al. (1997) showed that both have the same bolometric surface-brightnesses, and therefore the same star formation rates per unit area. This implies that the basic physical properties of the ISM should be similar. The surface-mass-densities in the stars () and the interstellar gas () that fuels the star-formation must be similar. The radiant energy density in the ISM must be similar (103 times higher than in the Milky Way), as must the rate of mechanical energy deposition (supernova heating) per unit area or volume. Simple considerations of hydrostatic equilibrium imply correspondingly high total pressures in the ISM in both: , or few 107 K cm-3. This is several thousand times the value in the local ISM in the Milky Way. Finally, the characteristic dynamical time in the ISM will be short in both cases: few Myr (where 102 pc is the thickness of the disk). Perhaps the most striking difference is the size-scale: starbursts in the local universe are generally circum-nuclear events (sizes of to pc) imbedded in a much larger galaxy, while the intense star-formation in the Lyman Break Galaxies appears to be a galaxy-wide event (sizes of to pc). This might lead to fundamental differences in the global properties of the ISM.
Such generic arguments aside, is there any empirical evidence that the structure or dynamics in the ISM in our specific sample of local starbursts differs from the Lyman Break Galaxies? We consider two possibilities.
First, our sample galaxies have considerably lower luminosities (star-formation rates) than the typical Lyman Break Galaxies: 8.5 to 10.3 vs. 10.7 to 11.7 (Adelberger & Steidel 2000). It seems physically plausible that the ISM might become more porous in starbursts with higher star-formation (and energy deposition) rates (cf. Lehnert & Heckman 1996). We have tested this idea by considering data on for more powerful local starbursts. Two of the four starbursts observed below the Lyman break by Leitherer et al. (1995) are powerful systems with . Both are opaque in the Lyman continuum: 2% and 4% for Mrk 496 and IRAS 08339+6517 respectively (Hurwitz et al. 1997). We have also searched the HST archives for UV spectra of powerful local starbursts taken with a spectral resolution comparable to our data and with a projected aperture size (kpc-scale) comparable to our data. There are three such starbursts in the sample investigated by Kunth et al. (1998), who used the echelle mode to observe the , 1302, and 1304 lines with a resolution of 20 km s-1. These starbursts have luminosities () of = 10.4 (ESO 400-G043), 11.0 (IRAS 08339+6517), and 11.2 (ESO 350-IG038). These interstellar lines are black in two cases (ESO 400-G043 and ESO 350-IG038), and have a residual intensity of 60 to 70% in the third case (IRAS 08339+6517). While a large value for is therefore possible in this galaxy, direct observations below the Lyman break actually show that 4% in this case (Hurwitz et al. 1997).
A second possibility is that large values for are created by supernova-driven galactic outflows (superwinds) that clear out channels through which ionizing radiation can escape (SPA). The tracers of superwinds in Lyman Break Galaxies are their blueshifted interstellar absorption-lines (Franx et al. 1997; Pettini et al. 1998; 2000; 2001). Indeed, the composite spectrum of the 29 Lyman Break Galaxies analyzed by SPA shows the clear signature of these outflows: the interstellar absorption-lines are blueshifted by 400 to 500 km s-1 with respect to the emission-line. This outflow signature is also seen in the composite spectrum formed from the sum of the spectra of 12 Lyman Break Galaxies in the HDF at 3 (Lowenthal et al. 1997; Franx et al. 1997). As noted above, the relative shallowness of the interstellar lines in both these composite spectra is consistent with (but does not demand) a large value for .
Similar outflows are seen in the UV spectra of local starbursts (Kunth et al. 1998; Gonzalez Delgado et al. 1998), and Heckman et al. (2000) have shown that high-velocity outflows of neutral gas are common in powerful ( 1011 ) local starbursts. In contrast, our data reveal high-velocity ( 102 km s-1) outflows in the neutral phase of the ISM in only one of our five galaxies: NGC 3310, in which the mean outflow velocity is about -200 km s-1 (see Figure 1). In the other galaxies the neutral-phase absorption-lines arise in relatively quiescent gas near the galaxy systemic velocity (Figure 1; Martin et al. 2001; Heckman et al. 2001). Based on the ISM dynamics, it is perhaps not surprising that NGC 1705, NGC 4214, NGC 5253, and M 83 are opaque to their Lyman continuum radiation.
On the other hand, Gonzalez Delgado et al. (1998) have shown that outflows at several hundred km s-1 are present in the neutral gas in at least three of the four starbursts observed below the Lyman break by Leitherer et al. (1995). In all cases the galaxy is opaque below the Lyman break, with typically 3 to 10%. Of the three powerful starbursts observed by Kunth et al. (1998), two (ESO 400-G043 and ESO 350-IG038) show black interstellar lines and outflows at = -225 and -58 km s-1 respectively. In the third (IRAS 08339+6517), the lines have a residual intensity of 60 to 70%, and are strongly blueshifted by -500 km s-1 (Gonzalez Delgado et al. 1998).
We conclude that the currently avalilable data do not demonstate that galactic winds inevitably produce large values of in local starbursts. Such outflows appear to be a necessary - but not sufficient - part of the process that creates an ISM that is porous to ionizing radiation.
In the near future we will use to observe a sample of more powerful starbursts ( = 41010 to 41011 ). This will allow us to probe the Lyman continuum opacity in more starbursts with luminosities (and star formation rates) that are similar to those of typical Lyman Break Galaxies. At the same time, the extension of the investigation at high-redshift to a wider range of Lyman Break Galaxies can help clarify the situation. In particular, it will be important to test the high values for by obtaining data on both the Balmer recombination-lines and the Lyman continuum in the same set of galaxies (to provide a consistency check). Finally, the mission (Martin et al. 1999) will directly measure the escaping flux below the Lyman break for the population of star-forming galaxies in the redshift range 0.4 to 2 (the epoch that apparently dominates the cosmic history of star-formation). Thus, over the next few years, we should be able to make the first good direct measurement of the contribution of star-forming galaxies to the metagalactic ionizing background as a function of cosmic epoch. This will have important implications for the history of the IGM.
References
- (1) Adelberger, K., & Steidel, C. 2000, ApJ, 544, 218
- (2) Barger, A., Cowie, L., & Richards, E. 2000, AJ, 119, 2092
- (3) Calzetti, D. 1997, AJ, 113, 162
- (4) Devriendt, J., Sethi, S., Guiderdoni, B., & Nath, B. 1998, MNRAS, 298, 708
- (5) Fan, X., et al., AJ, 121, 54
- (6) Franx, M., Illingworth, G., Kelson, D., van Dokkum, P., & Tran, K.-V. 1997, ApJL, 486, L75
- (7) Fukugita, M., Hogan, C., & Peebles, J. 1998, ApJ, 503, 518
- (8) Gallego, J., Zamorano, J., Aragon-Salamanca, A., & Rego, M. 1995, ApJL, 459, L1
- (9) Giallongo, E., Fontana, A., & Madau, P. 1997, MNRAS, 289, 629
- (10) Gonzalez Delgado, R., Leitherer, C., & Heckman, T. 1997, ApJ, 489, 610
- (11) Gonzalez Delgado, R., Leitherer, C., Heckman, T., Lowenthal, J., Ferguson, H., & Robert, C. 1998, ApJ, 495, 698
- (12) Haehnelt, M., Madau, P., Kudritzki, R., & Haardt, F. 2001, ApJL, 549, L151
- (13) Heckman, T., 2000, Phil. Trans. Roy. Soc., 358, No. 1772, 2077
- (14) Heckman, T., & Leitherer, C. 1997, AJ, 114, 69
- (15) Heckman, T., Lehnert, M., Strickland, D., & Armus, L. 2000, ApJS, 129, 493
- (16) Heckman, T., Robert, C., Leitherer, C., Garnett, D., & van der Rydt, F. 1998, ApJ, 503, 646
- (17) Heckman, T., Sembach, K., Meurer, G., Strickland, D., Martin, C.L., Calzetti, D., & Leitherer, C. 2001, ApJ, in press (astro-ph/01022830
- (18) Hurwitz, M., Jelinsky, P., & Dixon, W. 1997, ApJ, 481, 31
- (19) Kennicutt, R. 1998, ApJ, 498, 541
- (20) Kinney, A., Bohlin, R., Calzetti, D., Panagia, N., & Wyse, R. 1993, ApJS, 86, 5
- (21) Kunth, D., Mas-Hesse, Terlevich, E., Terlevich, R., Lequeux, J., & Fall, S.M. 1998, A&A, 334, 11
- (22) Lehnert, M., & Heckman, T. 1996, ApJ, 462, 651
- (23) Leitherer, C., Ferguson, H., Heckman, T., & Lowenthal, J. 1995, ApJL, 454, L19
- (24) Leitherer, C., Leao, J., Heckman, T., Lennon, D., Pettini, M., & Robert, C. 2001, ApJ, in press (astro-ph/0012358)
- (25) Lowenthal, J., Koo, D., Guzman, R., Gallego, J., Phillips, A., Faber, S., Vogt, N., Illingworth, G., & Gronwall, C. 1997, ApJ, 481, 673
- (26) Madau, P., Pozzetti, L., & Dickinson, M. 1998, ApJ, 498, 106
- (27) Madau, P., Haardt, F., & Rees, M. 1999, ApJ, 514, 648
- (28) Martin, C.D., Bianchi, L., Donas, J., Heckman, T., Madore, B., Malina, R., Milliard, B., Friedman, P., Rich, M., Schiminovich, D., Siegmund, O., & Szalay, A. 1999, in Ultraviolet-Optical Space Astronomy Beyond HST, ASP Conference Series 164, ed. J. Morse, J. M. Shull, & A. Kinney, p. 182
- (29) Martin, C.L., Heckman, T., Sembach, K., Meurer, G., Calzetti, D., & Leitherer, C. 2001, in preparation
- (30) Mathis, J. 1990, ARA&A, 28, 37
- (31) Meurer, G., Heckman, T., Lehnert, M., Leitherer, C., & Lowenthal, J. 1997, AJ, 114, 54
- (32) Meurer, G., Heckman, T., & Calzetti, D. 1999, 521, 64
- (33) Moos, H.W. et al. 2000, ApJ, 538, L1
- (34) Morton, D. 1991, ApJS, 77, 119
- (35) Moy, E., Rocca-Volmerange, B., & Fioc, M. 2000, A&A, 365, 347
- (36) Pettini, M., Kellogg, M., Steidel, C., Dickinson, M., Adelberger, K., & Giavalisco, M. 1998, ApJ, 508, 539
- (37) Pettini, M., Steidel, C., Adelberger, K., Dickinson, M., & Giavalisco, M. 2000, ApJ, 528, 96
- (38) Pettini, M., Shapley, A., Steidel, C., Cuby, J.-G., Dickinson, M., Moorwood, A., Adelberger, K., & Giavalisco, M. ApJ, in press (astro-ph/0102456)
- (39) Sahnow, D.S., et al. 2000, ApJ, 538, L7
- (40) Seitz, S., Saglia, R., Bender, R., Hopp, U., Belloni, P., & Ziegler, B. 1998, MNRAS, 298, 945
- (41) Shull, S.M., Roberts, D., Giroux, M., Penton, S., & Fardal, M. 1999, AJ, 118, 1450
- (42) Spitzer, L. 1977, Physical Processes in the Interstellar Medium, Wiley & Sons
- (43) Stasinska, G., Schaerer, D., & Leitherer, C. 2001, A&A, 370, 1
- (44) Steidel, C., Adelberger, K., Giavalisco, M., Dickinson, M., & Pettini, M. 1999, ApJ, 519, 1
- (45) Steidel, C., Pettini, M., & Adelberger, K. 2001 (SPA), ApJ, 546, 665
- (46) Tremonti, C., Calzetti, D., Leitherer, C., & Heckman, T. 2001, ApJ, in press (astro-ph/0103432)
- (47) Yan, L., McCarthy, P., Freudling, W., Teplitz, H., Malumuth, E., Weymann, R., & Malkan, M. 1999, ApJL, 519, L47
- (48) Yee, H., Ellingson, E., Bechtold, J., Carlberg, R., & Cuillandre, J.-C. 1996, AJ, 111, 1783
| Galaxy | Dataset | Obs. Date | TexpaaOn-target exposure time in the LiF1 channel. | Aper.bbAperture sizes. MDRS: 420 ; LWRS: 3030 . | ccPhysical size of projected FUSE aperture. | |||
|---|---|---|---|---|---|---|---|---|
| () | () | (erg cm-2 s-1 Å-1) | (y/m/d) | (ksec) | (kpc) | |||
| NGC 1705 | 261.08 | 38.74 | A0460102 | 2000/02/04 | 7.7 | LWRS | 0.90.9 | |
| A0460103 | 2000/02/05 | 13.6 | LWRS | |||||
| NGC 3310 | 156.01 | +54.06 | A0460201 | 2000/05/05 | 27.1 | LWRS | 2.562.56 | |
| NGC 4214 | 160.25 | +78.08 | A0460303 | 2000/05/12 | 20.7 | LWRS | 0.500.50 | |
| M 83 | 314.58 | +31.97 | A0460505 | 2000/07/06 | 26.5 | LWRS | 0.550.55 | |
| NGC 5253 | 314.86 | +30.11 | A0460404 | 2000/07/07 | 27.4 | MDRS | 0.400.08ddAperture position angle = 195.87. No useful SiC data obtained for this MDRS observation. |
| Galaxy | (C II) | Notes on and nearby absorption | |
|---|---|---|---|
| (km s-1) | (%) | ||
| NGC 1705 | 569 | Weak Galactic high velocity O VI in red wing of profile. | |
| No H2 absorption at nearby velocities. | |||
| NGC 3310 | 997 | Value of increases along redward wing of absorption. | |
| NGC 4214 | 298 | Weak Galactic H2 R(1) on blue side of profile. | |
| M 83 | 517 | Weak Galactic H2 P(1) on red side of profile. | |
| Galactic O VI on blue side of profile. | |||
| NGC 5253 | 405 | Weak Galactic H2 P(1) on red s ide of profile. | |
| Galactic O VI on blue side of profile. |