RX J0848+4456: Disentangling a Moderate Redshift Cluster11affiliation: Based on observations with the NASA/ESA Hubble Space Telescope, obtained at the Space Telescope Science Institute, which is operated by the Association of Universities for Research in Astronomy, Inc. under NASA contract No. NAS5-26555.
Abstract
We present a multi-wavelength study of RX J0848+4456, a cluster of galaxies discovered through X-ray emission in the ROSAT Deep Cluster Survey. Our observations consist of WFPC2 imaging, optical spectra, and X-ray data collected with the Chandra observatory. We find that RX J0848+4456 consists of an X-ray emitting cluster of galaxies at a redshift of and a group at slightly lower redshift, , with little X-ray emission. This lower redshift system, however, is a gravitational lens, with the lensed galaxy an unusual AGN or star-forming system at .
The cluster has an X-ray temperature of kT = keV, a bolometric luminosity of erg s-1 and a velocity dispersion of . These values all agree with the low redshift correlations for clusters of galaxies, implying a relaxed system with the ICM in equilibrium with the dark matter potential. The lower redshift group of galaxies at has, at most more likely , of the X-ray luminosity of RX J0848+4456. Despite being a gravitational lens, this is a low mass system, with an X-ray temperature of kT = keV and a velocity dispersion of only . Our observations show the importance of detailed studies of clusters of galaxies when using them as probes of cosmological mass functions.
1 Introduction
In order to understand the formation and evolution of clusters of galaxies, not only are large samples needed, but the clusters in those samples must be well understood. Theoretical predictions for clusters of galaxies usually present the space density of objects as a function of mass, redshift, and cosmology. Clusters are, however, found by their X-ray luminosity, optical richness, or weak lensing signal. Given a complete sample of clusters of galaxies found through one of these methods, it is necessary to conduct a variety of follow-up observations to understand the relation between the observed quantities and the binding mass. Only then can meaningful comparisons with theoretical predictions be made.
We present here our follow up observations of RX J0848+4456, a cluster discovered in the ROSAT Deep Cluster Survey (Rosati et al., 1998, RDCS) with a flux of erg s-1 cm-2 (0.5–2.0 keV, observed) at 08h 48m 4688 and = 44° 56′ 217 (J2000). We have acquired X-ray data from Chandra, deep HST and ground based imaging, and redshifts of cluster members from the Keck Observatory. Each of these datasets, discussed in §2, sample different aspects of the cluster’s dark matter potential. The X-ray data probes the hot intra-cluster medium, the optical imaging is used for measuring the projected cluster potential through gravitational lensing, and the redshifts sample the potential along the line of sight. We will show our results in §3. We have learned that any individual data set would give us a skewed picture: all of the data sets need to be examined to model this system as shown in §4. We summarize our results and discuss the ramifications this moderate redshift cluster might have for other cluster surveys in §5. We use , and for our cosmological parameters. At the redshift of interest, this corresponds to approximately 7 kpc per arcsecond.
2 Data
2.1 Optical Spectra
For the first spectroscopic observations of RX J0848+4456, done in November of 1998, one of us (GKS) selected galaxies from an I band image observed with the Prime Focus camera the KPNO Mayall 4m. Galaxies were selected by eye from a 8′ by 6′ section, the size of the Low Resolution Imaging Spectrograph (Oke et al., 1995, LRIS) field of view, based on their size and apparent magnitude. For the second set of spectroscopic observations, taken in February of 2000, we supplemented our original I band image with a R band image taken with LRIS at the Keck observatory. We used the R-I color to find the red sequence usually found in clusters as a means of selecting candidates for that last observing run. The selected galaxy sample is not complete for any of the three selection criteria.
We used LRIS on the Keck I telescope to observe spectra of 71 galaxies with three different slit masks, between the two sets of observations, using the 600 line mm-1 grating blazed at 7500 Å. This grating produces 1.3 Å per pixel resolution for our spectra. We observed each mask multiple times with 1200 to 1800 second observations, and made offsets across the dispersion direction to dither the observations. The total integration times for the three masks ranged from 4800 seconds in good conditions to 7200 seconds in the worst conditions. For this rest of the paper we will refer to these as the high dispersion or high resolution spectra.
We reduced the two-dimensional data using a set of IRAF111The Image Reduction and Analysis Facility (IRAF) software is provided by the National Optical Astronomy Observatories (NOAO), which is operated by the Association of Universities of Research in Astronomy for Research in Astronomy, Inc., under contract to the National Science Foundation. scripts optimized for LRIS observations. These scripts greatly reduce the fringing evident in LRIS spectra at long wavelengths when combined with dithered observations. We extracted one-dimensional spectra using the IRAF package APEXTRACT.
Using the RVSAO package (Kurtz & Mink, 1998), we measured redshifts of the extracted spectra with the cross-correlation technique. We used fabtemp97 (Kurtz & Mink, 1998, which contains details on this template) as the cross-correlation template. We successfully measured redshifts for 62 galaxies in our sample. Of these 62, 34 had correlation values greater than two. The remaining 28 redshifts were determined by visual examination and fitting absorption or emission features. Of those 28 spectra, 20 were pure emission spectra while the remaining eight were fit with a combination of emission and absorption features. The average error on the redshift estimates, regardless of whether or not they used the results from RVSAO, is or 81 km s-1.
In addition to these targeted spectra, RX J0848+4456 falls within the Lynx field of a field galaxy sample from the Spectroscopic, Photometric, Infrared-Chosen Extragalactic Survey (Eisenhardt et al., 2001, SPICES). Specifically, the Lynx portion is a 5′ by 5′ field centered at = 08h 48m 44 8 and = 44° 54′ 259 (J2000). Many cluster members have been observed as part of the spectroscopic part of this study using LRIS to observe all galaxies with the 150 line mm-1 grating, which yields a resolution of 4.8 Å pixel-1. These spectra, which we will refer to as the low resolution sample, are useful for determining cluster membership but not velocity dispersions. The spectral data for the SPICES survey was reduced using a similar set of IRAF scripts as the 600 line mm-1 grating data. As of the write of this paper, we have 144 redshifts in the Lynx field of SPICES, though this includes all spectra taken at the higher resolution that both fall within the SPICES survey field and magnitude limit.
2.2 HST Imaging
Besides the ground based imaging, there are two sets of HST WFPC2 mosaics for RX J0848+4456. Both data sets used the F702W filter and had a total of ten 1200 second exposures. The northern set of HST images, observed on April 20, 1999, are centered on = 08h 48m 4955 and = 44° 57′ 1938 (J2000), while the southern set, observed on April 30, 2000, was centered on = 08h 48m 4944 and = 44° 54′ 3881 (J2000). The northern set had a roll angle of 288° while the southern set had a roll angle of 284°. The combination of the two sets of exposures samples the core of the cluster while giving a good coverage of the less dense outer regions.
We reduced the WFPC2 data using the tools provided by the IRAF/STSDAS222Space Telescope Science Data Analysis System (STSDAS) is distributed by the Space Telescope Science Institute. standard pipeline software, including the DITHER and DITHERII packages (Fruchter & Hook, 1998). We fit and removed the background sky level from each chip of the separate WFPC2 images. Next, to identify bad pixels, we used the information in the image data quality files, and we took advantage of the information from the multiple dither positions to identify cosmic rays. We cross–correlated each chip of the separate images with a common reference position to derive dither offsets between each image. Using these offsets, we used the drizzle task to align the images, and generated median images from these coaligned images. We then shifted the median images back to the original positions via the blot task, and used the driz_cr task to compare them to the original exposures to identify cosmic rays and hot pixels. Masking out the identified bad pixels and cosmic–rays, and using the derived image offsets, we drizzled each of the four chips from the ten separate exposures to produce a single final output image with a pixel scale of pix-1, the scale of the PC chip in the WFPC2 instrument. In Figure 1, we show a subset of the data centered on the core of the cluster.
2.3 X-ray Imaging and Spectra
RX J0848+4456 was observed as part of a 190 ks Chandra ACIS-I observation of the Lynx field. The X-ray observations were broken up into two parts, one of 62.1 ks (Obs ID 1708) taken on May 3, 2000 and one of 126.7 ks taken on May 4, 2000 (Obs ID 927). Each observation was done with the faint mode when ACIS was operating at a temperature of -120 C.
We processed the Level 1 data for each observation using the CIAO v1.1.5 software. We cleaned the Level 1 event list for all events with ASCA grades of 1, 5 and 7, filtered the data not in good time intervals, removed bad offsets and removed bad columns. We then removed, on a chip by chip basis, 3.3 second time intervals when the count-rate exceeded three standard-deviations above the average count-rate, a rate of 1.25 counts per second. Once we had created two clean event files and corresponding exposure maps, we merged the two exposures into one event file for the whole pointing. For both the Level 1 processing and the spectral analysis, we used the ACIS calibration files that were available on September 15, 2000.
3 Physical Measurements
3.1 Cluster Redshift and Velocity Dispersion
We used the 600 line mm-1 grating redshifts measured in §2.1 to determine the redshift and velocity dispersion of RX J0848+4456. First, we used the gap technique of Katgert et al. (1996) to define groups with similar redshifts. This technique simply groups galaxies where the difference in the redshifts between group members is less than a cutoff. If more than a certain number of galaxies have spacings smaller than the cutoff, that is declared a group along the line of sight. No spatial position information is used. We chose the parameters of Adami et al. (2000), i.e. a gap of 1000 in the rest frame of the galaxies and a group size of five or more galaxies. Using those parameters, we find two groupings, one with 17 galaxies (with 12 absorption-line and five emission-line redshifts) and one with 11 (with nine absorption-line redshifts, one emission-line redshift and one combination). The remaining galaxies are spread uniformly over .
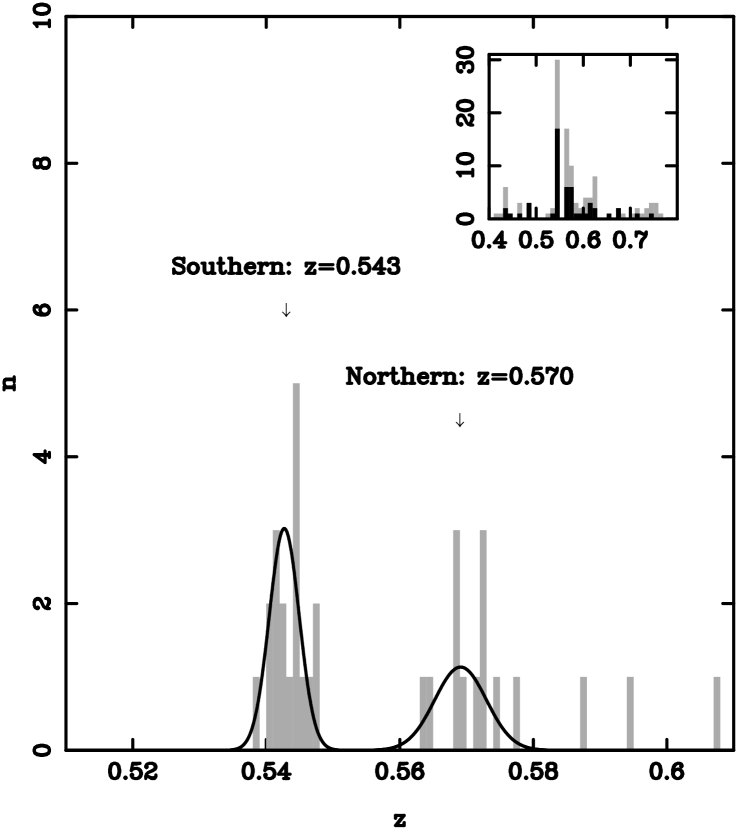
For each grouping, we used the biweight estimators of Beers et al. (1990) to determine the cluster redshift and velocity dispersions. We find that the grouping of 17 galaxies is at a redshift of and the grouping of 11 has a redshift of . To estimate the velocity dispersions, we used the biweight scales from Beers et al. (1990). We calculated a value of for the lower redshift system and for the higher redshift system. We computed the errors on the velocity dispersions using a jackknife estimate (Beers et al., 1990). In Figure 2, we plot the velocity distribution along the line of sight with the two groupings marked. Over the histogram, we plot two Gaussians with a mean and variance specified by the biweight values above. As an inset, we plot both the high dispersion redshifts along with the lower dispersion redshifts from SPICES with bins ten times larger. The high dispersion spectra are in bins colored black while the low dispersion spectra are in grey bins. There are a total of 32 spectra in the lower redshift grouping and and 25 in the higher redshift system out of the total 110 redshifts plotted (including both low and high resolution spectra). The remaining 34 redshifts available in this field are at redshifts outside the region displayed in the inset.
The difference in redshift between these two systems is , which is significant. This is a velocity difference of 5200 km s-1 in the frame of the two systems. Such a large difference implies that they are not two parts of a merging system.
Determining the location on the sky of these two groupings is problematic. We selected galaxies based on imaging data centered to the south of the cluster. No galaxies in our spectroscopic sample lie more than 11 north of the original RDCS centroid. Therefore, when we calculate a centroid of the galaxies with redshifts in each grouping we are biased towards values to the south.
The brightest member of the grouping lies 109 (77 kpc) to the east of the peak in the X-ray emission in Figure 1. At the peak is a slightly fainter galaxy that has an extended envelope, typical of the bright, early-type galaxies at the cores of clusters. We deem it likely that the center of the grouping lies near one of these two galaxies. There is an equivalent bright, early-type galaxy at at the center of a fainter X-ray peak to the southeast in Figure 1. This galaxy is likely at or near the center of the lower redshift system.
3.2 Chandra Results
In Figure 1, we plot the X-ray contours over the HST optical image. In addition to the main peak in the X-ray emission, near a bright galaxy to the southeast is a second peak in X-ray emission. This peak is much fainter than the first peak, however it is near a galaxy at a redshift of , while the galaxies at the peak of the main X-ray emission are all at .
We extracted all events in an aperture of 100″ around the main peak in the X-ray emission. Using the extracted events, we measured the centroid of the X-ray emission and found that to be = 08h 48m 4783 and = 44° 56′ 135 (J2000), close to the centroid from the RDCS survey. This centroid is south of the main peak in the X-ray emission, at 08h 48m 4791 and = 44° 56′ 187 (J2000). This shift in the centroid from the main peak could be a result of flux from the peak to the south-east.
Before we determined properties from the X-ray spectra, we needed an estimate of the background spectrum. We extracted from the merged event list a nearby background region, which we cleaned of all point sources. We fit a combination of a broken power law model with a Gaussian to represent the 2.1 keV Au emission line. This is the same model used in Stanford et al. (2000), which examined two other clusters in the same Chandra pointing. We fit the model to the data using the modified version of the statistic in Cash (1979) recommended by Castor in the XSPEC manual (Arnaud, 1996). This statistic does not require binning the data as it assumes the errors are distributed in a Poisson manner, instead of as a Gaussian as expected by a distribution. The actual fit was performed over the energy range 0.5–6.0 keV and the best fitting parameters agree well with those found in Stanford et al. (2000).
To estimate temperatures for the two different groups, we used two 30″ radius apertures. One was centered on the northern X-ray peak while the other was centered on the secondary peak to the southeast. The apertures are plotted in Figure 1. We excluded the region of the southern aperture that would have overlapped with the northern aperture. We fit each aperture separately with the model of Raymond & Smith (1977), using the background model described above after it was rescaled for the smaller area in the two apertures. For galactic absorption, we used a value of cm-2 from Dickey & Lockman (1990). We fit our objects using the same energy range and statistic we used for fitting the background region.
When fitting the spectra, we allowed the abundance and the redshift to be free parameters in addition to the normalization and the temperature. The northern aperture has a temperature of keV, an abundance of , and a redshift of . We found for the southern aperture a temperature of keV, an abundance of and a redshift . For the northern aperture, the best fitting redshift was quite close to the biweight redshift for the higher redshift grouping in §3.1 while 2 away from the lower redshift grouping. The abundances were typical of lower redshift clusters, though with very larger errors on the southern aperture abundance measurement. The flux for the northern aperture is erg s-1 cm-2 (0.5–6.0 keV observed) while the flux for the southern aperture is erg s-1 cm-2 (0.5–6.0 keV observed). For the southern aperture, there are far fewer events compared with the north, so the error estimates are larger. These results are summarized in Table 1 and we plot the best fitting spectra in Figures 3 and 4.
We fit a model, centered on the peak of the X-ray emission, to the events from RX J0848+4456 from 0.5 – 6.0 keV. We excluded an aperture of 20″ centered on the southern peak and smaller apertures around nearby point sources. We then binned the data into 40 circular 25 bins centered on the northern peak (not the centroid of the X-ray emission). Our largest aperture is at 100″ so we could simultaneously fit the model and the background. We found the best fitting model to have and . At a redshift of , the core radius corresponds to kpc. These values of and are typical for clusters of galaxies (Jones & Forman, 1999). We used these values, along with the spectral model above, to compute a bolometric luminosity for the northern aperture. We estimate this to be erg s-1 for a cluster at . The error quoted includes both the errors in the profile fit as well as the errors in fit to the X-ray spectrum. The bolometric luminosity and measured temperature agree with expected luminosity-temperature relation, as shown in Borgani et al. (2001).
The temperatures of the northern and southern apertures differ at the 90% confidence limit. In other words, neither temperature falls within the 90% confidence limit of the other temperature, despite the large errors for the southern aperture. This suggests we could be seeing X-ray emission from the two different groups. Although the two temperatures are not statistically inconsistent at the 3 level, it is tantalizing to have the two temperatures differ at the 90% confidence limit, since this implies we are resolving the X-ray emission from the two different systems nearly along the line of sight.
3.3 Gravitational Arc
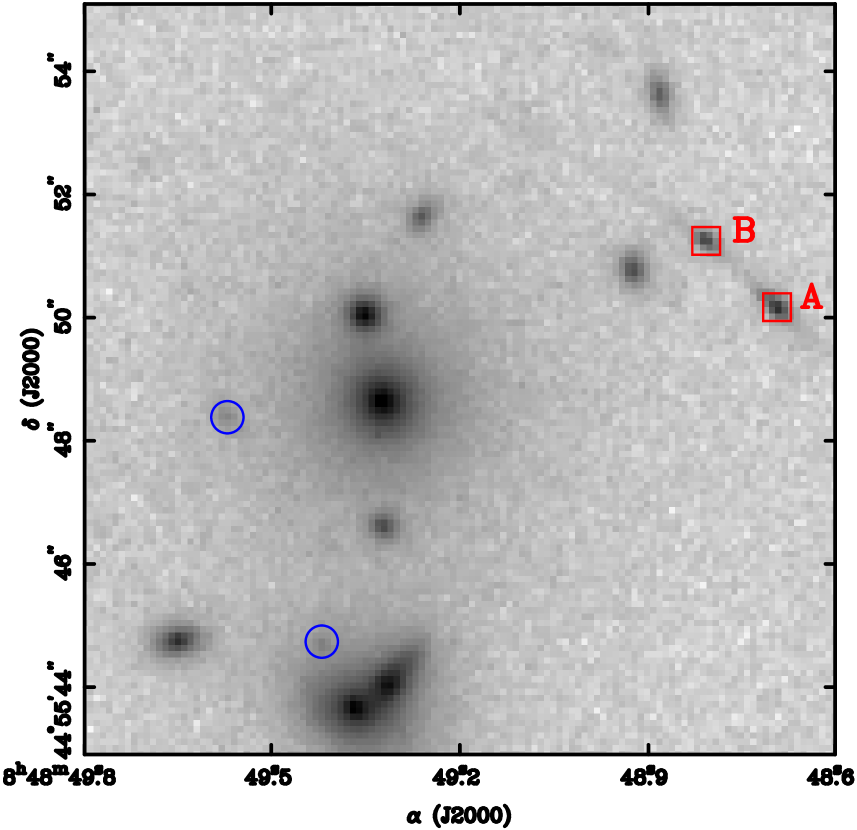
In the HST imaging data, we have found a number of arc candidates. One of these candidates is confirmed with a spectroscopic redshift. We find the arc at = 08h 48m 4876 = 44° 55′ 4861 (J2000) with . In Figure 1, we mark the confirmed arc with a box.
The gravitational arc lies 61 from the elliptical galaxy in the south, near the center of the southern X-ray peak. We show the arc and the elliptical galaxy in Figure 5. Based on the northeast-southwest orientation of this arc, it is probably not being lensed by the X-ray cluster at all, but rather by the elliptical galaxy or a group of galaxies centered on the elliptical (see Figure 5).
Also apparent in Figure 5 is that the arc has two components. The LRIS spectra of the arc components extend from 5340 to 7895Å in the observed frame, and are plotted in Figure 6. Both components show a weak continuum and several strong emission lines: a doublet around 6470Å, a triplet near 6750Å, a weak singlet at 7150Å and another doublet around 7250Å. There are no other convincingly detected lines in the observed wavelength range. By virtue of wavelength matching, these are readily identified, for a redshift of , as N IV] 1483Å, 1486Å; C IV 1548Å, 1550Å; He II 1640Å; and O III] 1661Å, 1666Å. The triple structure of the C IV resonance line then suggests that there is some self absorption present. The lines are all narrow with an observed FWHM = 180 km s-1 which, when corrected for instrumental resolution, implies an intrinsic width of 140 km s-1. With the exception of O III], the lines do, however, show distinct broad bases.
While these emission lines are seen in objects ranging from quasars and radio galaxies to planetary nebulae and symbiotic stars, their relative ratios are, as far as we can discover from searching the relevant literature and data archives, unique. In particular, the O III] doublet is relatively very strong while the N III] triplet at 1751Å is only marginally detected. At this redshift the Lyman line lies just outside the wavelength covered by the spectra but we can confirm that the N V 1238, 1242 resonance doublet is much weaker than N IV]. We confirmed the wavelength of Lyman with a spectrum obtained using the 150 line mm-1 grating as part of the Keck observations for SPICES.
These spectra will be discussed in detail in a later paper, but we can draw some preliminary conclusions about the nature of the source of line emission from a qualitative examination of the spectrum. If the gas is photoionized, the relative weakness of He II and N V suggests that the ionizing spectrum is not as hard as a typical AGN. The absence of S IV and N III, however, suggest a high ionization parameter (U = photon/matter density). The alternative hypothesis of shock excitation, both with and without precursor ionizing photons (Dopita & Sutherland, 1996), appears unable to produce O III] stronger than C IV. We conclude, therefore, that the object being lensed is photoionized by a source which is softer than a typical AGN but hotter than a black body of K, likely between 80,000 and 100,000 K. Establishing the permissible range of element abundances must await detailed analysis of all the spectral data, though the best fitting value is 0.05 with U.
The two components of the arc and the extended morphology imply that the source object lies along a fold caustic, similar to an arc found by Kneib et al. (1993) in Abell 370. We have unsuccessfully searched for possible counter images in the ground based I and K band data. In Figure 5, we mark two possible counter images in the HST image that would be too faint to appear in the ground based data. Using the potential counter image to the East of the elliptical and the assumption of an isothermal sphere, we derive a velocity dispersion of 480 km s-1, quite close to the group velocity dispersion. As this model ignores the ellipticity of the lens, which is necessary to produce the shape of the arc, the velocity dispersion should be an over-estimate.
4 Mass Estimates and Results
We have good evidence that RX J0848+4456 consists of an X-ray emitting cluster of galaxies at , while there is an X-ray faint group or low-mass cluster in front of RX J0848+4456 at . The centroid of all the X-ray emission lies near four galaxies that are part of the grouping at , with the peak in the X-ray emission lying on top of one of the bright, early-type galaxies in the system. In addition, the best fitting redshift for the X-ray spectrum from the northern component, , is close to the redshift of the grouping of galaxies. These two pieces of evidence point to RX J0848+4456 as the system.
The velocity dispersion-temperature relation of Lubin & Bahcall (1993) predicts a velocity dispersion of (the errors are from the scatter in relation, not based on the temperature errors) for a cluster with X-ray gas at kT = 3.6 keV. We find that the temperature of the gas near the centroid agrees well with the measured velocity dispersion, or, in other words, that the dark matter is in equilibrium with the X-ray emitting gas. Using the relation from Borgani et al. (1999), which assumes a singular isothermal sphere, we estimate the mass M☉ ( group) based on the velocity dispersion. If we use the X-ray temperature, we find a mass for the northern aperture of M☉ using the mass-temperature relation of Eke et al. (1996). If we compare these mass estimates with the low redshift mass-luminosity relation for X-ray clusters (Wu et al., 1999; Reiprich & Böhringer, 2000), we find our bolometric luminosity in good agreement with the values expected. This confirms the lack of strong evolution seen in the luminosity-mass relation for other RDCS clusters in Squires & Rosati (1998).
If we apply the same relations to the system, we find results with far less agreement. Using the same relation from Lubin & Bahcall (1993) and the velocity dispersion of the system of galaxies at , we would expect kT = keV for the southern region, which is less than the X-ray temperature measurement by 1.8 standard deviations. If we use the Borgani et al. (1999) relation we find a mass of M☉ while the Eke et al. (1996) mass-temperature relation predicts M☉, more than two standard deviations from the mass estimated from the velocity dispersion. Whichever of the two mass estimates we use, we find a small binding mass for the group. Suffice it to say, we know that this lower mass system is a real group of galaxies and not a projection because of the gravitational lens. Detailed modeling of the gravitational lens should yield a better estimate for the mass of the lower redshift system.
We find it likely that the southern aperture is contaminated from X-ray emission by the northern X-ray cluster, so there would be a systematic error in the temperature estimate that could explain the discrepancies above. One reason why we suspect contamination is the high redshift found for the southern aperture, a redshift closer to the system than to the system. Secondly, if we use the results from the model fit, we compute that we expect 87 events to land within the southern aperture which is almost half of the total number of events.
What is peculiar is that there are a fairly large number of galaxies in the lower redshift group. We measured 17 redshifts (though five are emission line galaxies), more than the 11 in the cluster. Including the 150 line mm grating redshifts further bears this out. We find 32 galaxies in the group and 25 in the cluster. As we do not have a complete sample from the SPICES survey, we can not make any firm statistical statements. However, these numbers are entirely consistent with a roughly equal distribution of galaxies in the two objects. So it appears there are a fair number of galaxies associated with a group that has a small binding mass and little or no X-ray emission. With the completed SPICES data, we will be able to study the luminosity function of these two different systems and thus confirm the apparent high richness of this low luminosity system.
One question that we need to address is what sort of gravitational potential is causing the arc? There are a number of different models that need to be explored to fully characterize this system, which will be done in a later paper. The large separation of the lens and the elliptical, however, makes it unlikely that just the galaxy itself is lensing the source.
5 Summary
RX J0848+4456 appears to be a relatively complicated system, when viewed from our line of sight. We find it most likely that the majority, though not all, of the X-ray emission comes from a cluster of galaxies at , which is RX J0848+4456 proper. The peak of the X-ray emission is close to the brightest cluster member. The best fitting redshift for the X-ray spectrum is , less than one standard deviation from the peak in the galaxy redshift distribution at but more than two standard deviations from the grouping of galaxies.
The cluster has an X-ray temperature of keV and a velocity dispersion of 670 50 . These two values result in a , the ratio of the kinetic energy per unit mass in the galaxies to that in the X-ray gas, very close to one. This means that the dark matter and the X-ray gas are very close to equilibrium, for the central parts of the cluster at least, which implies this cluster is mostly relaxed.
In front of RX J0848+4456, at , there is a group or low mass cluster of galaxies with a velocity dispersion of 430 20 . Though it appears there are a fairly large number of galaxies that are members of this system, it has a much smaller X-ray luminosity than RX J0848+4456. We found, in the aperture centered on the southern peak, an X-ray flux of that in RX J0848+4456, though after correcting for contamination from RX J0848+4456, a flux of only of that in RX J0848+4456 is more likely. This group at contains a gravitational lens, a useful probe of the potential of this slightly lower redshift group.
RX J0848+4456 illustrates why detailed follow up on clusters of galaxies is important. A large aperture, covering both the cluster and the foreground group, produces a lower temperature. For example, an aperture of 50″ centered on the X-ray centroid produces a temperature of kT = keV, almost two standard deviations lower than the temperature we measured above. Without the velocity information showing that there are two groups along the line of sight, we would be more inclined to accept this lower value. Without the high resolution X-ray data, we would not know which of the two groups actually was the source of the original X-ray emission. The combination of optical spectroscopy, which allowed us to resolve the two different systems along the line of sight, and the high spatial and spectral resolution X-ray data, gave us the necessary data to disentangle this cluster.
We plan to continue observing RDCS clusters in this multi-wavelength fashion. This will allow us to not only understand the distribution of masses of clusters of galaxies, but also study the galaxy properties when we combine high resolution HST imaging and Keck spectroscopic data. With mass estimates from a variety of techniques, we will be able to construct a clean sample of clusters of galaxies for comparisons with theoretical expectations.
BH would like to thank Michael Gregg and Patrick Wojdowski for useful discussions. We thank Scott Wolk for assistance with planning our Chandra observation. We thank Montse Villar-Martin for discussions about the arc emission line spectrum. We would also like to thank the referee for helping us make this a better paper. Support for SAS came from NASA/LTSA grant NAG5-8430 and for BH from NASA/Chandra GO0-1082A. Both BH and SAS are supported by the Institute for Geophysics and Planetary Physics (operated under the auspices of the US Department of Energy by the University of California Lawrence Livermore National Laboratory under contract W-7405-Eng-48). Support for GKS in this work was provided by NASA through Hubble Fellowship Grant No. HF-01114.01-98A from the Space Telescope Science Institute, which is operated by the Association of Universities for Research in Astronomy, Incorporated, under NASA Contract NAS5-26555. RAEF is affiliated to the Astrophysics Division of the Space Science Department, European Space Agency. Some of the data presented herein were obtained at the W.M. Keck Observatory, which is operated as a scientific partnership among the California Institute of Technology, the University of California and the National Aeronautics and Space Administration. The Observatory was made possible by the generous financial support of the W.M. Keck Foundation.
References
- Adami et al. (2000) Adami, C., Holden, B. P., Castander, F. J., Nichol, R. C., Mazure, A., Ulmer, M. P., Postman, M., & Lubin, L. M. 2000, AJ, 120, 1
- Arnaud (1996) Arnaud, K. A. 1996, in ASP Conference Series, Vol. 101, Astronomical Data Analysis Software and Systems V, ed. G. Jacoby & J. Barnes, 17
- Beers et al. (1990) Beers, T. C., Flynn, K., & Gebhardt, K. 1990, AJ, 100, 32
- Borgani et al. (1999) Borgani, S., Girardi, M., Carlberg, R. G., Yee, H. K. C., & Ellingson, E. 1999, ApJ, 527, 561
- Borgani et al. (2001) Borgani, S., Rosati, P., Tozzi, P., Stanford, S. A., Eisenhardt, P., Lidman, C., Holden, B., Norman, C., & Squires, G. 2000, ApJ, submitted
- Cash (1979) Cash, W. 1979, ApJ, 228, 939
- Dickey & Lockman (1990) Dickey, J. M. & Lockman, F. J. 1990, ARA&A, 28, 215
- Dopita & Sutherland (1996) Dopita, M. A. & Sutherland, R. S. 1996, ApJS, 102, 161
- Eisenhardt et al. (2001) Eisenhardt, P., Elston, R., Dickinson, M., Stanford, S. A., & Stern, D. 2001, ApJS, in prep
- Eke et al. (1996) Eke, V. R., Cole, S., & Frenk, C. S. 1996, MNRAS, 282, 263
- Fruchter & Hook (1998) Fruchter, A. & Hook, R. N. 1998, PASP, submitted, (astroph/9808087)
- Jones & Forman (1999) Jones, C. & Forman, W. 1999, ApJ, 511, 65
- Katgert et al. (1996) Katgert, P., Mazure, A., Perea, J., Den Hartog, R., Moles, M., Le Fevre, O., Dubath, P., Focardi, P., Rhee, G., Jones, B., Escalera, E., Biviano, A., Gerbal, D., & Giuricin, G. 1996, A&A, 310, 8
- Kneib et al. (1993) Kneib, J., Mellier, Y., Fort, B., & Mathez, G. 1993, A&A, 273, 367
- Kurtz & Mink (1998) Kurtz, M. & Mink, D. 1998, PASP, 110, 934
- Lubin & Bahcall (1993) Lubin, L. & Bahcall, N. 1993, ApJ, 415, L17
- Oke et al. (1995) Oke, J. B., Cohen, J. G., Carr, M., Cromer, J., Dingizian, A., Harris, F. H., Labrecque, S., Lucinio, R., Schaal, W., Epps, H., & Miller, J. 1995, PASP, 107, 375
- Raymond & Smith (1977) Raymond, J. C. & Smith, B. W. 1977, ApJS, 35, 419
- Reiprich & Böhringer (2000) Reiprich, T. H. & Böhringer, H. 2000, in Mining the Sky, Springer-Verlag
- Rosati et al. (1998) Rosati, P., Della Ceca, R., Norman, C., & Giacconi, R. 1998, ApJ, 492, L21
- Squires & Rosati (1998) Squires, G. K. & Rosati, P. 1998, in Abstracts of the 19th Texas Symposium on Relativistic Astrophysics and Cosmology, ed. J. Paul, T. Montmerle, & E. Aubourg (CEA Saclay), E294
- Stanford et al. (2000) Stanford, S. A., Holden, B., Rosati, P., Tozzi, P., Borgani, S., Eisenhardt, P. R., & Spinrad, H. 2001, ApJ, 522, 504
- Vassiliadis et al. (1996) Vassiliadis, E., Dopita, M. A., Bohlin, R. C., Harringtion, J. P., Ford, H. C., Meatheringham, S. J., Wood, P. R., Stecher, T. P., & Maran, S. P. 1996, ApJS, 105, 375
- Vernet et al. (2001) Vernet, J., Fosbury, R. A. E., Villar-Martin, M., Cohen, M. H., Cimatti, A., di Serego Alighieri, S., & Goodrich, R. W. 2001, A&A, 366, 7
- Wu et al. (1999) Wu, X., Xue, Y., & Fang, L. 1999, ApJ, 524, 22


| Aper. | Net Counts | kT | Abund. | z | ||
|---|---|---|---|---|---|---|
| (J2000) | (J2000) | (0.5-6.0 keV) | (keV) | |||
| North | 08h 48m 4804 | +44° 56′ 2042 | 851.6 | |||
| South | 08h 48m 4925 | +44° 55′ 4846 | 185.1 |