UBVI and H Photometry of the & Persei cluster
Abstract
and H photometry is presented for 17319 stars in vicinity of the young double cluster & Persei. Our photometry extends over a 37′ 1° field centered on the association. We construct reddening contours within the imaged field. We find that the two clusters share a common distance modulus of 11.750.05 and ages of log age(yr) = 7.10.1. From the H colour, a measure of the H emission strength, we conduct a survey for emission line objects within the association. We detect a sample of 33 Be stars, 8 of which are new detections. We present a scenario of evolutionary enhancement of the Be phenomenon to account for the peak in Be fraction towards the top of the main-sequence in the population of & Persei and similar young clusters.
1 Introduction
The double cluster & Persei is one of the richest young galactic open clusters. The two clusters, (NGC 869) and (NGC 884) Persei form the nuclei of the broader Per OB1 association (Morgan 1953). The region has been the focus of numerous studies. An extensive photographic study was presented by Oosterhoff oos37 (1937); further photographic studies were made by Moffat & Vogt mof74 (1974). Photometric studies were made by Johnson & Morgan joh55 (1955), Wildey wid64 (1964), Schild sch65 (1965) in Johnson and by Crawford et al. cra70 (1970), Waelkens et al. wae90 (1990), Fabregat et al. fab96 (1996) and Marco & Bernabeu mar01 (2001) in Strömgren . Infra-red photometry is presented by Tapia et al. tap84 (1984). A sample of proper motions is given in the central regions of & Per. by Muminov mum83 (1983).
Given their relative richness and young age, these clusters form a useful comparison with stellar evolutionary models for massive stars. With MS populations up to 15M⊙ the clusters are analogous to the young populous clusters of the Magellanic Clouds. Within the literature, however, there is no convergence on the fundamental parameters of the clusters, such as their distances and ages. Marco & Bernabeu mar01 (2001) present distance moduli (dm) of 11.660.20 and 11.560.20 for & Per. respectively. This is consistent with a common distance to the two clusters such as derived by Crawford et al. cra70 (1970): dm=11.40.4 and Balona & Shobbrook bal84 (1984): dm=11.16. Tapia et al. tap84 (1984) and Schild sch65 (1965) both find moduli of 11.7 and 12.0 for & Per. respectively.
The age structure of the association has been discussed by Wildey wid64 (1964) and Schild sch67 (1967). Wildey concludes that a significant age spread is present within the larger Per OB1 association with three notable epochs. Schild elaborates upon this, finding to be older than Per. and discerns a third spatially diffuse population of yet younger age in the surrounding field. The present work revisits these issues in the light of our CCD-based photometry and the results of modern stellar evolutionary models.
Previous CCD based studies have remained limited to the central-most regions of the clusters. It is our goal in the present work to provide CCD based photometry over an area broad enough to encompass the extent of the clusters. With this photometric basis we determine the fundamental parameters of the clusters: distance modulus, reddening (Section 4) and age (Section 6).
The presence of a large population of Be stars within the clusters has been noted by many authors (see e.g. Slettebak 1985 and Maeder et al. 1999). A Be star is a B-type star which has at some stage shown emission in H Balmer lines. This emission is understood to arise from a expelled circumstellar disk of material in the equatorial plane of the star. The mechanism for expulsion of this material is a topic of debate but is likely related to the generally rapid photospheric rotational velocity of the underlying star.
The means of Be star detection in these previous works has been through grism or long-slit spectroscopy. Such techniques, which have largely focused on the nuclei of the two clusters, do not provide a sample with uniform completeness, especially for V10. Our study uses the H colour index as a measure of the H emission strength to distinguish the Be star population in a uniform manner throughout the observed field. The fraction of Be stars to total B stars within these clusters is a useful comparison with the Be star fractions observed within Magellanic Cloud clusters of similar ages (Keller et al. 2000). A recurring feature of the Be star population within young clusters is the peak in Be fraction towards the terminus of the main sequence. In Section 5 we discuss this feature and its implications for evolutionary modification of the Be phenomenon.
2 Observations and Data Reduction
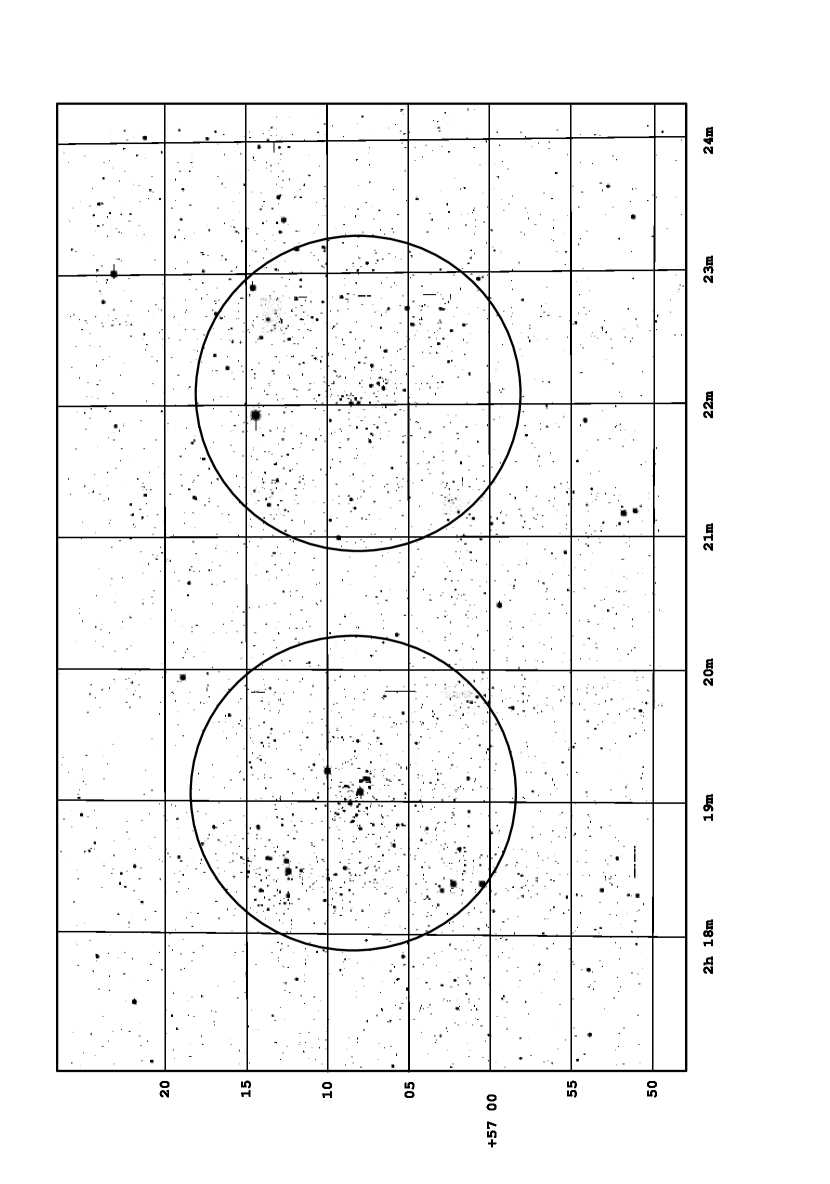
and H photometry was performed on five nights between 17th and 25th of August 1999 at the San Diego State University Mount Laguna Observatory with the 1m telescope and a Loral 2048 2048 CCD. The scale was 0.399 pixel-1, yielding a field of view of 13.62. Fifteen frame centers were taken to image the total field. The mosaiced 37′ 1° field of our observations is shown in Figure 1.
The central wavelength and bandwidth of the H filter were 6560 and 55Å respectively. Two sets of exposure times were used - long: 360 s in H, 300 s and 60 s in and - and short: 40 s in and , 20 s in , 10 s in . The mean seeing for the observations was 1.″8. The observations were made in photometric conditions.
Preprocessing, such as overscan correction, bias subtraction and flat-fielding, was done using the IRAF CCDRED package. Instrumental magnitudes were obtained using DAOPHOT II via point-spread function fitting. The primary extinction coefficients and zeropoints were determined every night from observations of Landolt standard regions (Mark A, PG 1657+078, PG 2213-006, PG 1633+099: Landolt 1992). For the secondary extinction and transformation coefficients we used the mean of five independent determinations (errors represent the weighted mean errors). All the instrumental magnitudes were transformed to the standard system using the following transformations:
| (1) |
| (2) |
| (3) |
| (4) |
where, following standard notation, , and represent the primary extinction coefficient, air mass and zeropoint respectively and the lowercase symbols denote the instrumental magnitudes. Table 1 lists the extinction coefficients and zeropoints. In the case of the H photometry only the effects of atmospheric extinction were accounted for. Table 2 presents our photometry.
The magnitudes and colours from this study are compared with the previous photometry of Wildey wid64 (1964), Moffat & Vogt mof74 (1974), Johnson & Morgan joh55 (1955), Krzesinski et al. krz99 (1999): NGC 864 nucleus) and Krzesinski et al. krz97 (1997): NGC 884 nucleus) in Table 3. The number of stars used in the comparison is given in the fourth column by . Known variables were excluded in the statistics. The photographic photometry shows the largest scatter. The photometry of Wildey suffers greatly from the effects of crowding, this results in the large dispersion and generally brighter V magnitudes described in Table 3.
3 Photometric Diagrams
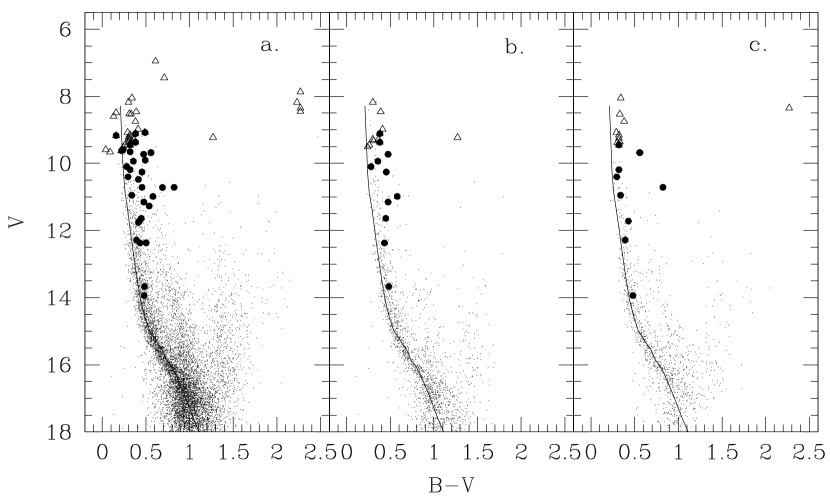
In Figure 2 we present the , colour-colour (C-C) diagram from our photometry. In Fig. 2 a. we show the entire field. In panels b and c we show the C-C diagrams for and Per. contained within the 10′ radius. The choice of this radius for both clusters is made from a examination of the radial object density around each cluster. At a radius of 10′ the surface density diminishes to that of the background field.
The reddened zero-age main sequence (ZAMS) is also shown in Fig. 2 using the adopted distance moduli and mean reddenings detailed in Sect. 4. The adopted ZAMS relation is from Balona and Shobbrook bal84 (1984). The dispersion seen about the mean MS locus (solid line) in Fig. 2 a. shows that there is significant differential reddening across the field.
Figures 3-5 show the , and colour-magnitude (C-M) diagrams for the entire field, and Per. respectively. Our photometry is saturated in and at 9.5. For stars brighter that we have relied on previous photometry (Johnson & Morgan 1955; Hiltner 1956; Wildey 1964; Tapia et al. 1984). Points for which we have utilized one or more magnitudes from the literature are represented by triangular symbols in Figs. 2-5. Evolutionary departure from the ZAMS is seen in Figs. 4 and 3.
4 Reddening and Distance Moduli
We adopt the nominal values for colour-excess ratio and the ratio of total to selective extinction, (), of 3.2 (see e.g. Schmidt-Kaler 1982). Using those early MS, non-emission line stars ( and in Figure 2) we derived using the Q technique ( Q; see e.g. Bessell 1991 ): E(, where ()obs is the observed colour.
In order to describe the spatially variable reddening our sample was divided into a grid of regions such that each region contained at least 10 stars for which we have determined . The resulting spatial distribution of is shown in Figure 6. The region possesses a clear negative reddening gradient from SW to NE which is consistent with increasing galactic latitude. The nuclei of both clusters have average reddenings of from 96 and 85 stars within & Per. respectively. This is in agreement with the determination of Balona & Shobbrook bal84 (1984) from the photometry of Crawford et al. cra70 (1970) of a mean reddening of . Each star is then de-reddened on the basis of its position within Figure 6.
Once de-reddened, the ZAMS of Balona and Shobbrook bal84 (1984) was used to determine the distance modulus of each star. The bulk of the MS A & F stars (-15) are well matched by the ZAMS. Significant evolutionary departures occur for the early B stars, these were excluded from our calculation. The distribution of distance moduli within the two clusters shows a broad peak centered at . There is no significant difference in distance modulus of the two clusters. This result uses the bulk of the essentially unevolved MS. It is significantly more distant than the distance moduli derived by Balona & Shobbrook bal84 (1984) of = which is derived from a limited sample of upper MS stars rectified to a similar sample of stars in the Pleiades. It is within the range of uncertainties of the Marco & Bernabeu mar01 (2001) result of dm=11.660.20 and 11.560.20 for & Persei respectively.
5 The Be Star Population
For the purposes of selecting the population of emission-line objects we construct a ,H C-M diagram (Fig. 7). We construct such a diagram in preference to the , H C-C diagram of previous studies (see Grebel et al. 1992 and Grebel 1997). We find a total of 33 emission-line objects within the surveyed field as described in Table 4. The total from previous studies within this area is 25. Two known Be stars, Oo 566 and Oo 2262 were not found to exhibit significant emission on the epoch of our observations. We do not detect any faint emission-line objects which can be clearly associated with a pre-MS population.
6 Hertzsprung-Russell Diagram
6.1 Transformation to the H-R Diagram
In order to form the H-R diagram for the cluster populations we have made use of the model atmosphere broad-band colours, bolometric corrections and temperatures of Bessell, Castelli & Plez bes98 (1998). For stars of high effective temperature the colours fail to provide good temperature indicators (Massey et al. 1995) and consequently we have used spectral types for temperature determination where possible for stars earlier than B2. These spectral types are drawn from Johnson & Morgan joh55 (1955), Schild (1965; 1967) and Slettebak sle68 (1968). In doing so we have used the spectral type - effective temperature conversion of Böhm-Vitense boh81 (1981). For later-type stars ()-Teff and ()-Teff relations were used with weights reflective of the temperature dependence to the colour of the star in question. Using the above relations the H-R diagram for & Persei is constructed as shown in Figure 8.
6.2 Cluster Ages
In Figure 8 we have removed those stars which are highly likely to be non-members according to the proper motion study of Mumimov mum83 (1983): with probability of membership less than 20%). Be stars were also excluded due to their anomalous colours produced by the presence of circumstellar material. This clarification is particularly useful in the vicinity of the MS turnoff. In Figure 8 we overlay stellar models by Bressan et al. bre93 (1993) and isochrones derived from them (Bertelli et al. 1994). The ages of the most massive stars lie between the isochrones of log age(yr)=6.8 and 7.2. Together with the evolved members the populations suggest a common age of log age(yr)=7.10.1 for the bulk of the population in both clusters, in line with the studies of Waelkens et al. wae90 (1990) and Denoyelle et al. den90 (1990). This is in disagreement with the findings of Marco & Bernabeu mar01 (2001) who, from an examination of the average MS locus of both clusters, find that Persei with a log age of 7.3 is older than Persei (with a log age of 7.0). Marco & Bernabeu go further to propose three epochs of star formation within & Persei at log ages 7.0, 7.15 and 7.3. We propose that the analysis of Marco & Bernabeu mar01 (2001) is largely an over-interpretation of the available data. Our expanded dataset does not show any evidence for an age difference between the two clusters or multiple epochs of star formation.
It would be useful to consider the mass functions of the two clusters together with the age structure of the surrounding field. At present this is not possible. The existing proper motion study of Mumimov mum83 (1983) is limited in magnitude () and spatial extent (only the cluster cores are covered). There is no photometric method for distinguishing the cluster members from members of the surrounding association due to the close affinity in age of the cluster and field populations. Such analysis awaits more detailed proper motion studies.
7 The Be Star Fraction - Evidence for an Evolutionary Enhancement in Be Phenomenon?
In Figure 9 we present the Be fraction amongst MS B stars (to =+0.25 B9V Schmidt-Kaler 1982) within the field of the association. The resulting distribution peaks at a fraction of 36% over the 0.5 mag. interval centered on =7.5 which is in the vicinity of the MS turnoff for the association.
The peak in Be fraction seen at the MS terminus is also seen in several young clusters of the Magellanic Clouds (Keller et al. 2000 and Johnson et al. 2001). Yet studies of the Be fraction within the Galactic and LMC field (see Zorec & Briot 1997 and Keller et al. 1999b respectively) show a more or less uniform proportion of around 15% over the spectral range B0-B5. To account for the observed difference in Be fraction between the cluster and field environment we propose a scenario of evolutionary enhancement in the Be phenomenon. Our scenario utilises the one clear difference between the cluster and field populations, namely the age spread within each population.
We consider a phase of enhancement of the Be phenomenon which occurs over an interval of the MS lifetime towards the end of the MS. The small age spread within the cluster population at the luminosity of the cluster MS terminus places the majority of the stars within the interval of Be enhancement. A peak in the Be fraction results at luminosities near the MS terminus and diminishes at lower luminosities as fewer stars reside within the age range of enhancement. At lower luminosities a population of Be stars remains. These stars are those with sufficient initial angular momentum to commence the Be phase. Within the field population, which possesses a more uniform spread of ages for stars on the MS at a given mass, we see essentially the time-average of the proportion of Be stars. This is lower than that seen in the cluster and more-or-less uniform with luminosity.
The tendency for there to be a higher Be star fraction near the main-sequence turnoff is consistent with the rapid rotation hypothesis for Be star formation. The evolution of rotating stars has been examined by Endal & Sofia end79 (1979) and recently by Heger et al. heg00 (2000) and Meynet & Maeder mey00 (2000). These models explicitly follow the radial exchange of angular momentum with evolution. The quantitative details of the evolution of the equatorial surface velocity () depend critically on mass loss. Taking the example from Meynet & Maeder mey00 (2000), a 20M⊙ star with an initial of 300 kms-1 drops to 120 kms-1 by the MS turnoff. On the other hand a 12M⊙ star drops from 300 kms-1 to 200 kms-1 due to a substantially smaller mass lose rate. The evolution of , the surface angular velocity as a fraction of the critical angular velocity (i.e. the velocity at which the equatorial escape velocity drops to zero), is dependent on the treatment of redistribution of angular momentum within the stellar interior and of the effects of rotationally induced mixing. Heger et al. and Meynet & Maeder implement different treatments of the above but the qualitative conclusions are concordant: for stars less than 15M⊙, increases towards the end of the MS lifetime.
Meynet & Maeder examine the case of a 20M⊙ star with a range of initial velocities. They find that the decrease in the surface is larger for larger initial velocities. This is due to the high stellar mass loss rates for rapid rotators. At lower masses we expect this behavior to be modified by lower mass loss rates. The models of Endal and Sofia examine the rotational velocity evolution of a 5M⊙ star. They find that stars commencing their main-sequence lives with relatively slow angular velocity remain slow rotators throughout the whole of the main-sequence evolutionary phase (although there is a marked increase in angular velocity of all stars during the core contraction phase associated with exhaustion of hydrogen in the core, this evolutionary phase is far too short to account for the observed proportion of Be stars as was proposed by Schmidt-Kaler sk65 (1965) and recently by Bessell & Wood bes93 (1993). Thus slow rotators will never evolve into Be stars.
In contrast to the slow rotators, the models of Endal and Sofia show that stars commencing their lives with an angular velocity greater than 56-76% of the critical breakup velocity spin up to the critical velocity over a moderate fraction of the main-sequence lifetime. In a cluster where some fraction of the stars is formed with angular velocity greater than 50% of , those stars nearer the main-sequence turnoff are more likely to be Be stars since they will have been more spun up by evolution than the less luminous stars that have not evolved as far through the main-sequence phase. This process could provide the mechanism of Be enhancement required to explain the concentration of Be stars to the main-sequence tip.
Numerous studies have indicated the importance of rotation within massive stars (e.g. Langer & Heger 2000 and Meynet & Maeder 2000). Rotationally induced mixing has been shown to be able to produce significant evolutionary and surface abundance changes. Observational evidence for the importance of rotation is growing, within & Persei in particular, the study of Vrancken et al. vra00 (2000) provides a detailed chemical analysis of eight B1 - B2 stars within the vicinity of the MS turnoff. They find, from the deduced HR diagram, a degree of extension to the end of the MS which is in agreement with evolutionary models which incorporate rotation.
8 Summary
We have obtained and H photometry over a 37′ 1° field around the double cluster & Persei. We have formed a spatial description of the reddening throughout the field. We have found that the clusters share a common distance modulus of 11.750.05 and possess ages of log age(yr)=7.10.1. Our study comprises a uniform survey for Be stars within the region. Using the H colour as a measure of the strength of H emission we have identified 33 Be stars, 8 of which were previously unknown. The fraction of Be stars to total B stars shows a maximum at the end of the MS. Similar behaviour is seen in the Be population of young clusters in the Magellanic Clouds. This feature suggests a evolutionary enhancement in the Be phenomenon towards the end of the MS lifetime which we suggest is a consequence of rotational spin-up over the MS lifetime.
References
- (1) Balona, L. A. & Shobbrook, R. R. 1984, MNRAS, 211, 375
- (2) Bertelli G., Bressan A., Chiosi C., Fagotto F., Nasi E., 1994, A&AS, 106, 275
- (3) Bessell, M. S., 1991, A&A, 242, L17
- (4) Bessell, M. S. & Wood, P. R. 1993, in New Aspects of Magellanic Cloud Research, 271
- (5) Bessell, M. S., Castelli, F. & Plez, B. 1998, A&A, 333, 231
- (6) Böhm-Vitense, E. 1981, ARA&A, 18, 241
- (7) Bressan A., Fagotto F., Bertelli G., Chiosi, C. 1993, A&AS, 100, 647
- (8) Crawford, D. L., Glaspey, J. W. & Perry, C. L. 1970, AJ, 75, 822
- (9) Denoyelle, J. et al. 1990, Ap&SS, 169, 109
- (10) Endal, A. S. & Sofia, S. 1979, ApJ, 232, 531
- (11) Fabregat, J., Torrejon, J. M., Reig, P., Bernabeu, G., Busquets, J., Marco, A., & Reglero, V. 1996, A&AS, 119, 271
- (12) Grebel, E. K., Richter, T., & de Boer, K. S. 1992, A&A, 254, L5
- (13) Grebel, E. K. 1997, A&A, 317, 448
- (14) Heger, A., Langer, N. & Woosley, S. E. 2000, ApJ, 528, 368
- (15) Hiltner, W. A. 1956, ApJS, 2, 389
- (16) Johnson H. L., Morgan W. W. 1955, ApJ, 122, 429
- (17) Johnson R. A., Beaulieu, S. F., Gilmore, G. F., Hurley J., Santiago B. X., Tanvir N. R., Elson, R. A. W. 2001, astro-ph/0012389
- (18) Keller, S. C., Wood, P. R. & Bessell, M. S. 1999, A&AS, 134, 489
- (19) Keller, S. C., Bessell, M. S., & Da Costa, G. S. 1999 in IAU Coll. 175, ed. M. Smith, H. Henrichs & J. Fabregat (San Francisco: ASP), 141
- (20) Keller, S. C., Bessell, M. S., & Da Costa, G. S. 2000, AJ, 119, 1748
- (21) Krzesinski, J. & Pigulski, A. 1997, A&A, 325, 987
- (22) Krzesinski, J. & Pigulski, A. & Kolaczkowski, Z. 1999, A&A, 345, 505
- (23) Landolt, A. U. 1992, AJ, 104, 340
- (24) Maeder, A., Grebel, E. K. & Mermilliod, J-C. 1999, A&A, 346, 459
- (25) Marco, A. & Bernabeu, G. 2001, A&A, accepted astro-ph/0102267
- (26) Massey, P., Lang, C., DeGioia-Eastwood, K. & Garmany, C. 1995, ApJ, 438, 188
- (27) Meynet, G. & Maeder, A. 2000, A&A, 361, 101
- (28) Moffat, A. F. J. & Vogt, N. 1974, Veroeff. Astron. Inst. Bochum 2
- (29) Morgan W. W. 1953, ApJ, 118, 318
- (30) Muminov M. 1983 Bull. Inform. CDS, 24, 95
- (31) Oosterhoff, P. T. 1937, Ann. van de Sterrewacht to Leiden, 17, 1
- (32) Schild, R. E. 1965, ApJ, 141, 979
- (33) Schild, R. E. 1967, ApJ, 148, 449
- (34) Schmidt-Kaler, T. 1965, AJ, 70, 691
- (35) Schmidt-Kaler, T. 1982, in Landolt-Börnstein, Vol 2, 23, eds. L.H. Aller et al. (2d ed.; Berlin: Springer-Verlag)
- (36) Slettebak, A. 1968, ApJ, 154, 933
- (37) Slettebak, A. 1985, ApJS, 59, 769
- (38) Tapia M., Roth M., Costero R. & Navarro S. 1984, Rev. Mex. Astron. Astrofis., 9, 65
- (39) Vrancken, M., Lennon, D. J., Dufton, P. L., & Lambert, D. L. 2000, A&A, 358, 639
- (40) Waelkens, C. et al. 1990, A&AS, 83, 11
- (41) Wildey, R. L. 1964, ApJS, 8, 438
- (42) Zorec, J. & Briot, D. 1997, A&A, 318, 443


| Date | ||||
|---|---|---|---|---|
| Aug 17 | ||||
| Aug 18 | ||||
| Aug 19 | ||||
| Aug 21 | ||||
| Aug 23 | ||||
| Date | ||||
| Aug 17 | ||||
| Aug 18 | ||||
| Aug 19 | ||||
| Aug 21 | ||||
| Aug 23 |
| ID | Oost. ID | |||||||
|---|---|---|---|---|---|---|---|---|
| 100 | 2184.388 | 944.050 | 10.380 | -0.314 | 0.464 | 0.412 | -2.822 | 2794 |
| 101 | 2203.848 | -229.542 | 10.475 | … | 0.414 | 0.526 | -1.605 | 2804 |
| 102 | 171.524 | -493.646 | 10.400 | 0.236 | 0.523 | 0.453 | -2.786 | 1242 |
| 103 | 324.182 | -584.171 | 10.443 | -0.411 | 0.261 | 0.144 | -2.823 | 1391 |
| 104 | -56.437 | 38.175 | 10.477 | -0.387 | 0.310 | 0.232 | -2.845 | 936 |
| 105 | 1109.442 | 772.894 | 10.470 | 0.110 | 0.567 | 0.443 | -2.774 | 1932 |
| Author | Method | ||||
|---|---|---|---|---|---|
| Johnson & Morgan joh55 (1955) | photoelectric | 76 | |||
| Wildey wid64 (1964) | photographic | 243 | |||
| Moffat & Vogt mof74 (1974) | photographic | 1437 | |||
| Krzesinski et al. krz97 (1997) | CCD | 202 | |||
| Krzesinski et al. krz99 (1999) | CCD | 68 |
| ID | Oost. ID | |||||||
|---|---|---|---|---|---|---|---|---|
| 28 | 1363.207 | 883.212 | 9.080 | -0.620 | 0.490 | … | -2.304 | 2138 |
| 29 | -120.888 | -264.748 | 9.110 | -0.520 | 0.380 | … | -2.345 | 847 |
| 31 | -644.392 | -864.324 | 9.170 | -0.670 | 0.160 | … | -1.923 | 309 |
| 42 | 201.864 | -11.658 | 9.370 | … | 0.380 | … | -2.466 | 1268 |
| 45 | 1308.504 | -56.666 | 9.450 | -0.550 | 0.320 | … | -2.136 | 2088 |
| 54 | 1301.495 | 599.813 | 9.587 | … | 0.039 | … | -2.381 | 2079 |
| 55 | -881.546 | -869.430 | 9.620 | -0.600 | 0.220 | … | -2.419 | 146 |
| 56 | 784.349 | 611.905 | 9.650 | … | 0.320 | … | -2.170 | 1702 |
| 58 | 1624.853 | 517.354 | 9.678 | … | 0.558 | … | -2.310 | 2402 |
| 60 | 1496.850 | -183.588 | 9.694 | -0.512 | 0.425 | … | -1.744 | 2284 |
| 62 | 193.788 | -227.629 | 9.725 | -0.378 | 0.474 | 0.709 | -1.486 | 1261 |
| 66 | 1100.835 | 591.965 | 9.905 | … | 0.493 | 0.580 | -1.190 | 1926 |
| 68 | -114.916 | 357.033 | 9.934 | … | 0.357 | … | -2.496 | 846 |
| 78 | -386.925 | 110.086 | 10.096 | … | 0.280 | 0.316 | -2.492 | 517 |
| 82 | 1385.516 | 89.806 | 10.189 | -0.563 | 0.319 | … | -2.050 | 2165 |
| 88 | 89.547 | -45.684 | 10.257 | … | 0.454 | 0.538 | -1.943 | 1161 |
| 91 | 1966.636 | -45.877 | 10.399 | … | 0.295 | 0.273 | -2.266 | 2649 |
| 101 | 2203.848 | -229.542 | 10.475 | … | 0.414 | 0.526 | -1.775 | 2804 |
| 126 | 1833.016 | 214.942 | 10.712 | -0.621 | 0.623 | … | -2.038 | 2566 |
| 132 | 1830.679 | -620.322 | 10.714 | … | 0.454 | 0.571 | -0.953 | 2563 |
| 137 | 2128.076 | 640.403 | 10.718 | -0.366 | 0.689 | 0.881 | -1.205 | 2759 |
| 149 | 1463.242 | 51.723 | 10.950 | -0.424 | 0.338 | 0.406 | -1.749 | 2242 |
| 163 | 212.904 | -85.200 | 10.984 | -0.278 | 0.580 | 0.587 | -2.045 | 1282 |
| 191 | 367.814 | -110.785 | 11.152 | -0.237 | 0.475 | 0.458 | -1.716 | … |
| 209 | 2151.376 | 902.980 | 11.268 | -0.291 | 0.538 | 0.606 | -1.657 | 2771 |
| 273 | 214.032 | 174.599 | 11.637 | -0.203 | 0.447 | 0.362 | -1.892 | 1278 |
| 279 | 1316.548 | 142.873 | 11.720 | -0.264 | 0.427 | 0.498 | -1.741 | 2091 |
| 285 | -502.380 | -1023.390 | 11.756 | -0.349 | 0.415 | 0.548 | -0.758 | 420 |
| 381 | 1157.409 | 202.441 | 12.281 | -0.286 | 0.392 | 0.480 | -1.551 | 1977 |
| 409 | 47.680 | -280.088 | 12.370 | 0.138 | 0.433 | 0.464 | -1.226 | 1114 |
| 416 | 1904.465 | 913.611 | 12.368 | -0.268 | 0.502 | 0.494 | -2.504 | 2600 |
| 964 | 18.442 | 11.566 | 13.669 | 0.083 | 0.483 | 0.416 | -2.392 | 1058 |
| 1199 | 1081.700 | 423.908 | 13.938 | 0.066 | 0.480 | 0.449 | -2.344 | 1912 |