High Redshift Quasars and Star Formation History
Abstract
Quasars are among the most luminous objects in the universe, and they can be studied in detail up to the highest known redshift. Assuming that the gas associated with quasars is closely related to the interstellar medium of the host galaxy, quasars can be used as tracer of the star formation history in the early universe. We have observed a small sample of quasars at redshifts and present results using NV/CIV and NV/HeII as well as MgII/FeII to estimate the date of the first major star formation epoch. These line ratios indicate solar and supersolar metallicities of the gas close to the quasars. Assuming times of Gyr the first star formation epoch can be dated to , corresponding to an age of the universe of less than yrs (H km s-1 Mpc-1, =0.3, ).
University of Florida, Department of Astronomy, 211 Bryant Space Science Center, Gainesville, FL 32611-2055, USA
1. Introduction
In the context of cosmic evolution, the epoch of first star formation in the early universe is of fundamental importance. During the last few years, several galaxies (cf., Dey et al. 1998; Weymann et al. 1998; Spinrad et al. 1998; Chen et al. 1999; van Breugel et al. 1999; Hu et al. 1999) and quasars (Fan et al. 1999, 2000a, 2000b; Zheng et al. 2000; Stern et al. 2000) at redshifts of have been detected. Because quasars are among the most luminous objects in the universe, they are valuable probes of conditions at early cosmic times. One particularly important diagnostic is their gas metallicity. If the gas near high redshift quasars is related to the interstellar matter of the young host galaxies, quasars can be used to probe the star formation and chemical enrichment history of those galactic environments. Recent studies of quasars at moderately high redshifts () show solar and enhanced metallicities in the line emitting gas (cf., Hamann & Ferland 1993; Osmer et al. 1994; Ferland et al. 1996; Hamann & Ferland 1999; Dietrich & Wilhelm-Erkens 2000). These results require a rapid and efficient phase of star formation in the early universe, e.g. in the dense galactic or proto-galactic nuclei where quasars reside.
In the following, we present results of an ongoing study of quasars at redshifts . The emission line ratios of NV1240 to CIV1549 and HeII1640 are used as well as MgII2798 vs. FeII UV. The relative strength of these ratios indicates that the first epoch of star formation started at redshifts . In current cosmological models, the age of the universe at those redshifts is less than yrs (Ho=65 km s-1 Mpc-1, =0.3, =0.7; cf., Carroll et al. 1992).
2. Observations
The observations of high redshift quasars were carried out at several observatories during 1993 and 2000. We used telescopes at Calar Alto Observatory/Spain, McDonald Observatory/Texas, USA, La Silla Observatory/ESO,Chile, Paranal Observatory/ESO,Chile, Keck/Hawaii,USA, and CTIO/Chile (Tab. 1).
| quasar | observatory | -range [Å] | date | |
|---|---|---|---|---|
| UM 196 | 2.81 | Calar Alto, 3.5m | 3800-8200 | Aug. 1993 |
| BRI 0019-1522 | 4.52 | CTIO, 4m | 11500-23600 | Sept. 2000 |
| Q 0044-273 | 3.16 | Paranal, 8.2m | 3800-9400 | Jul. 1999 |
| UM 667 | 3.13 | Calar Alto, 3.5m | 3800-8200 | Aug. 1993 |
| Q 0046-282 | 3.83 | Paranal, 8.2m | 3800-9400 | Jul. 1999 |
| Q 0103+0032 | 4.44 | CTIO, 4m | 11500-23600 | Sept. 2000 |
| Q 0103-294 | 3.12 | Paranal, 8.2m | 3800-9400 | Jul. 1999 |
| Q 0103-260 | 3.36 | Paranal, 8.2m | 3800-9400 | Jul. 1999 |
| La Silla, 3.5m | 9500-24800 | Oct. 1999 | ||
| Q 0105-2634 | 3.48 | La Silla, 3.5m | 9500-24800 | Oct. 1999 |
| 4C 29.05 | 2.36 | Calar Alto, 3.5m | 3800-8200 | Aug. 1993 |
| Q 0216+0803 | 2.99 | McDonald, 2.7m | 3800-7800 | Jul. 1995 |
| PSS J0248+1802 | 4.44 | CTIO, 4m | 11500-23600 | Sept. 2000 |
| Q 0256-0000 | 3.37 | La Silla, 3.5m | 9500-24800 | Oct. 1999 |
| Q 0302-0019 | 3.29 | La Silla, 3.5m | 9500-24800 | Oct. 1999 |
| PC 1158+4635 | 4.73 | Keck, 10m | 12700-24700 | May 2000 |
| HS 1425+60 | 3.19 | Calar Alto, 3.5m | 3800-8200 | Aug. 1993 |
| Q 1548+0917 | 2.75 | McDonald, 2.7m | 3800-7800 | Jul. 1995 |
| PC 1640+4711 | 2.77 | McDonald, 2.7m | 3800-7800 | Jul. 1995 |
| HS1700+64 | 2.74 | Calar Alto, 3.5m | 3800-8200 | Aug. 1993 |
| PKS 2126-15 | 3.28 | Calar Alto, 3.5m | 3800-8200 | Aug. 1993 |
| PC 2132+0216 | 3.19 | Calar Alto, 3.5m | 3800-8200 | Aug. 1993 |
| Q 2227-3928 | 3.44 | La Silla, 3.5m | 9500-24800 | Oct. 1999 |
| Q 2231-0015 | 3.02 | Calar Alto, 3.5m | 3800-8200 | Aug. 1993 |
| McDonald, 2.7m | 3800-7800 | Jul. 1995 | ||
| BRI 2237-0607 | 4.57 | CTIO, 4m | 11500-23600 | Sept. 2000 |
| UM 659 | 3.04 | Calar Alto, 3.5m | 3800-8200 | Aug. 1993 |
| Q 2348-4025 | 3.31 | La Silla, 3.5m | 9500-24800 | Oct. 1999 |
The redshift range of was chosen to assure that most of the diagnostic ultraviolet lines are shifted into the optical regime, in particular the NV1240, CIV1549, and HeII1640 emission lines. The quasars which we observed in the near infrared domain (m) were selected for their brightness and for a suitable redshift () that the MgII2798 and the broad FeII emission features in the ultraviolet were shifted to the J- or H-band, respectively.
2.1. The Method
Quasars show a prominent emission line spectrum which provides information on the physical conditions of the gas i.e. temperature, density, ionization state, and the chemical composition. Although the ratios of strong emission lines like Ly1215 to CIV1549 are quite insensitive to the metallicity, other ratios can provide indirect constraints.
The key to using emission line ratios to estimate the metallicity is the different production rates of primary elements like carbon and secondary elements, like nitrogen. N is selectively enhanced by secondary processing at moderate to high metallicities, leading to N increasing as roughly Z2 (cf., Hamann & Ferland 1993; Vila-Costas & Edmunds 1993). Recent model calculations provide evidence for a strong metallicity dependence of emission line ratios involving such elements. Hence, NV1240 vs. CIV1549 and NV1240 vs. HeII1640 are of particular interest for determining the chemical composition of the gas (cf., Hamann & Ferland 1999 for a review).
The different time scales of the enrichment of gas with “-elements” (e.g., O and Mg) and iron are another important aspect using emission line ratios to probe the star formation history. -elements are produced predominantly in massive stars on short time scales. These elements are released from massive-star supernovae (Types II,Ib,Ic). The dominant source of iron is ascribed to intermediate mass stars in binary systems ending in supernova type Ia explosions (cf., Wheeler et al. 1989). The amount of iron returned to the interstellar medium in SN II ejecta is rather low (e.g., Yoshii et al. 1998). The significantly different time scales of the release of -elements and iron to the interstellar medium results in a time delay of the order of Gyr. Detecting strong FeII emission at high redshift can be taken as an indication that the star formation of the stars which had released the iron had occurred Gyr earlier. The viability of the FeII/MgII emission line ratio as an abundance indicator was discussed by Hamann & Ferland (1999).
3. Results
3.1. NV1240 vs. CIV1549 and HeII1640 Line Ratios
The quasars observed in the optical wavelength range were used to determine the NV1240/CIV1549 and NV1240/HeII1640 emission line ratios. To measure the NV1240 line strength we had to deblend the Ly1215, NV1240 emission line complex. We also deblended the CIV1549, HeII1640, OIII]1663 emission line complex to measure HeII1640 (cf., Dietrich & Wilhelm-Erkens 2000 for more details of the deblending). The measured line ratios of NV1240/CIV1549 and NV1240/HeII1640 are compared to theoretical predictions (Fig. 1). Both line ratios are in good agreement with results obtained by Hamann & Ferland (1992, 1993) for quasars at similar redshift. The measured line ratios were used to calculate an average line ratio yielding NV1240/CIV1549 = 0.70.3 and NV1240 /HeII1640 = 5.93.6. The dotted lines in Fig. 1 indicate the line ratios expected for typical conditions of the broad emission line region (BELR) assuming solar metallicities (Hamann & Ferland 1999). The observed line ratios are obviously larger than those for solar metallicities indicating super-solar abundances.
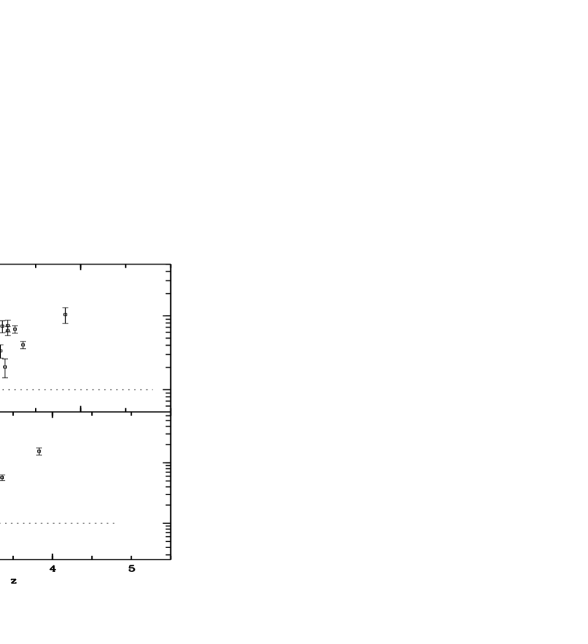
The conversion of observed emission line ratios to relative abundances is affected by several uncertainties. One has to consider only lines, such as NV1240, CIV1549, and HeII1240, that originate in the same region of the BELR under comparable conditions of the gas. A detailed discussion of the current limitations of the method can be found in Baldwin et al. (1996), Ferland et al. (1996), or Hamann & Ferland (1999). Our abundance estimates are based on the model calculations presented by Hamann & Ferland (1992, 1993). They computed abundances for a large range of evolutionary scenarios and input the results into numerical models of the BELR. They varied the slope of the IMF, the evolutionary time scale for the star formation, as well as the low mass cutoff of the IMF. They concluded that the high metallicities observed in high redshift quasars can be achieved only in models with rapid star formation (RSF) and a shallow IMF (slightly favoring massive stars compared to the solar neighborhood), comparable to models of giant elliptical galaxies. It is reassuring that the rapid star formation scenario indicates the same range of metallicities based on both the NV1240/CIV1549 and NV1240/HeII1640 line ratios. We estimated an abundance of Z 84 Z⊙ given by our observed NV/CIV and NV/HeII within the framework of the RSF model (cf., Dietrich & Wilhelm-Erkens 2000).
3.2. MgII2798 vs. FeII UV Line Ratio
The line ratio of -element vs. iron emission can be used as a cosmological clock because the time scales for the release of -elements and iron to the interstellar medium are significantly different. The enrichment delay is of the order of Gyr (cf., Wheeler et al. 1989; Yoshii et al. 1998). The best indicator of -
elements vs. iron in quasars is the strength of MgII2798 emission compared to broad blends of FeII multiplets spanning several hundred Ångstroem (rest-frame) on either side of the MgII line (cf., Wills et al. 1980,1985; Zheng & O’Brien 1990; Boroson & Green 1992; Laor 1995; Vestergaard & Wilkes 2001).
Very few quasars at redshifts larger than were observed for the wavelength region covering MgII2798 to H,[OIII]4959,5007 (Hill et al. 1993; Elston et al. 1994; Kawara et al. 1996; Taniguchi et al. 1997; Yoshii et al. 1998; Murayama et al. 1998). Recently, Thompson et al. (1999) studied a few quasars at average redshifts of and , respectively. They found no significant difference in the strength of the ultraviolet FeII emission relative to MgII2798, which suggests an age of the universe of more than 1 Gyr at .
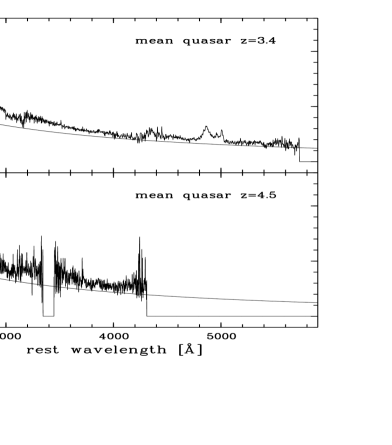
In contrast to earlier studies, our data cover a much wider range of rest frame wavelengths, Å and Å, (Fig. 2). These wide and continuous wavelength range enabled us to investigate the strong ultraviolet FeII emission based on a reliable continuum fit which was hard to achieve in earlier studies with smaller and non-continuous wavelength coverage.
Due to the huge number of individual FeII emission lines () it is not practical to treat them individually. As suggested and demonstrated by Wills, Netzer, & Wills (1985), the reconstruction of a quasar spectrum by several well defined components, i.e. (i) a power law continuum, (ii) a Balmer continuum emission spectrum, (iii) a template for the FeII emission, and (iv) a template spectrum for the broad emission lines, is the best approach to measuring the strength of the FeII emission. We are presently involved in a collaboration (cf., Verner et al. 1999) to use state-of-the-art computer models as well as empirical
FeII,FeIII emission templates (Vestergaard & Wilkes 2001) to quantify the abundance sensitivities of the FeII line emission.
To obtain a first estimate of the iron emission strength in comparison to quasars in the local universe, we compared the restframe quasar spectra in our samples ( and ) to a mean quasar spectrum. The mean quasar spectrum was calculated from a subset of a large quasar sample (700 quasars) which we compiled from ground-based observations and from archive spectra measured with IUE and HST (Dietrich & Hamann 2001). The mean spectrum used for this comparison is based on 101 quasars with i) redshift , and ii) luminosities in the same range as our and quasars.
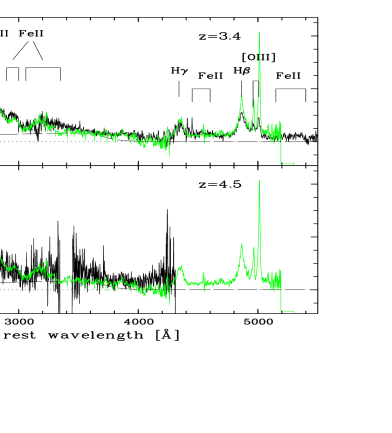
The mean quasar spectra of our samples at and are shown in Fig. 2 together with power law continuum fits. The continuum fits were subtracted and the pure emission line flux was compared. For wavelengths Å much of the emission can be attributed to Balmer continuum emission, but for Å most of the emission is due to broad FeII emission features (Fig. 3). The relative emission strength of the FeII emission of the mean high redshift quasars are nearly identical () compared to the mean quasar (Fig. 3). The mean quasar spectra at and themselves differ by less than % . This can be taken as an indication for no significant evolution in -element vs. iron in quasars from the local universe to .
4. Summary and Discussion
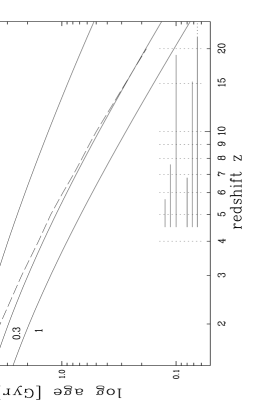
The presented study of quasars at redshifts provides evidence for higher solar abundances of the line emitting gas. This result is based on the emission line ratios of NV1240 vs. CIV1549 and HeI1640. Using assumptions on stellar evolution time scales which are necessary to produce solar or higher metallicities, the beginning of the first star formation epoch can be estimated. In Fig. 4 the age of the Universe is displayed as a function of redshift for several settings of Ho and . With an evolutinary time scale of Gyr () or Gyrs () based on normal chemical evolution models, the beginning of the first violent star formation episode can be dated to a redshift of based on NV1240/CIV1549 and NV1240/HeII1640 (Fig. 4).
Assuming an evolutionary time scale of Gyr for the progenitor stars of type SN Ia, we used the MgII2798/FeII UV emission ratio as a tracer of star formation history. The similar MgII/FeII UV emission ratios in our high redshift quasars compared to local quasars suggests an age of the universe of Gyr at , implying a redshift of () for the epoch of the first substantial star formation. The measured MgII/FeII UV emission ratio probably also suggests at least solar abundances.
We concluded, therefore, that high redshift quasars indicate a redshift of for the first major star formation epoch, corresponding to an age of the universe of yrs (H km s-1 Mpc-1, =0.3, ).
References
Baldwin, J.A., Ferland, G.J., Korista, K.T., et al. 1996, ApJ, 461, 664
Boroson, T.A. & Green, R.F. 1992, ApJS, 80, 109
Carroll, S.M., Press, W.H., & Turner, E.L. 1992, ARA&A, 30, 499
Chen, H.-W., Lanzetta, K.M., & Pascarelle, S. 1999, Nature, 398, 586
Dey, A., Spinrad, H., Stern, D., et al. 1998, ApJ, 498, L93
Dietrich, M. & Wilhelm-Erkens, U. 2000, A&A, 354, 17
Dietrich, M. & Hamann, F. 2001, in prep.
Elston, R., Thompson, K.L., & Hill, G.J. 1994, Nature, 367, 250
Fan X., Strauss, M.A., Schneider, D.P., et al. 1999, AJ, 118, 1
Fan X., Strauss, M.A., Schneider, D.P., et al. 2000a, AJ, 119, 1
Fan X., White, R.L., Davis, M., et al. 2000b, AJ, 120, 1167
Ferland, G.J., Baldwin, J.A., Korista, K.T., et al. 1996, ApJ, 461, 683
Hamann, F. & Ferland, G.J. 1992, ApJ, 381, L53
Hamann, F. & Ferland, G.J. 1993, ApJ, 418, 11
Hamann, F. & Ferland, G.J. 1999, ARA&A, 37, 487
Hill, G.J., Thompson, K.L., & Elston, R. 1993, ApJ, 414, L1
Hu, E.M., McMahon, R.G., & Cowie, L.L. 1999, ApJ, 522, L9
Kawara, K., Murayama, T., Taniguchi, Y., & Arimoto, N., 1996, ApJ, 470, L85
Laor, A., Bahcall, J.N., Jannuzi, B.T., et al. 1995, ApJS, 99, 1
Murayama, T., Taniguchi, Y., Evans, A.S., et al. 1998, AJ, 115, 2237
Osmer, P.S., Porter, A.C., & Green, R.F. 1994, ApJ, 436, 678
Spinrad, H., Stern, D., Bunker, A., et al. 1998, AJ, 116, 2617
Stern, D., Spinrad, H., Eisenhardt, P., et al. 2000, ApJ, 533, L75
Taniguchi, Y., Murayama, T., Kawara, K., & Arimoto, N. 1997, PASJ, 49, 419
Thompson, K.L., Hill, G.J., & Elston, R. 1999, ApJ, 515, 487
van Breugel, W., De Breuck, D., Stanford, S.A., et al. 1999, ApJ, 518, L61
Verner, E.M., Verner, D.A., Korista, K.T., et al. 1999, ApJS, 120, 101
Vestergaard, M. & Wilkes, B.J. 2001, ApJS, in press
Vila-Costas, M.B. & Edmunds, M.G. 1993, MNRAS, 265, 199
Weymann, R.J., Stern, D., Bunker, A., et al. 1998, ApJ, 505, L95
Wheeler, J.C., Sneden, C., & Truran, J.W. 1989, ARA&A, 27, 279
Wills, B.J., Netzer, H., & Wills, D. 1980, ApJ, 242, L1
Wills, B.J., Netzer, H., & Wills, D. 1985, ApJ, 288, 94
Yoshii, Y., Tsujimoto, T., & Kawara, K. 1998, ApJ, 507, L113
Zheng, W. & O’Brien, P.T. 1990, ApJ, 353, 433
Zheng, W., Tsvetanov, Z.I., Schneider, D.P., et al. 2000, AJ, 120, 1607
Acknowledgments.
This work was supported by NASA grant NAG 5-3234 and by the Deutsche Forschungsgemeinschaft, project SFB328 and SFB439.