Hubble Space Telescope Images of Stephan’s Quintet: Star Cluster Formation in a Compact Group Environment11affiliation: Based on observations obtained with the NASA/ESA Hubble Space Telescope, which is operated by the STScI for the Association of Universities for Research in Astronomy, Inc., under NASA contract NAS5–26555. 22affiliation: Based on observations obtained with the Hobby–Eberly Telescope, which is a joint project of the University of Texas at Austin, the Pennsylvania State University, Stanford University, Ludwig–Maximillians–Universität München, and Georg–August–Universität Göttingen.
Abstract
Analysis of Hubble Space Telescope/Wide Field Planetary Camera 2 images of Stephan’s Quintet, Hickson Compact Group 92, yielded candidate star clusters (with ). Unlike in merger remants, the cluster candidates in Stephan’s Quintet are not clustered in the inner regions of the galaxies; they are spread over the debris and surrounding area. Specifically, these sources are located in the long sweeping tail and spiral arms of NGC 7319, in the tidal debris of NGC 7318B/A, and in the intragroup starburst region north of these galaxies. Analysis of the colors of the clusters indicate several distinct epochs of star formation that appear to trace the complex history of dynamical interactions in this compact group.
1 Introduction
The interactions of galaxies trigger bursts of star formation, from the compact star clusters formed around the central regions of mergers (Holtzman et al., 1992; Whitmore et al., 1993; Schweizer et al., 1996; Miller et al., 1997; Whitmore et al., 1999; Zepf et al., 1999) to the dwarf galaxies along and at the ends of their tidal tails (Mirabel, Dottori, & Lutz, 1992; Hunsberger, Charlton, & Zaritsky, 1996). Theoretical considerations motivated the prediction that there would be multiple generations of clusters based upon the sequence of merger events (Ashman & Zepf, 1992; Zepf & Ashman, 1993), and specific conclusions can be drawn about the interaction history of a galaxy pair from detailed studies of its populations of compact star clusters. A compact group of galaxies thus offers the possibility of an even richer laboratory for such studies. In particular, the high densities coupled with low velocity dispersions (–300 km s-1) of compact groups make them active sites of strong galaxy interactions, probably similar to events in the early universe.
Arguably the most famous and well-studied merger is “the Antennae” (NGC 4038/39) which has regions in which very young ( Myr) and young (– Myr) clusters are found. In the same system, there are also intermediate-aged populations with ages of Myr and Myr, the latter apparently related to the same interaction that generated the tails (Whitmore et al., 1999). Finally, there is an old population of clusters presumably formed with the galaxies themselves. In contrast, NGC 3921 and NGC 7252 do not have populations of very young clusters; their intermediate-aged populations are consistent with forming along with their tidal tails (Schweizer et al., 1996; Miller et al., 1997). Some mergers have ongoing star cluster formation continuing well after the major event, but in others the rate of cluster formation appears to have decreased.
The young compact clusters that are detected in mergers range in luminosity from (e.g., Schweizer et al., 1996). Fainter objects are found in deep images of NGC 4038/9, but distinguishing these from individual supergiant stars is difficult (Whitmore et al., 1999). The luminosity function of the young cluster population roughly follows a power law in contrast to that of old globular cluster systems, which is a lognormal luminosity function with a peak at intermediate luminosities (e.g., Harris, 1991).
Young star clusters are also found in the tidal debris of some, but not all mergers. Knierman et al. (2001) found populations of young ( Myr) and intermediate-aged (– Myr) clusters in the debris of NGC 3256. However, they did not find significant numbers of compact clusters in the debris of the three other mergers studied (NGC 7252, NGC 3921, and NGC 4038/39). They hypothesized that star clusters may form in environments where larger condensations, such as tidal dwarf galaxies, are not able to form, but emphasize that larger samples are needed to confirm this hypothesis. The overall star formation efficiency is likely to be influential in determining the compactness and stability of a cluster. High pressure caused by some external trigger may be needed to form a massive globular cluster (e.g., Elmegreen et al., 2000). It is important to collect more empirical data to better understand the initial conditions required for formation of clusters of various sorts.
Hickson compact groups (HCGs) provide a fertile, if complicated, environment in which to study the relationships between interaction and merger events and the ensuing formation of star clusters. The HCGs were selected as groups of galaxies on the basis of compactness and isolation from other bright galaxies (Hickson, 1982). Their high galaxy densities are comparable to those in the centers of galaxy clusters. However, given the median velocity dispersion of km s-1, a larger fraction of interactions will lead to mergers than in the galaxy cluster environment. Enhanced interaction rates are supported by the deficiency of CO in HCG spirals (presumably due to stripping) and by enhanced FIR emission due to nuclear starbursts (Verdes-Montenegro et al., 1998). Extended X-ray halos (Saracco & Ciliegi, 1995; Ponman et al., 1996) also provide evidence for enhanced rates of interactions, as do the number of tidal features presently found in the HCGs (Hunsberger, Charlton, & Zaritsky, 1996). There should be a record preserved in the stellar populations of structures formed in various events.
In Hickson Compact Group 31 (HCG 31), a detailed study of the star formation history has been possible using Hubble Space Telescope (HST) , , , and band images (Johnson et al., 1999) and WIYN H images. Although the major interaction occurred Myr ago, there is evidence for recent (– Myr) star formation throughout the group (Johnson & Conti, 2000). Johnson and Conti (2000) speculate that one of the smaller galaxies may itself have been formed only Myr ago in tidal debris. They also find evidence in other regions of old stellar populations that have presumably been tidally removed from the galaxies. However, there are relatively few star clusters older than Myr, and although clusters fade, it is unlikely that the brightest of them would have faded below the detection threshold of that study.
Our similar study, presented here, focuses on HCG 92, Stephan’s Quintet (hereafter, SQ). This group was discovered more than years ago (Stephan, 1877) and was later included in the HCG catalog (Hickson, 1982). An band image of the group, obtained with the 1.5 m Palomar telescope, is presented in Figure 1, with the galaxies and key areas labeled. NGC 7320 has been shown to be a foreground galaxy at km s-1 and therefore only a chance superposition with the physical group (Mendes de Oliveira & Hickson, 1994). The three galaxies, NGC 7317, NGC 7318A, and NGC 7319 are all within km s-1 of km s-1. However, the galaxy NGC 7318B, at first glance apparently closely associated with NGC 7318A, is in fact blueshifted by km s-1 relative to the others (Mendes de Oliveira & Hickson, 1994). The redshift of the group is which places it at Mpc. At this distance, a pixel on the Wide Field Camera covers pc, and so a compact star cluster is not resolved.
Three of the galaxies in SQ (NGC 7318A, NGC 7318B, and NGC 7319) show signs of morphological irregularities, however, NGC 7317 appears undisturbed. SQ also has the richest known system of tidal dwarf galaxy candidates, with thirteen in the prominent tail to the west of NGC 7319, several in the eastern spiral arm of NGC 7318B, and several in the northern starburst region (Hunsberger, Charlton, & Zaritsky, 1996). Recent star formation is evident in several locations in ground-based (Schombert, Wallin, & Struck-Marcell, 1990), H (Vílchez & Iglesias-Páramo, 1998), and far-IR images (Xu, Sulentic, & Tuffs, 1999).
Moles, Sulentic, & Márquez (1997) construct a history of SQ in which the fainter galaxy to the northeast, NGC 7320C, passed through the group a few hundred million years ago. The interaction with that galaxy stripped NGC 7319 of much of its gas (Shostak, Allen, & Sullivan, 1984), some of which remained as a reservoir for the northern starburst region. This event could also be responsible for the large tidal tail extending to the east from NGC 7319. According to this scenario, bursts of star formation would have occurred during the period of time surrounding this interaction. However, Xu & Tuffs (1999) have used ground-based H and near-IR images as well as Infrared Space Observatory (ISO) mid-IR images to determine that at least some of the star formation in the northern starburst region must have occurred much more recently, perhaps – million years ago. This young burst would have been triggered by the rapid passage of the galaxy NGC 7318B through that region.
This article presents , , and band images of Stephan’s Quintet, obtained with the Wide Field Planetary Camera 2 (WFPC2) aboard HST. The star formation histories in the various regions of this compact group are studied through our analysis of the colors of populations of compact star clusters. The goal is to determine which of the evolutionary events triggered formation of these clusters globally, and/or in local regions throughout the group. In § 2 the observational details are given, the reduction, detection and photometry techniques are outlined, and the images are presented. Color-magnitude and color-color diagrams are presented in § 3, the different star cluster populations are identified in the images, and the ages of these populations are discussed. Long-slit spectra of some prominent star-forming clumps, obtained with the Marcario Low Resolution Spectrograph on the Hobby-Eberly Telescope (HET), are presented in § 4. A summary of conclusions and general discussion comparing the cluster population in Stephan’s Quintet to those in other environments follow in § 5.
2 Observations and Data Analysis
Stephan’s Quintet was observed with the WFPC2 aboard HST in two pointings. Field 1, the first set of images taken on 1998 December 30, encompassed the southern spiral arm of NGC 7319, NGC 7318B/A, and the northern starburst region. The second, Field 2, taken on 1999 June 17, covered NGC 7319 and its extended tidal tail as well as a “sky” region containing no obvious tidal features. The images in the PC overlapped with WFC images, and we consider only the latter in the following analysis as they were more sensitive for point source detection. On both occasions, the images were once dithered and taken through three wide-band filters: F450W (), F569W (), and F814W (). Transformations from these HST filters into the standard Johnson and and Cousins filters can be found in Holtzman et al. (1995). This choice of wide-band filters was motivated by the goal of reducing contamination to the colors from common bright nebular emission lines such as [Oiii] and H. At the observed wavelength of [Oiii] emission from Stephan’s Quintet, Å, the transmissivity of F569W is as opposed to for the usual visible F555W filter. The transmissivity of F450W is whereas the more standard blue F439W filter has essentially no throughput at this wavelength. The close match in transmissivity of F569W and F450W thus serves to reduce the [Oiii] contribution to color. None of our filters has notable sensitivity to H emission, Å.
Dithering entails offsetting the image position by pix in the WF camera in both the and directions to increase the effective resolution of the combined image by better sampling the point spread function (PSF). In this case, we obtained two images at each position in each field and filter. The exposure times in each field were s, s, and s for , and , respectively. The gain in each case was 7 e-/ADU. The data were first processed through the standard HST pipeline. Subsequently, they were cleaned of cosmic rays using the IRAF111IRAF is distributed by the National Optical Astronomy Observatories, which is operated by the Assocation of Universities for Research in Astronomy, Inc. under cooperative agreement with the National Science Foundation. task GCOMBINE, which averaged the two images taken in each position, followed by the task COSMICRAYS to remove hot pixels. Figure 2 shows the cleaned band image of both fields combined with the regions of interest labeled.
2.1 Object Detection and Classification
The initial detection of point sources in each image was undertaken using the DAOFIND routine in DAOPHOT (Stetson, 1987) with a very low detection threshold of for the peak amplitude of the Gaussian. The background over the entire field of SQ varies considerably, and this strategy was chosen following Kundu et al. (1999) to aid in detection of sources in regions with high background. This technique produced thousands of sources per chip, and we then performed aperture photometry using the task PHOT in the package APPHOT on all candidate sources. The aperture radius was 2 pix (), and the background was the median value in an annulus around the aperture with inner radius of 5 pix and width of 3 pix. Those sources with a signal-to-noise ratio above a fixed level, , that appeared in each filter at both dither positions were retained. The noise for each source was calculated from the Poisson noise of the target and the uncertainty in the background, combined in quadrature.
After this step, many spurious sources remain “detected” in particularly noisy regions such as diffraction spikes around bright stars and dust lanes in galaxies. At the distance of SQ, Mpc, 1 WFC pixel corresponds to pc which is larger than the expected effective radius of even large star clusters ( pc, e.g., Whitmore et al. 1999). Therefore, we expect all star clusters to be point sources. To eliminate irregular or extended structures, we followed the example of Miller et al. (1997). We calculated , the difference between the magnitudes from two photometric apertures: one with a radius of 0.5 pix and the other with a radius of 3.0 pix. Those sources with can be classified as extended while those with are probably residual cosmic rays or hot pixels missed in the cleaning process. In either case, such sources are considered unlikely star cluster candidates.
In addition to this test, the radial profile of each source was fit with a cubic spline of order 5 using the APPHOT task RADPROF. From an examination of the distribution of FWHM of these profile fits, point-like candidates have pix. The upper limit is the same as found by Miller et al. (1997) using Gaussian models, but we have extended their lower limit from 1 pix to 0.5 pix based on visual inspection of the candidates.
For the final determination of star cluster candidates, we compiled and the radial profile FWHM of each source in the band images taken at each dither position. To be kept as a candidate, a source had to pass three out of the four (two for each dither position) point-source classification tests. This resulted in a total of 458 star cluster candidates, 276 in Field 1 and 182 in Field 2. Of those objects satisfying the morphological criteria, 189 were found in all three filters. For our final candidate list, only those sources with color errors, and , less than 0.2 mag were retained. The final list contains 139 point sources whose positions are indicated in Figure 2. Of these, 24 have which places them outside of the range of likely star clusters; these sources are probably foreground stars in our Galaxy (Schweizer et al., 1996). Though young star clusters embedded in dust can have colors as red as (e.g., Whitmore et al., 1999), few if any of our sources with appear to be found in the dust lanes, hence this is not likely to be a significant problem.
This sample will clearly contain some foreground stars and background galaxies, but the spatial coincidence of most of the sources with the galaxy bulges, disks, and tidal features suggests that many candidates are legitimate star clusters.
2.2 Completeness Limits
To estimate the completeness of our star cluster candidate sample, Whitmore et al. (1999) was used as a methodological guide. We focused on the region containing NGC 7318B/A where the background level is structured and variable, and possible selection effects could influence our findings. The band images of NGC 7318B/A were populated with artificial point sources using the ADDSTAR task within DAOPHOT. Our detection algorithm was then followed to determine which fraction of the added point sources were recovered as a function of background level. The background level contours of a cropped region of the field and the completeness fraction versus apparent magnitude are shown in Figure 3. The majority of the area of Stephan’s Quintet has background values DN. Even up to background values DN (encompassing most of the area of the galaxy bulges), our sample is complete to an apparent magnitude of 25.1, equivalent to .
2.3 Final Photometry
After the final selection detailed above, we performed circular aperture photometry on all of the detected objects using a 2 pix radius aperture. Though a larger aperture would collect a greater fraction of the total light, a smaller aperture for faint sources preserves a higher signal-to-noise ratio. The sky level is taken to be the median of an annulus with a width of 3 pix and a 5 pix inner radius. For each point source, the photometry was performed independently at each dither position and then averaged. These data were also corrected for charge transfer efficiency losses according to the prescription in Whitmore, Hayer, & Casertano (1999), but due to the long exposures (and therefore high background) these corrections were not significant.
The zeropoints in the Vega magnitude system for these filters have been taken from the HST Data Handbook. These zeropoints (for infinite aperture), have been calibrated to be 0.1 mag less than the zeropoint at . Therefore, the aperture correction from 2 pix to (5.15 pix) must be determined. Following Kundu et al. (1999), aperture photometry for the brightest, isolated point sources in each field and chip was performed with several aperture radii from 0.5 to 6 pix. The number of appropriate bright sources available for each filter ranged from 9 to 19. The difference in magnitude between an aperture with a 2.0 and 5.15 pix radius was the mean of that measured for all the point sources used. There were not enough point sources per WFC to determine the aperture correction independently; in any case, the differences across an individual chip are generally greater than between chips. The mean aperture corrections are (F450W), (F569W), and (F814W) for Field 1, and (F450W), (F569W), and (F814W) for Field 2. The errors are the standard deviations in the mean aperture corrections. Because the two pointings were taken approximately 6 months apart, the aperture corrections for each field are different as a result of differing focus. This change in focus arises from the “breathing” of the telescope; the focus is reset approximately every six months.
From Burstein and Heiles (1984), the foreground Galactic extinction towards SQ is which gives . Using the synthetic photometry package SYNPHOT in IRAF, synthesized Bruzual & Charlot instantaneous-burst star cluster spectra (assuming a Salpeter initial mass function and solar metallicity) were reddened using a Seaton extinction law (Seaton, 1979). These reddened spectra were then convolved with the HST filter response to determine the reddening correction for each filter: , , and . The reddening corrections were consistent within 0.01 mag for star cluster spectra with ages from 1 Myr to 10 Gyr. All of the photometry in this paper has been corrected for Galactic reddening.
3 Results
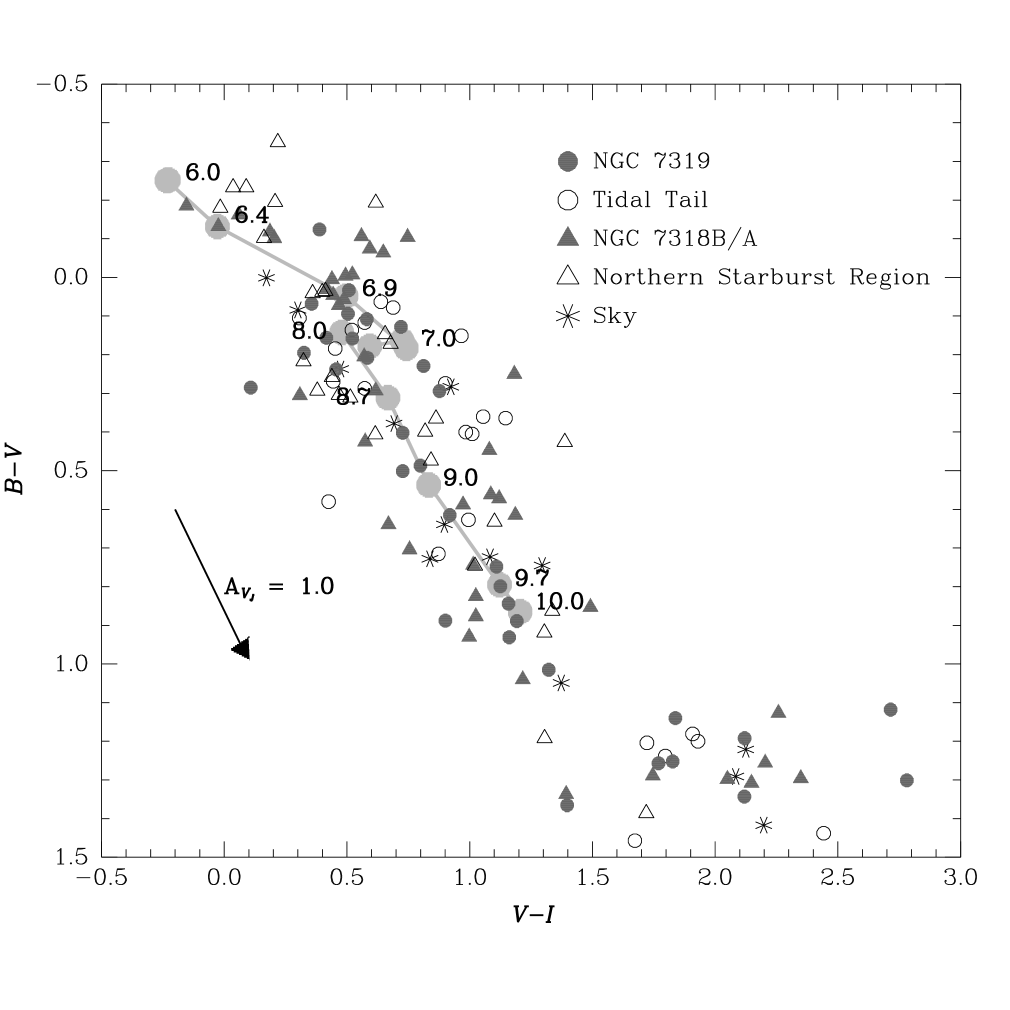
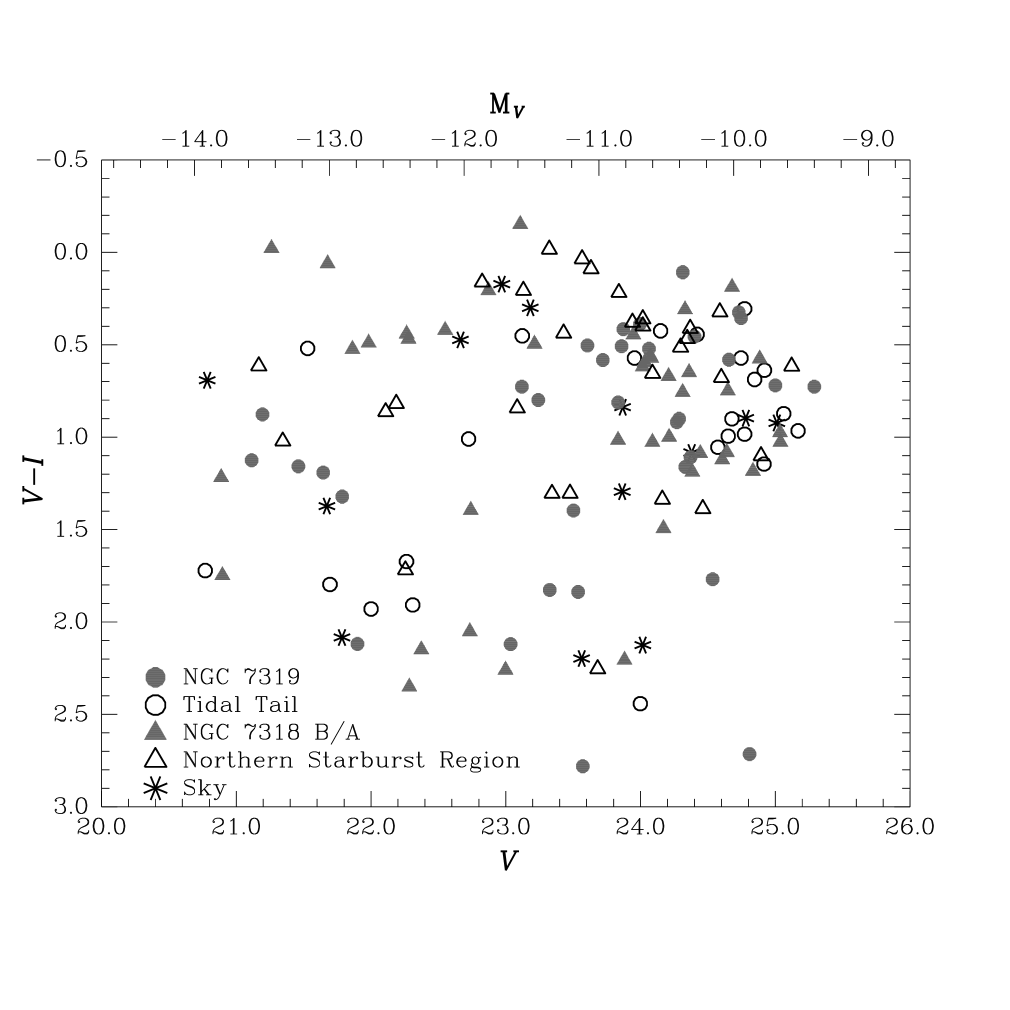
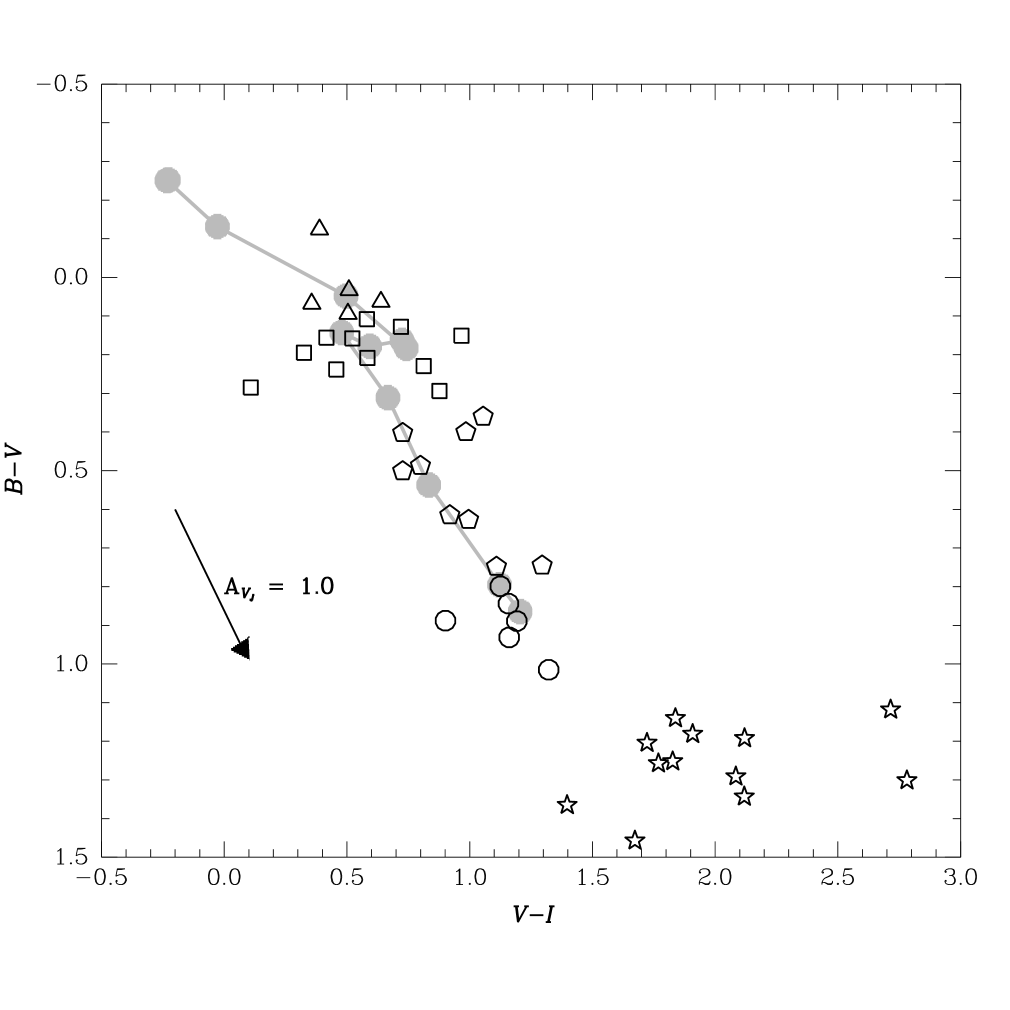
Figures 4 and 5 contain the versus color-color and the versus color-magnitude diagrams of all of the point sources meeting the detection criteria detailed above. In addition to Galactic reddening, internal dust extinction is also likely to affect the colors of these sources. However, this internal reddening is likely to be highly variable considering the diversity of environments in which we find star cluster candidates. For reference, the color-color diagram has a reddening vector included which represents 1.0 mag of extinction in the Johnson filter; we use the Johnson, rather than HST, filter for consistency with previous work. Histograms of the and colors are displayed in Figure 6. Sources redder than are likely to be foreground stars, though we may be misclassifying some dust-enshrouded clusters. Excluding those sources, the luminosity function of the star cluster candidates is given in Figure 7. A maximum likelihood power-law fit to the luminosity function yields to a cutoff magnitude of . The power-law slope is not very sensitive to the exact value of the cutoff between . In any case, because the clusters are unlikely to be a population with a single origin, it is unclear how this model fit should be interpreted. There were not enough objects within different populations to fit them individually.
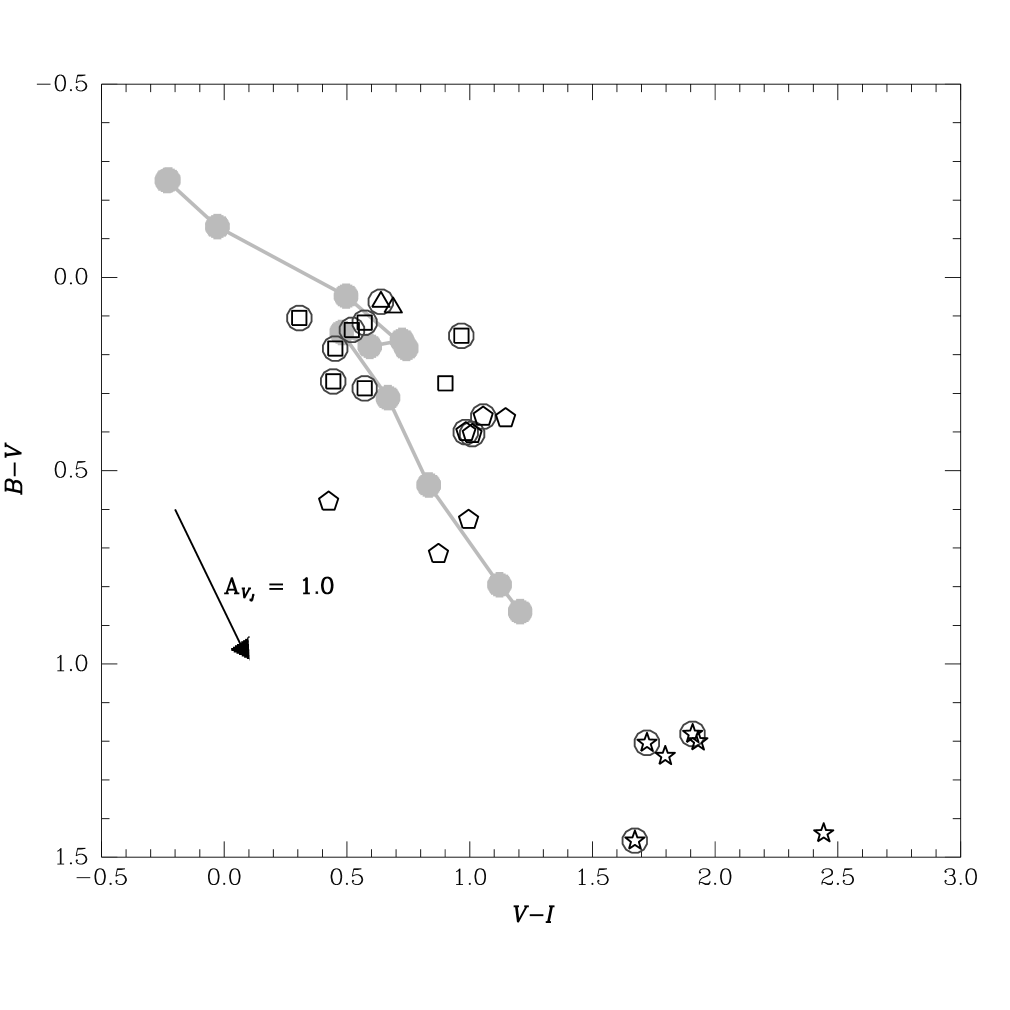
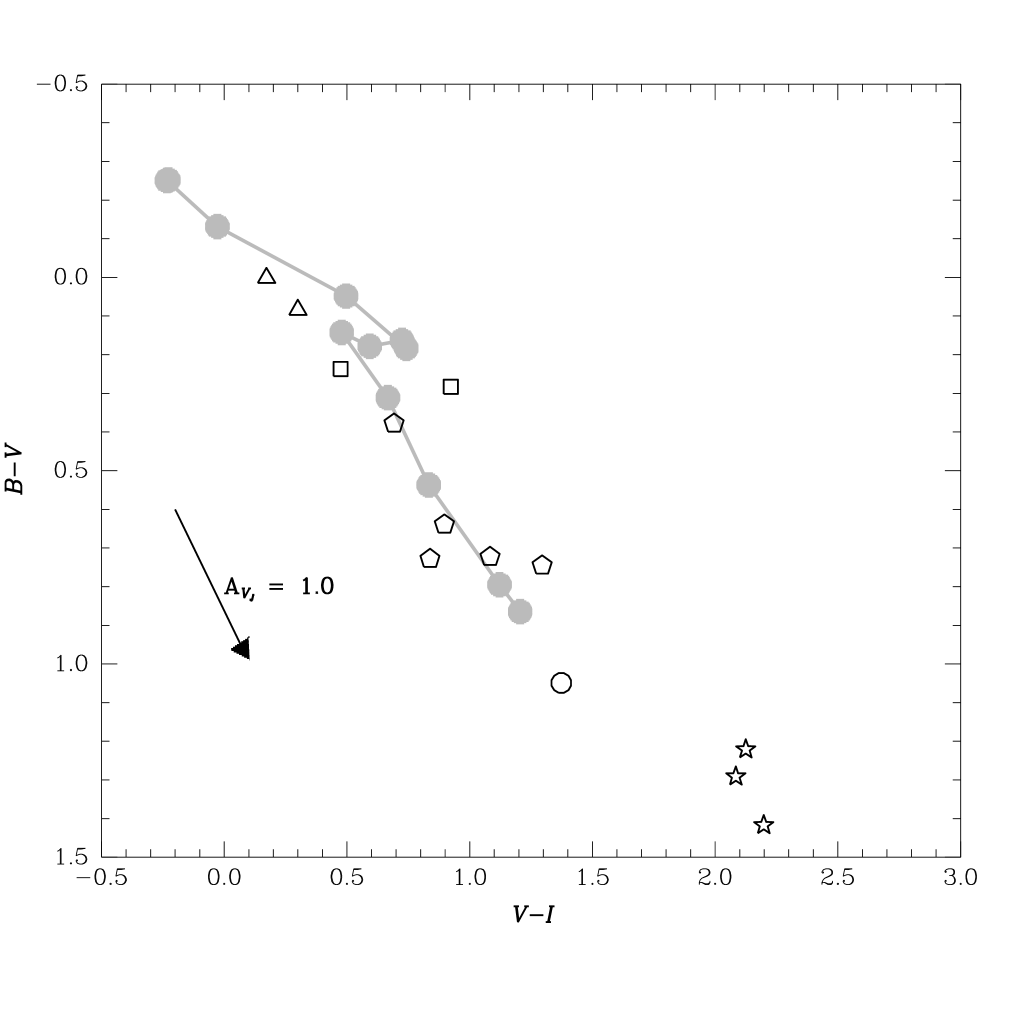
The colors of clusters help us to sort out ambiguities between the masses/luminosities of clusters and their ages, though intrinsic reddening can always make clusters appear older than they actually are. In general, we expect clusters to become redder and to fade as they become older. Figure 8 suggests such a trend, with a larger fraction of fainter clusters as the colors become redder, but there is a large amount of apparent “contamination” due to apparently bright, red objects.
Figure 2 shows cluster candidates spread over the area of the group. Because of the complex group history and multiple interaction events, we now consider each of the marked regions separately.
3.1 Tidal Tail
Within the tidal tail region in Figure 9, point sources were identified. Of these, six have red colors () more typical of stars than star clusters; some of these also have magnitudes that make them unreasonably luminous for red clusters at the distance of Stephan’s Quintet. They are indicated in Table 1 with an “S” in the last column and are excluded from the following discussion. The physical association of all of the non-stellar sources, except perhaps objects 1 and 8, with the optical tail supports their identification as star clusters associated with the group.
In the color-color diagram for this region (Figure 9b), there is evident clustering along the evolutionary track in the age range Myr. Unfortunately, with the versus color-color diagram it is not possible to accurately determine an age within this range. The cluster candidates that lie above the track, at and , have positions consistent with ages of a few tens of Myr and magnitudes of extinction; however the degeneracy between age and reddening makes such a claim uncertain. If significant reddening affects several of the sources consistent with unreddened ages of Myr, it is possible that there could be very young ( Myr) star clusters in the tail, but we have no direct evidence for such a population.
It is interesting to compare the ages of clusters in the tail to the age of the tidal tail itself. Through such a comparison we can consider whether the clusters were drawn out from the parent galaxy, or whether they formed in the tail itself. The age of the NGC 7319 tidal tail has been estimated by Moles et al. (1997) by assuming that the tail formed with the most recent encounter of NGC 7320C with NGC 7319. Briefly, the velocity of NGC 7320C in the transverse direction was assumed equal to that in the radial direction. At this velocity, it would travel to its kpc separation on the sky in yr. Another rough estimate for the age of a tidal tail is given by the ratio of the length of the tail ( kpc) to the rotational velocity of the galaxy ( km s-1) which gives yr, consistent with the estimated time of last encounter with NGC 7320C. Clearly, these are rough estimates, but we conclude that the ages of most of the star clusters in the tail of NGC 7319 are consistent with their formation within the tail itself. It is also possible that several of them are actually younger.
The majority of the clusters are not considerably older than the tail, as they would be if they formed with NGC 7319 itself. However, two objects, 1 and 21, have colors consistent with ages of a few Gyr. Number 21 is close to the base of the tail, and could easily be an outlier from the parent galaxy globular cluster population. Number 1 would have had to be pulled out with the tail, but it does not lie directly in the tail. Object 3 appears significantly to the left of the tail on the color-color diagram. This may be a compact background galaxy or perhaps a young cluster with a nebular contribution to its colors (see e.g., Johnson et al. 1999).
Within our photometric errors, there is no obvious relationship between the implied ages (colors) of the star clusters and their locations along the length of the tail; star cluster candidates at the tip (e.g., objects 2 and 4) and those nearest to NGC 7319 (e.g., object 22) occupy the same space in the color-color diagram.
Object 12 is notably luminous with . This is consistent with the luminous tail of the distribution of star clusters found in the inner regions of ongoing young mergers such as the Antennae (Whitmore et al., 1999) and NGC 7252 (Miller et al., 1997), and it is also quite blue, with . However, this is the first reported detection of such a luminous cluster in a tidal tail. Given its relative brightness (), this object is an excellent target for future spectroscopy to confirm its identification and constrain its age and metallicity.
3.2 Sky Region
An expanded view of the sky region, with its point sources identified, is presented in Figure 10, along with the locations of the sources in a color-color diagram. Three of them have red colors consistent with stars. The colors and magnitudes of the individual sources are listed in Table 2.
The sky region could be considered as the only “blank” region in the two WFPC2 visits to SQ, and therefore could in principle be used to statistically remove background contamination from our star cluster counts. However, the concentration of the three bluest sources (objects 30, 31, and 33) in the same region of the images suggests that perhaps there are some young star clusters here as well. The implied ages are consistent (– Myr) with the NGC 7319 tail population. Star clusters at the upper end of this age range could have formed in the outer regions of NGC 7319 and then been stripped out into the intergalactic medium. We estimate a minimum timescale for this of Myr for such a cluster to travel kpc at a typical galactic escape/rotation velocity of km s-1.
Alternatively, the formation of clusters in this intergalactic region is not implausible as it contains a significant amount of Hi (Shostak, Allen, & Sullivan, 1984) as well as diffuse, blue optical emission (Schombert, Wallin, & Struck-Marcell, 1990). The existing intergalactic Hi could be compressed by an encounter so that its density is increased, thus enhancing the star formation efficiency (Elmegreen et al., 2000).
3.3 NGC 7319 and Vicinity
NGC 7319, classified as a barred spiral (Sbc; Hickson & Mendes de Oliveira, 1992) is the member of SQ with the most prominent evidence of tidal disturbance. There are point sources, of them likely to be stellar with , in this region. The color-color diagram for these sources is presented and the individual sources are identified in the image in Figure 11.
Most of the bluest cluster candidates in the region, with ages – Myr (triangles and squares in Figure 11), are located along the double spiral arm. It is interesting that these clusters may have formed well after any known interaction of NGC 7319 with NGC 7320C. As discussed in § 3.1, the last encounter with NGC 7320C is likely to have occurred Myr ago. Perhaps more recent cannibalism of a satellite is responsible for this star formation event. Alternatively, late formation of star clusters could have been triggered by a delayed return of tidally ejected material over a timescale of a few Gyr (Hibbard & Mihos, 1995).
Intermediate-aged and older clusters, including several consistent with ages of Gyr, are distributed more uniformly throughout the region. There are no luminous () clusters in the inner regions of NGC 7319. This is in contrast to the classical Toomre sequence mergers, such as NGC 7252 (Miller et al., 1997) and NGC 3921 (Schweizer et al., 1996), in which young, blue clusters are abundant in the central regions. Given our completeness limits, such a population should have been detectable for distances kpc from the galaxy nucleus unless embedded within dust clouds. In addition, some point sources are detected in the bulge (e.g., objects 54, 58, and 59) with absolute magnitudes down to .
Several of the older cluster candidates (with and ) are very luminous () if at the distance of Stephan’s Quintet. A cluster with such red color and a solar metallicity would have only if it was more massive than (Schweizer et al., 1996). Even with sub-solar metallicity the masses would be , considerably higher than for clusters seen in other environments. Perhaps these are foreground stars or the concentrated nuclei of dwarf elliptical galaxies rather than isolated star clusters. If so, they significantly contaminate the overall luminosity function presented in Figure 7. As the reddening vector is almost parallel to the evolutionary tracks, extinction can cause clusters to appear older than their actual ages. However, these bright star cluster candidates are located at the outskirts of NGC 7319 where substantial extinction is not expected.
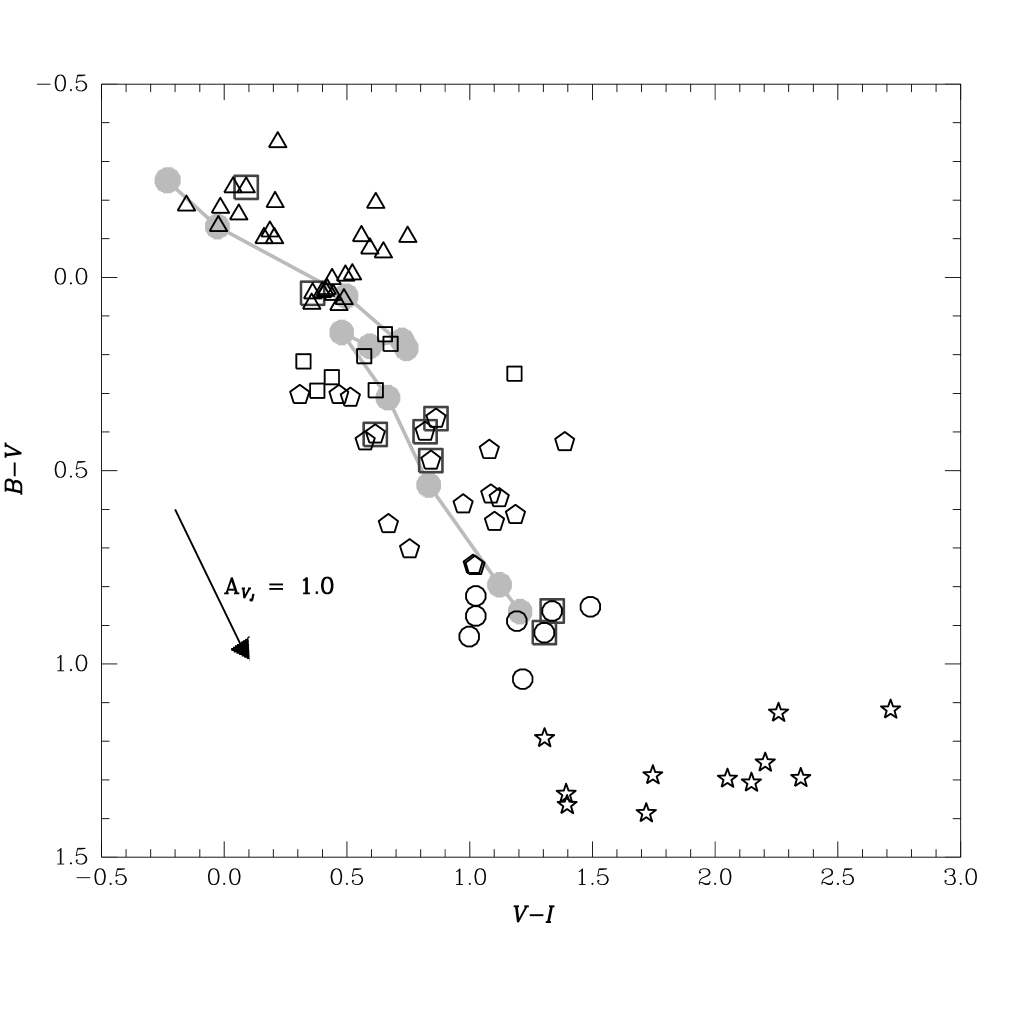
3.4 NGC 7318 B/A and the Northern Starburst Region
The region surrounding NGC 7318 B/A is the most fertile site for star cluster candidates. Seventy point sources, more than half of the total number in the entire field, were found in this region (shown in Figure 12). The sources, only of which we classify as stellar, are listed in Table 4. Many are associated with bright, blue structures such as the eastern spiral arm of NGC 7318B and the northern tidal debris.
This region is also the only one of the four to contain very young cluster candidates with ages Myr, see Figure 12. These clusters are not localized in a single burst region. They are spread over this area, both north and south of NGC 7318 B/A, and extending over kpc. Objects 90 and 93 are both luminous ( and ) and extremely blue, consistent with clusters of mass . Another striking feature of the color-color diagram for this region is the tight knot of star cluster candidates coincident with Myr on the evolutionary track. This population (object 69 in Table 3 and indicated with asterisks in Table 4) is physically associated with both NGC 7318B and the northern starburst region. Such coeval star formation on physical scales up to kpc is remarkable.
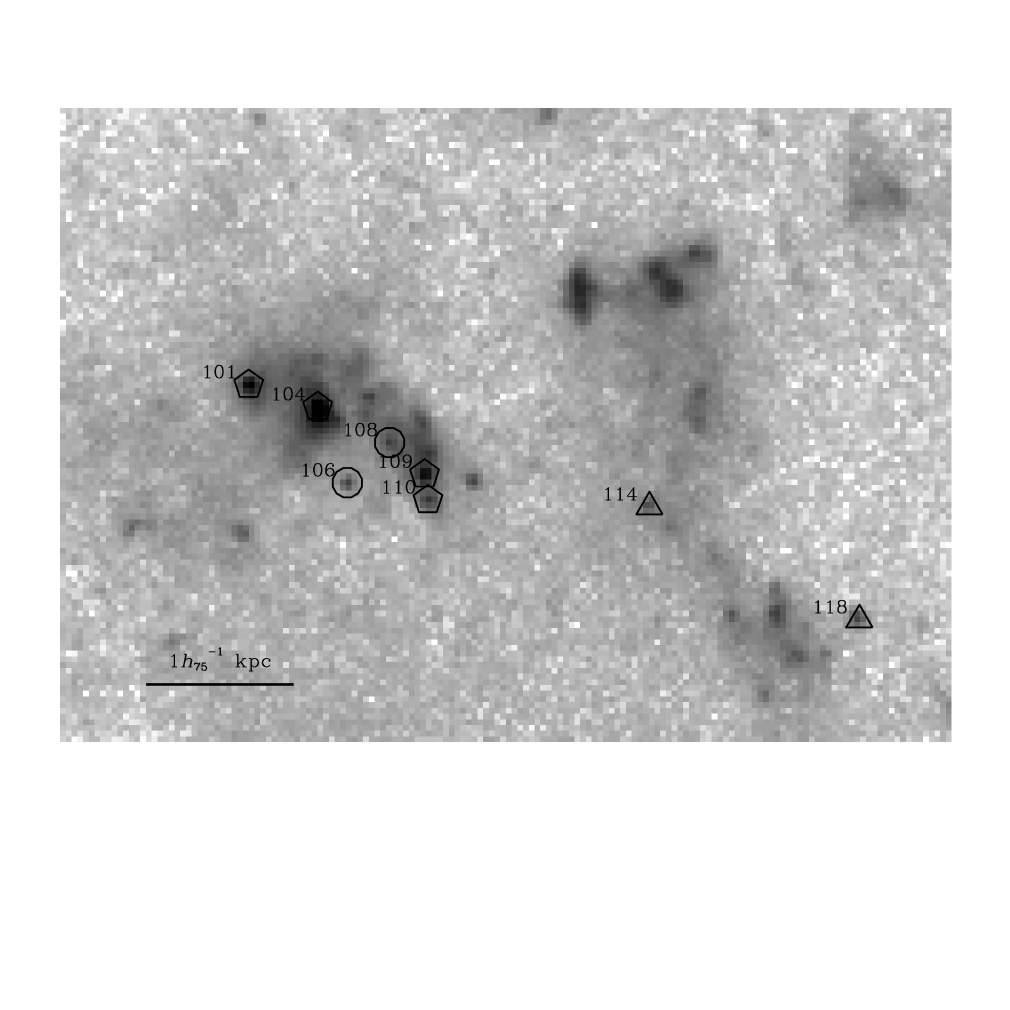
The northern starburst region hosts a luminous far-infrared source with bright H emission (Xu, Sulentic, & Tuffs, 1999) which is coincident with a dwarf galaxy. We find several young cluster candidates within the immediate environs of this source (see Figure 13). Based only on the color-color age determination, these point sources appear to encompass a range of ages. However, extinction is likely to be significant and patchy in such an active region, making these determinations unreliable. Therefore, these ages should be considered upper limits as reddening can only make a cluster appear older. The northern starburst region is of particular interest because active star formation has apparently occurred more recently than the past major encounter. Assuming that NGC 7318B is traveling at km s-1 it has been at least Myr since it passed through the northern starburst region. From the ratio of the stellar mass to the near-IR luminosity Xu et al. (1999) estimated a starburst age of – Myr. We find several star clusters younger than this, and therefore they must have formed after the initial burst and the actual passage of NGC 7318B through the region.
4 Spectra of the Tidal Clumps of NGC 7318B
A long-slit spectrum of a region of tidal debris south of NGC 7318B was obtained on 1999 November 11 with the Marcario Low-Resolution Spectrograph (Hill et al., 1998a, b) on the Hobby-Eberly Telescope (Ramsey et al., 1998). This particular region has at least five separate areas that can be distinguished along the long slit. A line mm-1 grism was used with the ″ slit to give over a 4-pixel resolution element. The spectrum covered the wavelength range – Å. At the wavelength of H at , a pixel corresponds to Å, or km s-1. Wavelength calibration was provided by Ne, Cd, and Ar comparison lamps.
The position of the slit is illustrated on a portion of the HST/WFPC2 image in Figure 14 and the image of the full spectrum is shown. A strong continuum is apparent for the brightest blue clump, and a weak one for the area closest to the top of the image, which contains two smaller blue knots. In each of the emission lines, five separate debris regions can be distinguished. Approximate velocities are noted on the “close–up” view of the wavelength region covering H, [Nii], and [Sii]. We chose to display the image of the spectrum rather than an extracted spectrum in order to illustrate the complex and connected velocity structure in this region.
Comparing the velocities of the various regions along the debris to the velocities of the group galaxies may elucidate the origin of the gas in question. From the top of Figure 14 to the bottom: The blue knots above the central clump of debris are – km s-1 blueward from the strong continuum source (at km s-1). The latter is consistent with the velocity of NGC 7318B, which is blueshifted by km s-1 from the rest of the group. The strong continuum source also has strong emission lines and both are thought to come from the tight blue knot seen in the HST image. However, interpretation is confused by the superposition of this blue knot on a much redder galaxy. This redder galaxy could be a dwarf member of the group but its clear spiral structure suggests that it may just be a superposition of the debris on a background galaxy. The extracted spectrum from this region does not show any spectral features that would indicate the redshift of this galaxy. The region of the spectrum below the strong continuum source shows redshifted emission lines ranging from – km s-1 redward of km s-1. There is emission close to the velocity ( km s-1) of the three galaxies NGC 7317, NGC 7318A, and NGC 7319.
We conclude that there is emission from this debris at the velocities of both of the galaxies NGC 7318A and NGC 7318B, as well as in between these two velocities. This seems not to be a single tidal feature, at least not one destined to be long-lived. Some of the material is leading NGC 7318B, and some is trailing, with some material “left behind” at a velocity close to that of NGC 7318A and NGC 7319. There is also Hi at several velocities , , and km s-1, but only that at km s-1 is localized in this area south of NGC 7318B (Shostak, Allen, & Sullivan, 1984). The northern starburst region shows components at and km s-1 in Hi (Shostak, Allen, & Sullivan, 1984), in H (Moles, Sulentic, & Márquez, 1997), and in CO (Smith & Struck, 2000), indicating active star formation associated with gas at these two velocities. Apparently, active star formation at different velocities is also present in the region of debris south of NGC 7318B. This region contains a complex superposition of gas, not necessarily all associated with a single physical structure. It is consistent with a picture in which NGC 7318B is flying at high speed through various “layers” of gas and triggering star formation events, sometimes over large spatial scales.
5 Conclusions and Discussion
The main conclusions of this work relate to the formation history of star clusters in Stephan’s Quintet (HCG 92). Here we summarize the conclusions and qualitatively compare the population of clusters (their ages and spatial location) to those in other environments.
-
1.
There are point sources in SQ with , the vast majority of which are likely to be star clusters. These clusters have , below which the completeness of our study drops rapidly. Their colors are in the ranges and . Color-color and color-magnitude diagrams for the full sample of point sources, a histogram of colors, and the luminosity function of all star cluster candidates are presented.
-
2.
We do not detect large numbers of star cluster candidates in the central regions of the galaxies (NGC 7319, NGC 7318A, and NGC 7318B). Instead, the majority are in the tidal debris associated with the various galaxies, and in the northern starburst region. The colors of many of the candidate clusters are blue, indicating that stars are apparently forming separate from the disks and bulges of galaxies.
Detection of bright, young clusters at large distances from galaxy centers is in contrast to the young star cluster systems of isolated galaxy pairs such as, for example, NGC 4038/39 (Whitmore et al., 1999), NGC 7252 (Miller et al., 1997), NGC 3256 (Zepf et al., 1999), and NGC 3921 (Schweizer et al., 1996). Such pairs typically have hundreds of blue () clusters centered on the merger remnant. Only one of the four pairs just listed, NGC 3256, has an abundance of such clusters in its long, sweeping tails (Knierman et al., 2001).
-
3.
Several distinct epochs of recent star formation have been identified in various regions throughout SQ: (a) the northern starburst region contains many of the very youngest clusters, some only – Myr old. Several such very young clusters are also found in the debris south of NGC 7318B/A; (b) a group of more than a dozen clusters is found, all with colors quite close to and , which implies an age of Myr. These objects, despite their similar ages, are distributed over kpc, i.e., in both the northern starburst region and in the debris south of NGC 7318B/A; (c) a group of clusters, both in the long tail of NGC 7319 and surrounding the galaxy itself, with ages in the range – Myr. The versus color-color diagram does not allow accurate measurements of the ages within this range; thus we cannot determine if these clusters have a large range of ages or if they were formed over one or more shorter intervals. Most are consistent with having formed in the tail itself, which is estimated to be about Myr old, but some have blue colors that imply they may have formed more recently. Regardless, these clusters were formed in the tail. They are not an old population of clusters drawn out from NGC 7319; (d) an old population (– Gyr) spread over the field, including some in the northern starburst region. These must have been stripped from one or more of the galaxies or formed in previous interaction events.
-
4.
Roughly twenty star cluster candidates have absolute magnitudes brighter than . The colors of these objects range from , with nine concentrated around . For solar metallicity, a cluster with must be quite massive ( ) to be so luminous. Clusters redder than would have masses which seems implausible for a single cluster; these objects may be nucleated dwarfs or foreground stars. However, even if these red objects are eliminated from the luminosity function shown in Figure 7, there are still many quite luminous clusters remaining. In comparison, there are no globular clusters in the Milky Way brighter than (Reed, Hesser, & Shawl, 1988).
The population of star cluster candidates found in Stephan’s Quintet can be compared to those found in the central regions of traditional merger remnants. Schweizer et al. (1996) found that the mean colors of various star cluster systems are related to the stage of the interaction. Of the several mergers considered in that work, NGC 4038/39 was found to have the bluest/youngest cluster system with median , while NGC 7252 and NGC 3921 have few very blue clusters and a median age consistent with the peak interaction epoch. NGC 3256 is another example of a merger with a very young ( Myr) star cluster system (Zepf et al., 1999). It was suggested that the formation of new stars requires some ongoing processes such as tidal forces or shocks. The star cluster systems of these different mergers also differ from each other in the number of extremely luminous clusters; of the galaxies just discussed NGC 7252 has a significantly larger number of clusters. It was hypothesized that the difference in the maximum cluster mass could be related to the gas supply, i.e., dependent on whether one or both of the merging galaxies were gas-rich (Schweizer et al., 1996).
The colors and luminosity functions of the population of clusters in Stephan’s Quintet resembles those in some merging galaxy pairs. This is especially true if we separately consider the different regions of the group. The northern starburst and NGC 7318B/A regions have dominant young populations as do active mergers such as the Antennae. The tail and spiral arms of NGC 7319 host an intermediate-aged population similar to that found in somewhat older merger remnants. This is consistent with the idea that recent interaction activity of some sort is needed to generate active star cluster formation. However, there are clearly some clusters in several regions of SQ which seem younger than any identified processes. We shall return to this point subsequently.
Despite the similarities in populations, there is a critical difference in the spatial distribution of the cluster population of SQ and those of merging pairs. The cluster populations of older merging pairs are heavily concentrated in the inner few kpc of the galaxies. In Stephan’s Quintet, we see very few cluster candidates near any of the galaxy nuclei, though some are found at distances comparable to young clusters in the youngest of the Toomre mergers, the Antennae, at 3–10 kpc. Though higher background in these regions makes us less sensitive to star clusters, an abundant, luminous population would have been detected. Instead, we see objects spread through the spiral arms, the tidal debris, and even in intergalactic regions. This difference is likely to be due to the fact that no actual mergers have occurred in the SQ region within the past billion years. Instead, SQ has hosted high velocity encounters such as NGC 7318B with the intragroup medium and possibly NGC 7320C with NGC 7319. The formation of a central star cluster system must happen as a later stage of a galaxy merger. As NGC 7317 and NGC 7318A show elliptical morphology, one can speculate that they are the products of past mergers, leading to bimodel distributions of cluster ages. NGC 7317 was not covered in our WFPC2 images. NGC 7318A shows no evidence for a young nuclear population; but an older population would likely have faded out of view in our images. (The Milky Way globular clusters have a peak luminosity of .)
We have stated that Stephan’s Quintet has few young star clusters near the centers of the galaxies. Alternatively, we should consider whether galaxy pairs have young star clusters in their tidal debris and tails such as NGC 7319. Of the four merging pairs, Knierman et al. (2001) found only one, NGC 3256, had a substantial population of clusters in its tidal tails. Because this merger was the only one of the three without prominent tidal dwarf galaxies in the debris, they suggested that structure preferentially formed at a certain scale. Either dwarf galaxies or star clusters formed, but not both. The long tidal tail attached to NGC 7319 in Stephan’s Quintet appears to contradict this suggestion. SQ has a larger number of tidal dwarf candidates than any of the other Hickson compact groups surveyed by Hunsberger et al. (1996). Thirteen of these tidal dwarfs are in the NGC 7319 tail, which also has a comparable number of cluster candidates. We are to conclude that: (1) the Knierman et al. suggestion of a preferred scale for structure formation is incorrect and based on a coincidence in a small sample; (2) the situation is not the same in compact groups of galaxies as it is for isolated galaxy pairs that are merging; or (3) two separate interaction events triggered the formation of different populations of objects in the NGC 7319 tail. Without more data we cannot determine which of these ideas is correct, but in the complex compact group environment, multiple perturbing events are likely.
Compact groups are excellent laboratories for the study of star formation in a dynamic environment. The relics of such interactions might be expected to be separate generations of star clusters. In Stephan’s Quintet we certainly see evidence for several distinct populations. The coeval star formation is spread over surprisingly large scales, tens of kpc, and occurs both in regions associated with the galaxies and in the intragroup gas. Is the formation of star clusters in debris and outside of galaxies common in the compact group environment? Only one other compact group, HCG 31, has been studied in detail with HST/WFPC2. There are star clusters in the merging galaxy system, NGC 1741, in this group (Johnson et al., 1999). The median age of these clusters is extremely young, only Myr, and there is not a significant population of clusters older than Myr. Unlike Stephan’s Quintet, HCG 31 does host an active merging system and therefore it is not surprising that it does have a centrally concentrated young star cluster system. What is most striking is that the NGC 1741 system has been caught in its infancy.
HCG 31 also has very recent ( Myr) star formation in two of the dwarf galaxies at the redshift of the group (Johnson & Conti, 2000). Galaxy “E” has both a young star cluster population and an underlying old stellar population, similar to the large merging system, NGC 1741. However, Galaxy “F” has only a young stellar population, both diffuse and concentrated in star clusters, and no underlying old population. It appears to be a galaxy that formed from stripped gas out in the tidal debris. Johnson et al. (2000) point out that a mechanism is needed to generate coeval star formation over several galaxies in the group that are spread over kpc. They discuss that a shock would not propagate at a fast enough rate to explain this scale, and raise the possibility of star formation resulting from a series of high velocity collisions of flows of gas, followed by delayed star formation in a small-scale cooling flow. Stephan’s Quintet requires a similar mechanism for its widespread star formation, although it is not clear if the packaging is quite the same; in HCG 31 the star clusters are concentrated in dwarf galaxies. It is worth noting that HGC 31 has only a km s-1 velocity dispersion for its members while HCG 92, with its high velocity encounter, has a velocity dispersion of km s-1.
Despite this difference, in the two cases of compact groups that have been studied, there is evidence for recent star formation distributed over scales of tens of kpc. However, HCG 92 and HCG 31 are not likely to be representative of Hickson compact groups. They are among the few groups with the most obvious signs of tidal interaction. It is likely, however, that other compact groups, particularly elliptical-rich groups, would have had such star-forming events in the past. This should be recorded in the age spectrum of their cluster populations. We might expect to see clusters out in the intragroup medium as well as concentrated around the nuclear regions of the ellipticals. Given the high velocity dispersion of Stephan’s Quintet, it may be an unusual compact group. Investigating the connection between dispersion within a compact group and star cluster populations could offer insight into the mechanism for star cluster formation in the intragroup medium. If the last interaction was more than billion years ago, even the brightest clusters in a group such as Stephan’s Quintet would have faded to . Despite the fact that deep images would be needed to detect such faded clusters, it would be worthwhile to study some “normal” compact groups because of the implications that this might have for the enrichment of the intragroup and intergalactic medium at high redshift. Because mergers were quite likely to be more common at high redshift, the formation of clusters at large distances from galaxies could allow measurable local pollution of intergalactic gas, even by Fe-group elements that cannot be ejected to large distances because of their Type Ia supernova origin.
References
- Ashman & Zepf (1992) Ashman, K. M. & Zepf, S. E. 1992, ApJ, 384, 50
- Bruzual & Charlot (1993) Bruzual, G. A. & Charlot, S. 1993, ApJ, 405, 538
- Elmegreen et al. (2000) Elmegreen, B. G., Efremov, Y., Pudritz, R. E., & Zinnecker, H. 2000, Protostars and Planets IV (Book - Tucson: University of Arizona Press; eds Mannings, V., Boss, A.P., Russell, S. S.), p. 179
- Gnedin & Ostriker (1997) Gnedin, O. Y. & Ostriker, J. P 1997, ApJ, 474, 223
- Harris (1991) Harris, W. E. 1991, ARA&A, 29, 543
- Hibbard & Mihos (1995) Hibbard, J. & Mihos, C. 1991, AJ, 110, 140
- Hickson (1982) Hickson, P. 1982, ApJ, 255, 382
- Hickson & Mendes de Oliveira (1992) Hickson, P. & Mendes de Oliveira, C. 1992, ApJ, 399, 353
- Hill et al. (1998a) Hill, G. J., Nicklas, H. E., MacQueen, P. J., Tejada, C., Cobos Duenas, F. J., & Mitsch, W. 1998a, Proc. SPIE, 3355, 375
- Hill et al. (1998b) Hill, G. J., Nicklas, H. E., MacQueen, P. J., Mitsch, W., Wellem, W., Altman, W., Wesley, G. L., & Ray, F. B. 1998b, Proc. SPIE, 3355, 433
- Holtzman et al. (1992) Holtzman et al. 1992, AJ, 102, 691
- Holtzman et al. (1995) Holtzman, J. A., Burrows, C. J., Casertano, S., Hester, J. J., Trauger, J. T., Watson, A. M., & Worthey, G. 1995, PASP, 107, 1065
- Hunsberger, Charlton, & Zaritsky (1996) Hunsberger, S. D., Charlton, J. C. & Zaritsky, D. 1996, ApJ, 462, 50
- Hunsberger, Charlton, & Zaritsky (1998) Hunsberger, S. D., Charlton, J. C. & Zaritsky, D. 1998 ApJ, 505, 536
- Johnson & Conti (2000) Johnson, K. E., & Conti, P. S. 2000, AJ, 119, 2146
- Johnson et al. (1999) Johnson, K. E., Vacca, W. D., Leitherer, C., Conti, P. S., & Lipscy, S. J. 1999, AJ, 117, 1708
- Knierman et al. (2001) Knierman, K. A., Gallagher, S. C., Charlton, J. C., Hunsberger, S. D., Whitmore, B., Kundu, A., Hibbard, J., & Zaritsky, D. 2001, AJ, submitted
- Kundu et al. (1999) Kundu, A., Whitmore, B. C., Sparks, W. B., & Macchetto, F. D., Zepf, S. E., & Ashman, K. M. 1999, AJ, 513, 733
- Mendes de Oliveira & Hickson (1994) Mendes de Oliveira, C., & Hickson, P. 1994, ApJ, 427, 684
- Mirabel, Dottori, & Lutz (1992) Mirabel, I. F., Dottori. H., & Lutz, D. 1992, A&A, 256, L19
- Miller et al. (1997) Miller, B. W., Whitmore, B. C., Schweizer, F. & Fall, S. M. 1997, AJ, 114, 2381
- Moles, Sulentic, & Márquez (1997) Moles, M., Sulentic, J. W., & Márquez, I. 1997, ApJ, 485, L69 (MSM97)
- Moles, Márquez, & Sulentic (1998) Moles, M., Márquez, I., & Sulentic, J. W. 1998, A&A, 334, 473
- Paturel et al. (1997) Paturel, G., et al. 1997, A&AS, 124, 109
- Pietsch et al. (1997) Pietsch, W., Trinchieri, G., Arp, H., & Sulentic, J. W. 1997, A&A, 322, 89
- Ponman et al. (1996) Ponman, T. J., Bourner, P. D. J., Ebeling, H., & Bohringer, H. 1996, MNRAS, 283, 690
- Ramsey et al. (1998) Ramsey, L. W., et al. 1998, Proc. SPIE, 3352, 34
- Reed, Hesser, & Shawl (1988) Reed, B. C., Hesser, J. E., & Shawl, S. J. 1988, PASP, 100, 545
- Saracco & Ciliegi (1995) Saracco, P. & Ciliegi, P. 1995, A&A, 301, 348
- Schombert, Wallin, & Struck-Marcell (1990) Schombert, J. M., Wallin, J. F. & Struck-Marcell, C. 1990, AJ, 99, 497
- Seaton (1979) Seaton, M.J. 1979, MNRAS, 187, 73
- Schweizer et al. (1996) Schweizer, F., Miller, B., Whitmore, B., & Fall, S.M. 1996, AJ, 112, 1839
- Shostak, Allen, & Sullivan (1984) Shostak, G. S., Allen, R. J., & Sullivan, W. T.(1984, A&A, 139, 15
- Smith & Struck (2000) Smith, B. J., & Struck, C. 2000, AJ, in press
- Stephan (1877) Stephan, M. E. 1877, CR Acad. Sci. Paris, 84, 641
- Stetson (1987) Stetson, P.B. 1987, PASP, 99, 191
- van der Hulst & Rots (1981) van der Hulst, J. M. & Rots, A. H. 1981, AJ, 86, 12
- Verdes-Montenegro et al. (1998) Verdes-Montenegro, L., Yun, M. S., Perea, J., del Olmo, A., & and Ho, P. T. P. 1998, ApJ, 497, 89
- Vílchez & Iglesias-Páramo (1998) Vílchez, J. M. & Iglesias-Páramo, J. 1998, ApJS, 117, 1
- Whitmore, Heyer & Casertano (1999) Whitmore, B., Heyer, I., & Casertano, S. 1999, PASP, 111, 1559
- Whitmore et al. (1993) Whitmore, B., Schweizer, F., Leitherer, C., Borne, K., & Robert, C. 1993, AJ, 106, 1354
- Whitmore et al. (1999) Whitmore, B., Zhang, Q., Leitherer, C., Fall, S.M., Schweizer, F., & Miller, B. 1999, AJ, 118, 1551
- Xu, Sulentic, & Tuffs (1999) Xu, C. , Sulentic, J. W. & Tuffs, R. 1999, ApJ, 512, 178
- Zepf & Ashman (1993) Zepf, S. E., & Ashman, K. M. 1993, MNRAS, 264, 611
- Zepf et al. (1999) Zepf, S., Ashman, K., English, J., Freeman, K., & Sharples, R. 1999, AJ, 118, 752
- Zhang & Fall (1999) Zhang, Q. & Fall, S. M. 1999, ApJ, 527, L81


| LabelbbThe numeric labels identify the sources as labeled in Figure 9a. | cc was calculated assuming a redshift distance modulus of 34.69 corresponding to 85 Mpc for km s-1 Mpc-1 and . Note that the absolute magnitudes of putative stars are marked with —–. | NotesddLetters A, B, C, D, and S correspond to color groups as defined in the caption to Figure 9. The star cluster candidates apparently associated with the tidal tail are designated with the letter T. | ||||||
|---|---|---|---|---|---|---|---|---|
| 1 | 25.06 | 0.13 | 0.71 | 0.19 | 0.87 | 0.17 | C | |
| 2 | 24.42 | 0.10 | 0.27 | 0.13 | 0.44 | 0.16 | B, T | |
| 3 | 24.15 | 0.06 | 0.58 | 0.09 | 0.42 | 0.10 | C | |
| 4 | 23.95 | 0.06 | 0.12 | 0.07 | 0.57 | 0.08 | B, T | |
| 5 | —— | 24.00 | 0.06 | 1.44 | 0.14 | 2.44 | 0.07 | S |
| 6 | —— | 21.70 | 0.01 | 1.24 | 0.02 | 1.80 | 0.01 | S |
| 7 | 22.72 | 0.02 | 0.41 | 0.03 | 1.01 | 0.03 | C, T | |
| 8 | 24.85 | 0.10 | 0.08 | 0.12 | 0.69 | 0.16 | A | |
| 9 | 24.75 | 0.09 | 0.29 | 0.12 | 0.57 | 0.15 | B, T | |
| 10 | 24.77 | 0.11 | 0.10 | 0.15 | 0.31 | 0.19 | B, T | |
| 11 | 23.12 | 0.03 | 0.18 | 0.04 | 0.45 | 0.05 | B, T | |
| 12 | 21.53 | 0.01 | 0.14 | 0.01 | 0.52 | 0.02 | A, T | |
| 13 | 24.68 | 0.08 | 0.27 | 0.10 | 0.90 | 0.11 | B | |
| 14 | 24.92 | 0.09 | 0.36 | 0.12 | 1.15 | 0.12 | C | |
| 15 | —— | 22.00 | 0.01 | 1.20 | 0.03 | 1.93 | 0.02 | S |
| 16 | —— | 22.31 | 0.02 | 1.18 | 0.03 | 1.91 | 0.02 | S, T |
| 17 | —— | 22.26 | 0.02 | 1.46 | 0.03 | 1.67 | 0.02 | S, T |
| 18 | —— | 20.77 | 0.01 | 1.20 | 0.01 | 1.72 | 0.01 | S, T |
| 19 | 24.57 | 0.08 | 0.36 | 0.10 | 1.05 | 0.10 | C, T | |
| 20 | 25.17 | 0.12 | 0.15 | 0.16 | 0.97 | 0.17 | B, T | |
| 21 | 24.65 | 0.08 | 0.63 | 0.12 | 0.99 | 0.11 | C | |
| 22 | 24.92 | 0.10 | 0.06 | 0.12 | 0.64 | 0.16 | A, T | |
| 23 | 24.77 | 0.08 | 0.40 | 0.12 | 0.98 | 0.12 | C, T |
| LabelbbThe numeric labels identify the sources as labeled in Figure 10a. | cc was calculated assuming a redshift distance modulus of 34.69 corresponding to 85 Mpc for km s-1 Mpc-1 and . Note that the absolute magnitudes of putative stars are marked with —–. | NotesddLetters correspond to color groups as defined in the caption to Figure 9. | ||||||
|---|---|---|---|---|---|---|---|---|
| 24 | 20.78 | 0.01 | 0.38 | 0.01 | 0.69 | 0.01 | C | |
| 25 | 21.67 | 0.01 | 1.05 | 0.02 | 1.37 | 0.02 | D | |
| 26 | 25.01 | 0.13 | 0.28 | 0.16 | 0.92 | 0.17 | B | |
| 27 | 23.87 | 0.05 | 0.73 | 0.08 | 0.84 | 0.07 | C | |
| 28 | —– | 23.56 | 0.04 | 1.42 | 0.09 | 2.20 | 0.04 | S |
| 29 | 24.38 | 0.06 | 0.72 | 0.10 | 1.08 | 0.09 | C | |
| 30 | 22.97 | 0.03 | 0.00 | 0.04 | 0.17 | 0.06 | A | |
| 31 | 23.18 | 0.04 | 0.08 | 0.04 | 0.30 | 0.06 | A | |
| 32 | 24.78 | 0.09 | 0.64 | 0.13 | 0.90 | 0.12 | C | |
| 33 | 22.66 | 0.02 | 0.24 | 0.03 | 0.47 | 0.03 | B | |
| 34 | —– | 24.02 | 0.05 | 1.22 | 0.10 | 2.12 | 0.06 | S |
| 35 | 23.86 | 0.04 | 0.74 | 0.07 | 1.29 | 0.06 | C | |
| 36 | —– | 21.78 | 0.01 | 1.29 | 0.02 | 2.08 | 0.01 | S |
| LabelbbThe numeric labels identify the sources as labeled in Figure 11a. | cc was calculated assuming a redshift distance modulus of 34.69 corresponding to 85 Mpc for km s-1 Mpc-1 and . Note that the absolute magnitudes of putative stars are marked with —–. | NotesddLetters correspond to color groups as defined in the caption to Figure 9. | ||||||
|---|---|---|---|---|---|---|---|---|
| 37 | 24.06 | 0.06 | 0.16 | 0.07 | 0.52 | 0.09 | B | |
| 38 | —– | 23.57 | 0.04 | 1.30 | 0.08 | 2.78 | 0.04 | S |
| 39 | 24.37 | 0.07 | 0.75 | 0.12 | 1.11 | 0.09 | C | |
| 40 | 24.40 | 0.07 | 0.24 | 0.09 | 0.46 | 0.11 | B | |
| 41 | —– | 23.04 | 0.03 | 1.19 | 0.05 | 2.12 | 0.03 | S |
| 42 | 21.11 | 0.01 | 0.80 | 0.01 | 1.12 | 0.01 | D | |
| 43 | 25.00 | 0.13 | 0.13 | 0.16 | 0.72 | 0.20 | B | |
| 44 | —– | 23.33 | 0.03 | 1.25 | 0.07 | 1.83 | 0.04 | S |
| 45 | 23.86 | 0.05 | 0.03 | 0.06 | 0.51 | 0.08 | A | |
| 46 | 24.73 | 0.09 | 0.20 | 0.11 | 0.33 | 0.17 | B | |
| 47 | 24.27 | 0.07 | 0.61 | 0.10 | 0.92 | 0.10 | C | |
| 48 | 24.31 | 0.08 | 0.28 | 0.11 | 0.11 | 0.16 | B | |
| 49 | 24.66 | 0.12 | 0.11 | 0.14 | 0.58 | 0.17 | B | |
| 50 | 21.79 | 0.01 | 1.01 | 0.02 | 1.32 | 0.02 | D | |
| 51 | 23.72 | 0.04 | 0.21 | 0.06 | 0.58 | 0.07 | B | |
| 52 | 23.12 | 0.03 | 0.50 | 0.04 | 0.73 | 0.04 | C | |
| 53 | 23.24 | 0.03 | 0.49 | 0.04 | 0.80 | 0.04 | C | |
| 54 | 21.19 | 0.01 | 0.29 | 0.02 | 0.88 | 0.02 | B | |
| 55 | 23.61 | 0.04 | 0.09 | 0.05 | 0.50 | 0.07 | A | |
| 56 | 24.29 | 0.07 | 0.89 | 0.11 | 0.90 | 0.09 | D | |
| 57 | —– | 21.90 | 0.01 | 1.34 | 0.02 | 2.12 | 0.01 | S |
| 58 | 24.00 | 0.07 | 0.08 | 0.39 | 0.14 | A | ||
| 59 | —– | 23.54 | 0.06 | 1.14 | 0.11 | 1.84 | 0.06 | S |
| 60 | 23.87 | 0.04 | 0.16 | 0.06 | 0.42 | 0.08 | B | |
| 61 | 24.33 | 0.06 | 0.93 | 0.11 | 1.16 | 0.08 | D | |
| 62 | —– | 24.54 | 0.08 | 1.26 | 0.18 | 1.77 | 0.09 | S |
| 63 | 25.29 | 0.14 | 0.40 | 0.19 | 0.73 | 0.20 | C | |
| 64 | 21.46 | 0.01 | 0.84 | 0.02 | 1.16 | 0.01 | D | |
| 65 | 23.83 | 0.05 | 0.23 | 0.06 | 0.81 | 0.07 | B | |
| 66 | 21.64 | 0.01 | 0.89 | 0.02 | 1.19 | 0.01 | D | |
| 67 | —– | 23.50 | 0.04 | 1.36 | 0.07 | 1.40 | 0.04 | S |
| 68 | —– | 24.81 | 0.10 | 1.12 | 0.18 | 2.71 | 0.10 | S |
| 69 | 24.75 | 0.10 | 0.07 | 0.12 | 0.36 | 0.16 | A |
| LabelbbThe numeric labels identify the sources as labeled in Figure 12a. | cc was calculated assuming a redshift distance modulus of 34.69 corresponding to 85 Mpc for km s-1 Mpc-1 and . Note that the absolute magnitudes of putative stars are marked with —–. | NotesddLetters correspond to color groups as defined in the caption to Figure 9. An asterisk (*) indicates a source in the tight color group with ages consistent with Myr (see 3.4 for discussion). The star cluster candidates in the dwarf galaxy in the northern starburst region (Figure 13) are designated with the letters DG. | ||||||
|---|---|---|---|---|---|---|---|---|
| 70 | 24.60 | 0.10 | 0.17 | 0.12 | 0.68 | 0.14 | B | |
| 71 | 20.89 | 0.01 | 1.04 | 0.01 | 1.22 | 0.01 | D | |
| 72 | 24.65 | 0.12 | 0.14 | 0.75 | 0.17 | A | ||
| 73 | 24.03 | 0.07 | 0.08 | 0.59 | 0.10 | A | ||
| 74 | 24.02 | 0.05 | 0.29 | 0.07 | 0.62 | 0.08 | B | |
| 75 | 24.88 | 0.12 | 0.42 | 0.18 | 0.57 | 0.19 | C | |
| 76 | 21.98 | 0.01 | 0.06 | 0.02 | 0.49 | 0.02 | A* | |
| 77 | 24.31 | 0.07 | 0.70 | 0.11 | 0.76 | 0.10 | C | |
| 78 | 22.28 | 0.02 | 0.07 | 0.03 | 0.47 | 0.03 | A* | |
| 79 | 23.21 | 0.04 | 0.05 | 0.49 | 0.06 | A* | ||
| 80 | 25.04 | 0.10 | 0.88 | 0.18 | 1.02 | 0.15 | D | |
| 81 | 23.95 | 0.05 | 0.04 | 0.06 | 0.44 | 0.09 | A* | |
| 82 | 24.08 | 0.06 | 0.20 | 0.07 | 0.57 | 0.10 | B | |
| 83 | 24.59 | 0.12 | 0.22 | 0.14 | 0.32 | 0.19 | B | |
| 84 | —– | 22.73 | 0.02 | 1.30 | 0.04 | 2.05 | 0.02 | S |
| 85 | 25.12 | 0.12 | 0.15 | 0.62 | 0.19 | A | ||
| 86 | 24.68 | 0.11 | 0.12 | 0.19 | 0.19 | A | ||
| 87 | 24.09 | 0.06 | 0.15 | 0.07 | 0.66 | 0.09 | B | |
| 88 | 24.21 | 0.07 | 0.93 | 0.12 | 1.00 | 0.10 | D | |
| 89 | 22.87 | 0.02 | 0.03 | 0.20 | 0.05 | A | ||
| 90 | 21.68 | 0.01 | 0.02 | 0.06 | 0.03 | A | ||
| 91 | 22.55 | 0.02 | 0.03 | 0.03 | 0.42 | 0.03 | A* | |
| 92 | 23.94 | 0.05 | 0.29 | 0.07 | 0.38 | 0.09 | B | |
| 93 | 21.26 | 0.01 | 0.01 | 0.02 | A | |||
| 94 | 24.36 | 0.08 | 0.09 | 0.65 | 0.12 | A | ||
| 95 | 23.57 | 0.05 | 0.05 | 0.04 | 0.09 | A | ||
| 96 | 23.83 | 0.10 | 0.74 | 0.15 | 1.01 | 0.15 | C | |
| 97 | 24.30 | 0.07 | 0.31 | 0.09 | 0.51 | 0.11 | C | |
| 98 | 24.35 | 0.07 | 0.30 | 0.09 | 0.47 | 0.11 | C | |
| 99 | 24.83 | 0.15 | 0.25 | 0.19 | 1.18 | 0.20 | B | |
| 100 | 23.43 | 0.04 | 0.26 | 0.05 | 0.44 | 0.06 | B | |
| 101 | 22.11 | 0.02 | 0.36 | 0.03 | 0.86 | 0.03 | C, DG | |
| 102 | 24.37 | 0.07 | 0.04 | 0.09 | 0.41 | 0.12 | A* | |
| 103 | 24.38 | 0.09 | 0.61 | 0.14 | 1.19 | 0.13 | C | |
| 104 | 21.17 | 0.01 | 0.41 | 0.02 | 0.61 | 0.02 | C, DG | |
| 105 | —– | 22.74 | 0.08 | 1.34 | 0.16 | 1.39 | 0.10 | S |
| 106 | 24.16 | 0.10 | 0.86 | 0.16 | 1.34 | 0.12 | D, DG | |
| 107 | 24.09 | 0.08 | 0.82 | 0.13 | 1.02 | 0.11 | D | |
| 108 | 23.48 | 0.08 | 0.92 | 0.15 | 1.30 | 0.10 | D, DG | |
| 109 | 22.19 | 0.02 | 0.40 | 0.03 | 0.82 | 0.03 | C, DG | |
| 110 | 23.09 | 0.04 | 0.47 | 0.06 | 0.84 | 0.06 | C, DG | |
| 111 | 24.64 | 0.09 | 0.45 | 0.12 | 1.08 | 0.12 | C | |
| 112 | 24.46 | 0.07 | 0.43 | 0.10 | 1.39 | 0.09 | C | |
| 113 | 23.84 | 0.04 | 0.05 | 0.22 | 0.08 | A | ||
| 114 | 24.02 | 0.07 | 0.04 | 0.09 | 0.36 | 0.12 | A*, DG | |
| 115 | —– | 23.00 | 0.03 | 1.13 | 0.05 | 2.26 | 0.03 | S |
| 116 | —– | 23.68 | 0.05 | 1.64 | 0.13 | 2.25 | 0.05 | S |
| 117 | —– | 20.90 | 0.01 | 1.29 | 0.01 | 1.75 | 0.01 | S |
| 118 | 23.63 | 0.05 | 0.05 | 0.09 | 0.09 | A, DG | ||
| 119 | —– | 23.34 | 0.03 | 1.19 | 0.07 | 1.30 | 0.04 | S |
| 120 | 24.02 | 0.07 | 0.04 | 0.08 | 0.40 | 0.10 | A* | |
| 121 | 22.82 | 0.02 | 0.03 | 0.16 | 0.04 | A | ||
| 122 | —– | 23.88 | 0.05 | 1.25 | 0.11 | 2.20 | 0.05 | S |
| 123 | 23.32 | 0.05 | 0.07 | 0.10 | A | |||
| 124 | 24.44 | 0.08 | 0.56 | 0.12 | 1.09 | 0.12 | C | |
| 125 | 24.61 | 0.10 | 0.57 | 0.14 | 1.12 | 0.12 | C | |
| 126 | 21.34 | 0.01 | 0.75 | 0.01 | 1.02 | 0.01 | C | |
| 127 | —– | 22.25 | 0.02 | 1.39 | 0.03 | 1.72 | 0.02 | S |
| 128 | 24.17 | 0.10 | 0.85 | 0.15 | 1.49 | 0.13 | D | |
| 129 | —– | 22.37 | 0.02 | 1.31 | 0.04 | 2.15 | 0.02 | S |
| 130 | 24.07 | 0.08 | 0.10 | 0.56 | 0.13 | A | ||
| 131 | 23.13 | 0.05 | 0.06 | 0.21 | 0.09 | A | ||
| 132 | —– | 22.28 | 0.02 | 1.29 | 0.04 | 2.35 | 0.02 | S |
| 133 | 25.04 | 0.14 | 0.59 | 0.20 | 0.97 | 0.19 | B | |
| 134 | 21.86 | 0.01 | 0.02 | 0.52 | 0.02 | A* | ||
| 135 | 23.11 | 0.04 | 0.04 | 0.09 | A | |||
| 136 | 24.33 | 0.10 | 0.30 | 0.15 | 0.31 | 0.17 | C | |
| 137 | 22.26 | 0.04 | 0.00 | 0.05 | 0.44 | 0.05 | A* | |
| 138 | 24.21 | 0.09 | 0.64 | 0.13 | 0.67 | 0.16 | C | |
| 139 | 24.89 | 0.12 | 0.63 | 0.16 | 1.10 | 0.15 | C |