Anisotropic inverse Compton scattering in powerful radio galaxies: the case of 3C 295
Inverse Compton (IC) scattering of nuclear photons with relativistic electrons in the lobes of powerful radio galaxies and quasars can give detectable extended X–ray emission from the radio lobes if relativistic electrons with a Lorentz factor are present (Brunetti, Setti, Comastri 1997). In general these electrons are not detected since they emit synchrotron radiation at frequencies below the radio band, so that the study of this effect provides a unique tool to measure the energy distribution of the electron population in the radio lobes at energies. In this paper we reanalyze the Chandra observation of the powerful and compact radio galaxy 3C 295 for which the IC scattering of nuclear photons is expected to be an important mechanism. We find strong evidence for extended and asymmetrical X–ray emission associated with the radio lobes in the energy band 0.1–2 keV. We show that both the luminosity and morphology of the extended X–ray emission associated with the radio lobes, not compatible with other X–ray mechanisms, can be best interpreted by the IC scattering with nuclear photons. We also show that the relativistic electron energy distribution obtained from the synchrotron radio emission can be extrapolated down to thus providing a first direct evidence on the electron spectrum in the lobes down to lower energies.
Key Words.:
Radiation mechanisms: non-thermal – Galaxies: active – Galaxies: individual: 3C 295 – Galaxies: magnetic fields – Radio continuum: galaxies – X-rays: galaxies1 Introduction
X-ray observations of samples of radio galaxies with past generation satellites have considerably increased our knowledge on their X–ray properties (e.g. Crawford & Fabian 1995, 1996; Canosa et al. 1999; Hardcastle & Worrall 1999; Worrall 1999; Sambruna, Eracleous & Mushotzky 1999; Capetti et al. 2000). Basically, on large scales the X–rays are dominated by thermal X–ray emission from the clusters in which radio sources are generally embedded, while thermal emission from hot coronae of the host galaxies and non–thermal emission from the nuclear/jet regions dominate the X–rays on the smaller scales. Due to the poor resolution of the X–ray observatories, the diffuse emission from the cluster hot gas made it difficult to study the extended X–rays from the lobes and hot spots of radio galaxies and quasars. As a consequence, only in a few cases IC fluxes from the radio hot spots (Harris, Carilli & Perley 1994) and lobes (Feigelson et al.1995; Kaneda et al.1996; Tsakiris et al.1996; Tashiro et al.1998; Brunetti et al.1999; Tashiro et al.2000) were detected.
The advent of Chandra will probably cause significant progress in the knowledge of radio galaxies and quasars as demonstrated by the promising first results on X–rays from jets and hot spots (Chartas et al. 2000; Harris et al. 2000; Schwarts et al. 2000; Wilson Young & Shopbell 2000,2001).
Due to the combination of high spatial resolution and sensitivity Chandra can also study in detail kpc scale diffuse X–ray emission originating from the lobes of radio galaxies and quasars where electrons can radiate via IC scattering of CMB photons (e.g. Harris & Grindlay 1979), and/or nuclear photons (Brunetti, Setti & Comastri 1997).
While the IC emission in the case of CMB seed photons is contributed by typically the less energetic part of the radio emitting electrons (Lorentz factor ), the X–rays from IC scattering of the nuclear far–IR/optical photons is mainly powered by electrons whose synchrotron emission typically falls in the undetected hundred kHz frequency range.
In the commonly accepted scenario, the relativistic plasma filling the lobes of FRIIs is believed to be released by the radio hot spots in which it is probably re–energized by shocks (e.g. Röser & Meisenheimer 1986). In general, the main requirement for the initial energy of the electrons in order to achieve an efficient reacceleration is (e.g. Bell 1978), but it depends on the assumed acceleration scenario (see Eilek & Hughes 1990 and ref. therein); this makes the measure of the relativistic electron spectrum at lower energies particularly useful to constrain the acceleration mechanisms in radio sources. Due to the surrounding emission from the radio lobes and synchrotron self absorption, low frequency radio observations of the hot spots are difficult. However, there are some evidences for synchrotron emission by electrons (Meisenheimer 1989; Carilli et al. 1991,1999). In addition, current models consider the hot spots to be over pressured with respect to the surrounding cocoon (e.g. Keiser & Alexander 1997), so that the relativistic plasma would adiabaticlly expand when it leaves the hot spot region (e.g. Carilli 1991). As a consequence, any low energy cut–off in the hot spots’ electron population would be further shifted to lower energies so that, in principle, the presence of electrons in the radio lobes cannot be ruled out.
In order to test the presence of these particles and to measure their energy distribution, observations of X–ray fluxes from IC scattering of nuclear photons are particularly useful. Due to the dilution of the nuclear photon flux with distance, the X–ray emission is expected to be more concentrated toward the innermost parts of the radio lobes at variance with the expected distribution of the X–rays from the standard IC scattering of CMB photons. Furthermore, due to the geometrical configuration, the IC scattering is anisotropic so that, if the radio axis of a symmetric double lobed radio galaxy is inclined with respect to the plane of the sky, the far lobe should appear more luminous than the near one (Brunetti et al. 1997). The X–ray spectra may provide important information; indeed, the presence of a low energy flattening of the electron distribution (or a cut–off) at energies results in a somewhat flatter spectrum than that extrapolated from higher energies (radio spectrum and/or from IC scattering of the CMB photons). Furthermore, in the case of a symmetric double lobed radio galaxy, the soft X–ray spectrum of the far lobe should appear slightly harder that that of the near one (Brunetti 2000).
Possible evidence for this emission has been found in the case of the powerful radio galaxy 3C 219 by a relatively deep ROSAT HRI observation corroborated by a combined ROSAT PSPC and ASCA spectral analysis (Brunetti et al. 1999)111During the preparation of the paper a possible evidence for IC scattering of nuclear photons has also been suggested by the Chandra observation of the high–z (z=1.78) radio galaxy 3C 294 (Fabian et al., 2001).
In this paper we reanalyze the Chandra observation of the powerful radio galaxy 3C 295 giving evidence for diffuse X–ray emission which supports the IC scattering of the photons from the hidden quasar.
km s-1 Mpc-1 and are assumed throughout; at the distance of the radio galaxy 1 arcsec corresponds to 6.9 kpc.
2 Target and Data analysis
The powerful radio source 3C 295 is identified with a giant elliptical (cD) galaxy at the center of a rich cluster (z=0.461). The radio image (Taylor & Perley 1991) shows a classical double lobed morphology with hot spots and a very high total radio power of erg Hz-1 at 178 MHz. The X-ray data obtained with previous instruments (Einstein Observatory: Henry & Henriksen 1986; ASCA: Mushotzky & Scharf 1997; ROSAT: Neumann 1999) permitted the study of only the cluster emission.
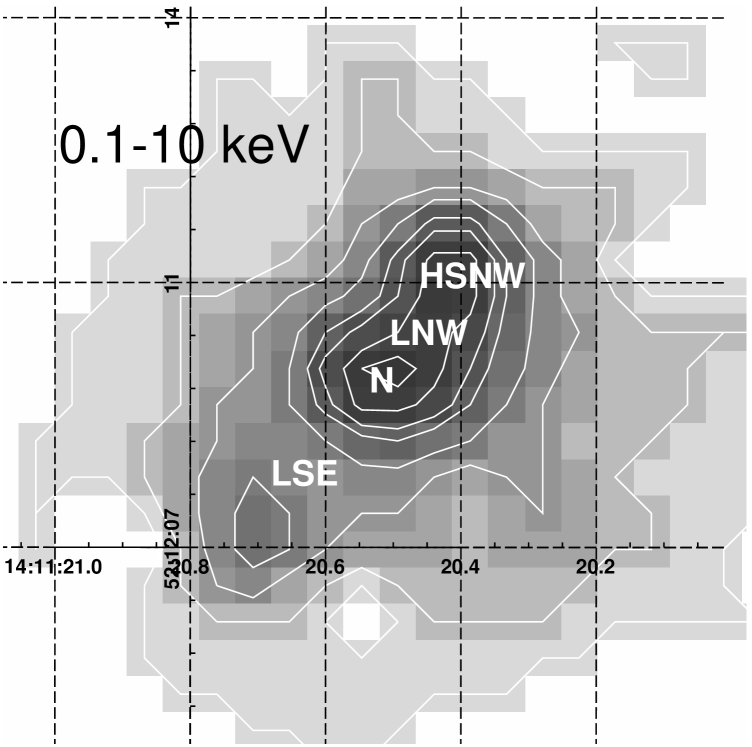
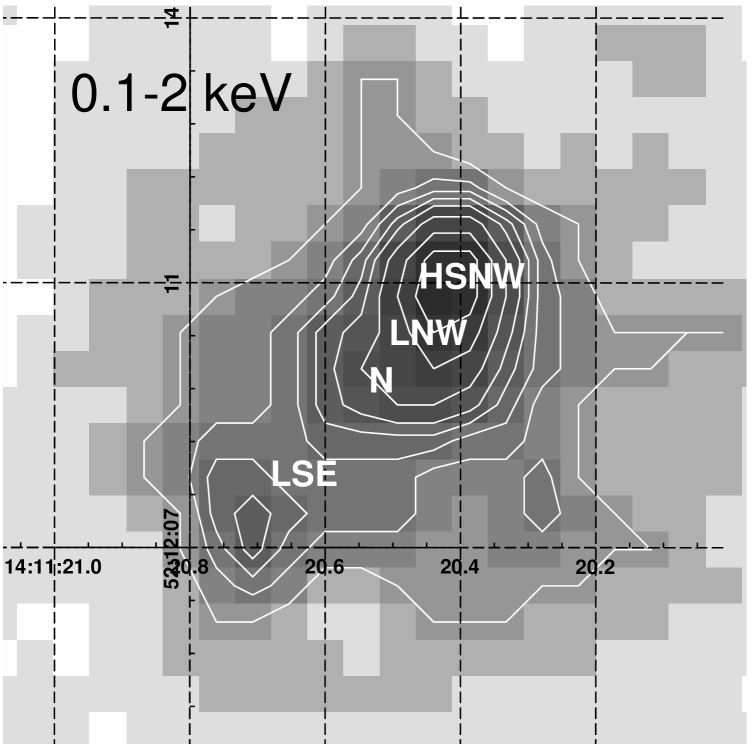
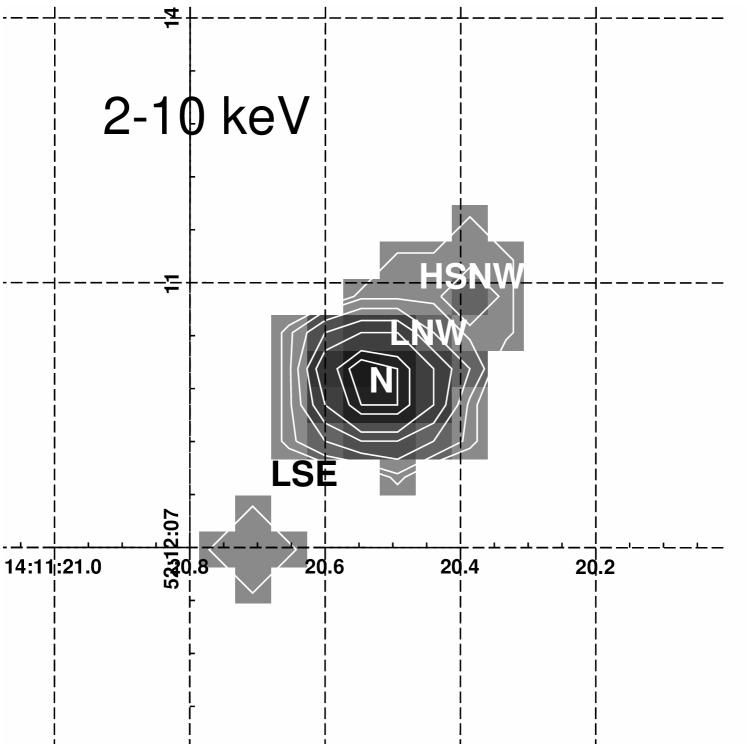
The calibration observation of 3C 295 was performed on 1999, August 30th for an elapsed time of 20 ks. The target was near the aim point on the S3 ACIS chip. The data were cleaned and analyzed using the Chandra Interactive Analysis of Observations (CIAO) software (release V1.1, Elvis et al. 2000, in preparation, see also http://asc.harvard.edu/cda/). The data were first filtered to include only the standard event grades 0,2,3,4 and 6, and energies between 0.1–10 keV. All hot pixels and bad columns were removed. Time intervals with large background rate (i.e. larger than over the quiescent state) were removed, yielding a screened exposure time of 18364 s. Images obtained between 0.1–10 keV, 0.1–2 keV and 2–10 keV are shown in Fig.1. These clearly show that the X–ray emission from 3C 295 consists of several components: a nuclear point source which shows up at energies 2 keV, diffuse cluster emission, diffuse lobe emission and clear hot spot emission (at least in the north–west lobe).
Details on the cluster and hot spot emission are given in Allen et al.(2000) and Harris et al.(2000), respectively. Hereinafter, reported errors correspond to intervals at 90 confidence level for one interesting parameter () unless specified otherwise.
2.1 The nuclear source
Harris et al.(2000) fitted the strong nuclear source with a power law model in the range 0.5–7 keV obtaining an inverted energy power law with a photon index and a luminosity of erg s-1 between 0.2–10 keV.
Stimulated by these results, since the nucleus of a radio galaxy is expected to be highly absorbed (Barthel 1989; Ueno et al. 1994), we attempted a fit of the nuclear spectrum by including an absorbed power law model. We did not restrict ourselves to 0.5–7 keV (if so confirming Harris et al.2000 results) but used all the data from 0.1–10 keV requiring counts/bin and 3. Fits have been performed by extracting circular regions centered on the source peak with 1 arcsec radius (see Fig.1) and with the ’background’ spectrum extracted from circular region close to the source accounting for the cluster emission. Fits with different extraction radii (e.g. in the range 0.5–1 arcsec) and different backgrounds gave similar results. The results are reported in Fig.2 while the main parameters from the fit are reported in Table 1.

| N | N | ||||||
|---|---|---|---|---|---|---|---|
| 1.34 (f) | 0.60.3 | – | 0.0 (f) | – | – | – | 24.0/13 |
| 1.34 (f) | 1.6 (f) | – | 11.97.3 | 3.62.0 | 4.5 (f) | 0.0 (f) | 9.7/10 |
| 1.34 (f) | 1.6 (f) | – | 6.2 | 1.9 (f) | 4.5 (f) | 0.0 (f) | 10.5/11 |
| 1.34 (f) | – | 5.0 (f) | 10.34.8 | 3.10.6 | 4.5 (f) | 0.0 (f) | 8.5/10 |
| 1.34 (f) | – | 5.0 (f) | 6.62.1 | 2.0 (f) | 4.5 (f) | 0.0 (f) | 10.4/11 |
a Equivalent hydrogen column density (units of cm-2)
fixed at Galactic value
b Photon spectral index of the scattered power law
c Temperature of the Raymond–Smith model (keV)
d Column density of the absorber ( cm-2)
e Photon spectral index of the absorbed power law
g Iron line energy (keV)
h Iron line width (eV)
i Total and degrees of freedom
The spectrum is well fitted by an absorbed power law model (which accounts for the hard emission) plus either a Raymond–Smith model ( keV) or an unabsorbed power law model () which accounts for the soft emission. The poor statistics do not allow us to discriminate between the Raymond–Smith and the second power law from the spectral analysis alone. The soft X–ray component could be due to an enhancement of the cluster thermal emission in the extracted region, to nuclear scattering from cold electrons in the vicinity of the AGN, or to the non–thermal IC scattering from the innermost lobes.
By leaving the photon index of the absorbed power law free to vary we obtain best values of and cm-2 (i.e. times the Galactic value) which correspond to a 0.1–10 keV deabsorbed luminosity of erg s-1. Nevertheless, the very steep photon index obtained in this fit might be due to the poor statistics at higher energies, so that we also attempted fits with an absorbed power law model of frozen photon index =1.9 and 2.0 obtaining equally good fits; in this case the fitted column density is cm-2 and the 0.1–10 keV luminosity reduces to erg s-1.
The presence of a powerful hidden AGN absorbed by a high column density is further corroborated by the marginal detection of an iron line in the nuclear spectrum (Fig.2) centered in the range 4.3–4.6 keV (rest frame 6.3–6.7 keV) with EW = eV.
In order to avoid possible statistical biases due to the adopted binning procedure we have also analyzed the nuclear spectrum with an unbinned fitting procedure. A statistical test that does not require binning entails minimizing the ’C-statistics’ (Cash 1979; see also Weaver 1993). This statistics cannot be applied to background–subtracted data, thus to fit the nuclear data we use a model consisting of the source plus the ’background’ as obtained in the previous fits. The source is modeled with a power law (with a frozen photon index absorbed at the Galactic value) plus an absorbed power law (with and free to vary). The unbinned fitting procedure gives results fully consistent with those from the binned procedure confirming the presence of absorption excess (cm-2).
2.2 The diffuse X–ray emission from the radio lobes
Both the 0.1–10 keV and 2–10 keV images (Fig.1) are dominated by the strong central source, this combined with the presence of the luminous northern X–ray hot spot at arcsec distance makes problematic the analysis of possible diffuse emission associated with the radio lobes.
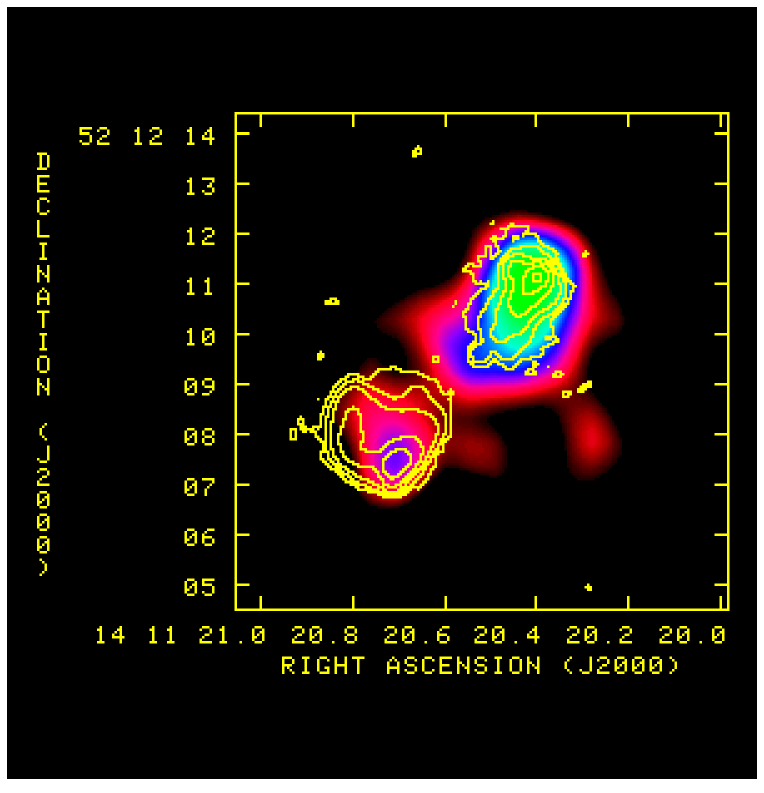
As discussed above the nuclear source is absorbed at low energies and does not significantly contribute to the X–ray emission in the 0.1–2 keV band. The 0.1–2 keV image of the central part of the cluster is shown in Fig.1. Diffuse X–ray emission with a double lobed structure exceeding the cluster is clearly detected. Although the brightness of the X–ray lobes is from 1.5 to 5 times larger than that of the surrounding cluster, a subtraction of the cluster emission leads to a better quantitative estimate. We first performed a number of fits of the cluster brightness profile using a –model and excluding a circular region of radius 2–3 arcsec centered on the nucleus of 3C 295. Both the 0.1–2 keV and 0.1–10 keV unsmoothed images have been used in the fitting procedure. The X–ray distribution is fitted in different azimuthal angle range: in two quadrants of 90o opening angle in the direction perpendicular to the radio axis, in the direction of the radio axis and over 0–360o. We have subtracted the best fitted –model (with core radius 4.0 arcsec and ) from the 0.1–2 keV total unsmoothed image. The result is shown in Fig.3 where the X–ray brightness distribution is superimposed on the 8 GHz VLA radio image with a resolution of 0.25 arcsec (kindly provided by Taylor & Perley). Different –models (with core radius between 4.0–4.4 arcsec and , consistent with the range of parameters from Neumann 1999 and Harris et al.2000) gave similar results to within .
The resulting morphology of the diffuse X–ray emission (Fig.3) is double lobed with the X–rays coincident with the radio lobes, thus a non–thermal mechanism is by far the most likely to apply. Furthermore, both recent and past X–ray observations of radio sources in clusters have not revealed thermal X–ray excesses in coincidence with the radio lobes and jets, but rather deficits (Carilli, Perley, Harris 1994; Fabian et al. 2000; McNamara et al. 2000). Moreover, at variance with our findings, heating of the intergalactic medium by the cocoon of the radio galaxies would basically produce edge–brightened X–ray emission (e.g. Kaiser & Alexander 1999). Based on these considerations in the following section we investigate only non–thermal mechanisms as the source of the diffuse X–rays from the radio lobes.
The northern lobe in Fig.3 appears to be slightly more extended than the radio brightness distribution. In some regions, this is not only caused by the larger Chandra PSF but it could be a real effect tracing the presence of lower brightness radio extension not visible at 8 GHz, but detected in 1.4 GHz radio images (see Harris et al.2000 Fig.1, and ref. therein). The X–ray emission associated with the northern lobe in Fig.3 is extended also in the direction perpendicular to the radio axis. In the distance range 0–1.5 arcsec from the nucleus we measure net counts between 0.5–1 arcsec from the radio axis, whereas a narrow beam along the radio axis would give net counts (if normalized to the observed counts between 0–0.5 arcsec). From this analysis we find that the intrinsic width of the northern X–ray lobe is arcsec when averaged over a radial distance of 0 to 1.5 arcsec.
We notice that the resulting X–ray emission is very asymmetrical with the northern lobe being the most luminous.
In order to better quantify the asymmetry of the diffuse X–ray flux associated with the radio lobes we have subtracted the luminous northern hot spot from the unsmoothed 0.1–2 keV image by adopting either an unresolved source model (PSF), or slightly resolved models resulting from the convolution of optically thin spherical hot spots with 0.2-0.4 arcsec diameter with the PSF; the result is reported in Fig.4. We measure net cts between 0.1–2 keV in excess of the residual ’background’ and coincident with the radio lobes. This depends on the details of the northern hot spot subtraction, 240 cts corresponding to no subtraction, 150 cts to the subtraction of a 0.4 arcsec hot spot (i.e., the hot spot would account for up to 90 net counts in the 0.1–2 keV band). Furthermore, we find that the ratio between the 0.1–2 keV net cts associated with the two radio lobes is and in the case of maximum hot spot subtraction and no hot spot subtraction, respectively. If a fraction of the X–rays coincident with the southern lobe is contributed by the SSC process from the hot spot (Harris et al.2000) the ratio between the X–ray fluxes from the northern and the southern lobes would be further increased. After subtraction of the northern hot spot and of the total X–ray flux coincident with the position of the southern radio hot spot such a ratio becomes ; in the following we consider this as the upper value of the X–ray asymmetry.
To obtain spectral constraints of the diffuse X–rays from the lobes, we considered a region of 11 arcsec2 coincident with the radio lobes (i.e. 44 px, 1 px=0.50.5 arcsec). We fitted the spectrum with a simple power law model (Galactic absorption) by excluding a circular region of 0.5 arcsec radius centered on the northern hot spot; the ’background’ spectrum was extracted from cluster regions close to the radio source. The resulting photon index is ; we also stress that the fitted spectrum would steepen if is allowed to be larger than the Galactic value. The corresponding 0.1–10 keV luminosity is erg s-1 (the lower corresponding to ).
The radial profile of the diffuse X–rays coincident with the radio lobes is difficult to determine due to the small extension of the lobes ( arcsec) and to the presence of the northern hot spot. We have measured the counts on the 0.1-2 keV image in two regions of the northern lobe of 0.75 arcsec2 (3 pixels) at a radial distance from the nucleus of 0–0.5 arcsec and 1–1.5 arcsec respectively. We obtain a brightness ratio between the 1–1.5 and 0–0.5 region in the range 0.7–1.6 depending on the hot spot subtraction (1.6 corresponding to no subtraction). We conclude that the diffuse X–rays in excess of the northern hot spot emission have a rather flat brightness distribution between 0–1.5 arcsec from the nucleus; this may further help us in the explaining of the origin of the emission (Sect. 3.2).
3 The IC scenario
3.1 Photon energy densities
The spectral study of the nuclear emission (Sect. 2.1) strongly supports the presence of a highly absorbed powerful quasar in the nucleus of 3C 295 with a luminosity of erg s-1 in the 0.1–10 keV band.
By assuming quasar spectral energy distributions (SEDs) one has that the far–IR to optical luminosity is typically times larger than the soft X–ray luminosity with the flat spectrum radio loud quasars having the lower far–IR/X–ray ratio (Sanders et al.1989; Elvis 1994). While recent studies have shown that the far–IR photons in quasars are almost certainly due to dust emission (Haas, Chini and Kreysa 1998; van Bemmel, Barthel and Yun 1999), combined radio and X–ray studies have revealed the existence of a beamed plus an isotropic (or quasi isotropic) X–ray component in radio loud quasars (Brinkmann, Yuan and Siebert (1997) and ref. therein). In the case of 3C 295 the X–ray beamed component is suppressed by transverse Doppler boosting and we are essentially measuring the (quasi)isotropic X–ray emission. Therefore we adopt a ratio (more typical of steep spectrum radio loud and radio quiet quasars) and estimate a far–IR/optical luminosity of the hidden quasar erg s-1.
Since 3C 295 is a relatively compact radio source with a total extension of kpc, the energy density due to the nuclear photons is expected to be important over all the radio volume; it is:
| (1) |
being the far–IR/optical luminosity in units of erg s-1, the distance from the nucleus in kpc.
The high brightness of the radio lobes suggests that synchrotron–self–Compton (SSC) could be an important mechanism to produce X–rays. Indeed, Harris et al. (2000) suggested that a large fraction, if not all, of the X–ray source coincident with the northern hot spot of 3C 295 is powered by such a mechanism.

By assuming an axial symmetry of the emitting regions, we have obtained the synchrotron energy density in the northern radio lobe along the direction of the radio axis using the VLA radio image of Fig.3. The results are reported in Fig.5 together with the quasar photon energy density (Eq.1) and with the CMB energy density. We find that the energy density of the nuclear photons dominates the synchrotron and CMB up to the hot spot region ( arcsec, or kpc from the nucleus), while the synchrotron energy density dominates the CMB one for arcsec (i.e. kpc). As a consequence, the extended X–ray emission detected between 5–10 kpc from the nucleus is likely to be powered by the IC scattering of far–IR/optical quasar photons. This conclusion is further reinforced by the considerations developed in the following sub–section.
3.2 X–ray brightness asymmetry and geometry
As already stated in Sect. 2.2 the extended X–ray emission associated with the radio lobes is asymmetrical, the integrated X–ray flux from the northern lobe being a factor larger than that from the southern one. At radio wavelengths (Fig.3) the northern lobe appears more compact and closer to the nucleus than the southern one, while the radio luminosity of the two lobes is similar. The comparison between radio and X–ray morphologies can be used to rule out non–thermal mechanisms different from the IC scattering of nuclear photons as the main source of the diffuse X–rays.
Indeed, by assuming the same constant ratio between magnetic and electron energy densities in the two lobes, we calculate that the X–ray flux produced by IC scattering of CMB photons in the southern lobe is expected to be slightly larger than that in the northern lobe, at odds with the Chandra results. If nuclear photons were not involved, yet IC scattering was the cause of X–rays, then the lobe asymmetry could only be reproduced by the ad hoc assumption that the ratio between electron and magnetic energy densities in the northern lobe is from 20 to 80 times larger than that in the southern one (for an X–ray ratio 2 to 4 respectively).
It is interesting to notice that the SSC mechanism, although unimportant for large scale emission as previously shown, is likewise ruled out by the observed distribution of the X–ray brightness . From the standard SSC and synchrotron formulae (Gould 1979) one roughly finds that, by assuming a constant ratio between relativistic electrons and magnetic field energy densities,
| (2) |
where is the radio brightness (Fig.3), the thickness of the radio emitting volume along the line of sight and the relativistic electron spectral index. By assuming axial symmetry and it follows that should increase by a factor between 0–0.5 and 1–1.5 arcsec distance from the nucleus, at odds with the rather flat observed distribution. To be consistent with the data one would have to assume that the ratio of the energy densities in relativistic electrons to that in the magnetic field varies by a factor going from the outer to the inner regions mentioned above.
On the contrary, as already anticipated in the Introduction, the X–ray lobe asymmetry is a natural consequence of the IC scattering of nuclear photons. As it is well known, in the IC process a relativistic electron scatters the incoming photons in a narrow cone about its instantaneous velocity vector and the highest energies of the scattered photons are obtained in the head–on scatterings. Since in the radio lobes the momenta of the relativistic electrons are assumed to be isotropically distributed, it follows that at any given energy of the scattered photons there will be many more scattering events when the electrons move toward the nucleus, i.e. the direction of the incoming photons, than when they are moving away: the resulting IC emission will be enhanced towards the nucleus and essentially absent in the opposite direction. As a consequence, if the radio axis does not lie on the plane of the sky, the smaller the angle between the axis and the line of sight, the greater will be the difference in IC emission from two identical lobes (see Figs. A2–A4).
4 The Model
We have applied the anisotropic IC scattering equations reported in the Appendix to 3C 295. The main ingredients of the model are as follows:
a) Geometry of the radio lobes. We have assumed that the radio volume is symmetrical about the line joining the mid–points of the weakest radio isophote (Fig.3) at each fixed distance from the nucleus and that the ratio between the energy densities in relativistic electrons and magnetic fields is constant.
b) Spectrum of the relativistic electrons. As a starting point for the model it can be constrained by the radio observations. At low radio frequencies the spectrum of 3C 295 is dominated by the emission from the radio lobes, while the emission from the hot spots contaminates the lobe spectrum at higher frequencies, contributing of the total flux at 5 GHz. The total radio spectrum is relatively steep (; ) between 1.4 GHz (Kuhr et al.1981) and 5 GHz (Gregory & Condon 1991), but it flattens at lower frequencies () between 178 and 1400 MHz (Kuhr et al.1981). Such a spectral trend may indicate the presence of a radiative break in the energy distribution of the relativistic electrons. We find that the spectrum can be reproduced by a continuous injection model (e.g. Kardashev 1962). We obtain a break frequency = 0.5–1 GHz and an injection spectral index of the electrons (). This scenario is consistent with the radio, optical and X–ray data of the northern hot spot of 3C 295 (Harris et al.2000) which are well accounted for by the combined synchrotron and SSC processes under the assumption of an electron injection index (Brunetti 2001). Here it should be noticed that the adiabatic expansion, suffered by the electrons moving from the hot spot region to the lobes, would shift the energy of the electrons required to emit the observed optical emission of the hot spot via the SSC process from to 200 (i.e., expanding by a factor 3). These resulting low energies are those required to upscatter the quasar far–IR photons into the X–ray band.
c) Radiation pattern and luminosity of the nuclear source. According to the unification scheme (Barthel 1989; Pier & Krolik 1992) we assume that the far–IR/optical photons are isotropically emitted within two opposite cones of half opening angle and with the axis coincident with the radio axis. Almost all the volume occupied by the radio lobes, as defined by the radio contours (Fig.3), are contained within these cones. The corresponding isotropic luminosity of the hidden quasar is erg s-1 as estimated in Sect. 3.1 by assuming the SED of Sanders et al.(1989).
The additional effect due to the far–IR/optical beamed radiation emitted by the nucleus is not considered in the calculation. However, as discussed in Brunetti et al.(1999), the beamed radiation intercepts only a small fraction of the lobes () so that, in general, it would not contribute more than 10-20 to the IC scattered X–ray luminosity. The low photon statistics do not allow a precise mapping of the X–ray distribution in the lobes. However, from the analysis reported in Sect. 2.2 we derive a rough lower limit, , to the total angular distribution (referred to the central source) of the X–rays in the northern lobe by simply dividing the lower limit to the extension perpendicular to the radio axis by the extension of the X–ray lobe along the radio axis. This also provides direct observational evidence that beamed nuclear radiation () does not represent an important source of IC X–rays from 3C 295.
The only free parameter of the model is the inclination of the radio axis on the plane of the sky (Fig.A1).
With the previous assumptions we obtain the following results :

1) Reproducing the X–ray asymmetry of the lobes. If the radio galaxy lies on the plane of the sky, the implied X–ray ratio between the two radio lobes would be 1.3, mostly due to the fact that the northern lobe is closer to the emitting nucleus. In order to reproduce the observed interval for the ratio of X–ray lobes, a range of between 6 and 13o (68% confidence level) is required by the model. The northern lobe would be further away from us so that its X–ray brightness is enhanced by predominant back scatterings. This moderate inclination is consistent with the absence of a clear radio jet in the radio images of 3C 295 published in the literature (Taylor & Perley 1991,92; Akujor et al.1994). However, a faint radio jet has been recently discovered in the southern lobe by a deep MERLIN observation (P.Leahy, private communication) thus providing independent confirmation that this lobe is the near one as required by the model.
As shown in Fig.6 this result does not depend on the assumed value of since for the allowed interval of is well established and stable in the range 5–15o (68% confidence level).
Furthermore, we find that almost independently from the assumptions on the nuclear emitting pattern, the expected trend in X–ray brightness between 0–0.5 and 1–1.5 arcsec from the nucleus in the northern lobe is rather flat, which is again consistent with the observations.

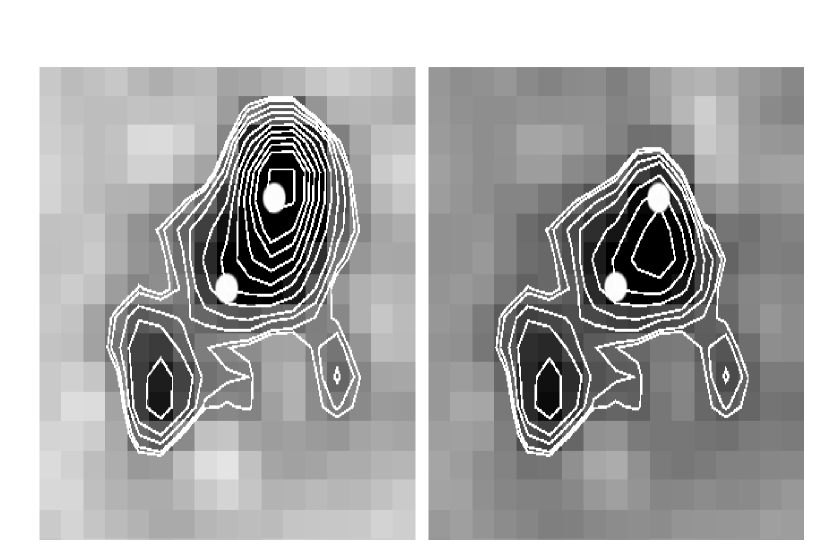
2) Constraining the low energy spectrum of the relativistic electrons. In addition to the information on the spectrum of the relativistic electrons at higher energies as obtained by radio observations, the spectrum of electrons can be constrained by comparing the model predictions with the Chandra data. In particular, the presence of a possible low energy cut–off () can be tested. As an illustrative example, in Fig.7 we report the IC spectra due to the anisotropic IC scattering of nuclear photons, by assuming the quasar SED given by Sanders et al.(1989), as a function of the low energy cut–off. The curves are drawn for two values of the scattering angle (see Fig.A1): and (back scattering case); since the typical electron energy involved in up–scattering the photon energy from to is , the back scattering case is more sensitive to the presence of a low energy break in the electron spectrum. We remark that the IC spectra are sensitive to the shape of the assumed SED, so that the presence of a low energy cut–off in the electron energy distribution is less evident in the case of a redder SED such as, for instance, that of 3C 48 (reported in Haas et al.1998).

In Fig.8 we report the model 0.5–2 keV spectral index as a function of the low energy cut–off in the electron spectrum by assuming both Sanders (1989) and 3C 48 SEDs. By comparing the theoretical results with the limits given by the Chandra data we obtain an upper limit to . For the sake of completeness in the same figure we also show that this result is essentially independent, as it should be, from the precise values assigned to , and . Likewise, the asymmetry discussed in point 1) above does not significantly depend on .
3) Constraining the energetics of the radio lobes. The IC scattering of the nuclear photons can be further used to test the the minimum energy condition in the radio lobes once the quasar luminosity is fixed. By matching the expected IC flux from the radio lobes with the Chandra 0.1–10 keV flux from the lobes after the subtraction of the hot spot contribution ( in Sect. 2.2) we obtain:
| (3) |
where is the magnetic field intensity necessary to account for the X-ray flux, (G) is the equipartition field derived by taking into account the presence of low energy relativistic particles () not revealed by the synchrotron radio emission (e.g. Brunetti et al.1997), is the ratio between the IC luminosity as a function of and that with no low energy cut-off in the electron spectrum and is the ratio between the energy densities of the protons and of the electrons.
Eq.(3) is reported in Fig.9 for the representative values and , and for two values of the hidden quasar luminosity. With and erg s-1 one finds that the magnetic field estimated by the IC model is within a factor from the value calculated under minimum energy assumption.

We wish to stress that while the results discussed in 1) and 2) above are essentially independent from the precise value of , this obviously does not apply to the conclusions reached in 3). A smaller value of implies that the quasar radiation cone intercepts only a fraction of the radio lobe volume and to match the observed extended X-ray flux one would have to assume either a more powerful quasar or a larger number of relativistic electrons (bringing the radio lobes very much out of equipartition) or both. The size of this effect is shown in Fig.10. One derives that with a change of from 40o (adopted in our model) to 30o does not significantly affect our conclusions; instead, the adoption of a value close to the lower limit of 15o would increase the energy requirements (hidden quasar luminosity and/or electron number density) by one order of magnitude. For completeness in Fig.10 we have also drawn the curve for = 5o, representative of the beamed radiation cone of blazar type objects, showing that the energy requirements are increased by about two orders of magnitude. Although not relevant for the present discussion about 3C 295, the expected contribution of beamed radiation to the X-ray brightness via the anisotropic IC scattering may be detected by Chandra observations of well resolved powerful radio galaxies.

5 Discussion and conclusions
In this paper we have re–analyzed the Chandra observation of the powerful radio galaxy 3C 295 in order to study the extended X–ray emission associated with the radio lobes.
We show that the 0.1–2 keV image is not affected by the strongly absorbed (cm-2) nuclear source and presents extended emission with a double lobed structure, the northern lobe being a factor 2–4 stronger than the southern one, strongly correlated with the morphology of the radio lobes, so that a non–thermal origin of the X–rays is by far the most favoured.
We have examined different non–thermal scenarios including SSC, IC scattering of CMB photons and of photons emitted by a powerful hidden quasar. The energy density due to the nuclear photons largely dominates (10–200 times) that due to CMB and synchrotron photons in the regions where extended X–ray emission is detected, while the energy density due to synchrotron photons outweighs the other contributions in the northern hot spot region where, indeed, a powerful compact X–ray source is detected.
By assuming an average constant ratio between the relativistic electron and magnetic field energy densities in the radio lobes, we show that the X–ray lobe asymmetry and surface brightness can only be accounted for by the IC scattering of the nuclear photons confirming the general model originally proposed by Brunetti et al.(1997). A recent detection of a weak radio jet pointing toward the southern lobe (Leahy, private com.) provides additional observational evidence that the northern lobe is the farthest as required by our model.
Finally, we have applied the model to constrain the electron spectrum and energetics in the lobes of 3C 295. The main results are as follows:
– The X–ray flux ratio between the northern and southern lobes can be accounted for by supposing that the main radio axis of the source is slightly inclined ( deg) with respect to the plane of the sky. This result is fairly independent on the assumptions on the nuclear emitting pattern.
– By adopting the power law energy distribution of the relativistic electrons derived from the low frequency synchrotron radio emission, we can set an upper limit on the possible presence of a low energy cut–off . This is because the soft X–rays are mainly produced by the up–scattering of the nuclear IR photons with electrons of energy , much lower than that producing the radio emission by the synchrotron process ( ), so that the computed spectra are sensitive to the location of . By comparing the soft X-ray spectra (0.15-3 keV in the source frame) obtained from the anisotropic IC scattering with the observational bounds imposed by the Chandra observation we find , reaching the interesting conclusion that the power law electron spectrum defined by the radio emission can be extrapolated downward in energy by at least two orders of magnitude.
– The average magnetic field intensity required to fully account for the lobe X-ray emission depends on the hidden quasar far–IR/optical luminosity , on the location of the low energy cut-off and the ratio () between relativistic protons and electrons. With and , we find that is a factor 1.2–3.5 smaller than the equipartition value (obtained by taking into account the low energy particles) for erg s-1 (note that the value 3.5 is calculated for ). Therefore it may very well be that in this source (implying a reasonable value erg s-1) 222 After this paper was revised, ISOPHOT measurements of dust emission from 3C 295 have been published by Meisenheimer et al.(2001). The 5–100 isotropic luminosity derived from the published fluxes is erg s-1 (, ) pointing to the higher values of the quasar bolometric luminosity adopted in our model and to the existence of equipartition condition in the lobes..
Here, for comparison, it should be stressed that in order to match the diffuse X–ray flux, either the SSC process and the IC scattering of CMB photons would require an electron number density (and energetics) about 200 times larger than the equipartition value.
Moderate deviations from equipartition within a factor of in magnetic field intensity () have been suggested in the case of radio galaxies much more extended than 3C 295 (e.g. Cen B, Tashiro et al.1998; 3C 219, Brunetti et al. 1999; Fornax A, Tashiro et al.2000) so that one might speculate that a moderate particle dominance could be linked to the time evolution of the radio galaxies, a condition recently invoked by Blundell & Rawlings (2000) to match dynamical and radiative ages in radio sources. Of course, this scenario cannot be tested by present X–ray studies but only by the future Chandra and XMM–Newton observations.
Acknowledgements.
We thank G.B. Taylor and R.A. Perley for providing the VLA radio image of 3C 295 in Fig.3 and A. Comastri for useful discussions. We warmly thank J.P. Leahy who communicate to us his discovery of a faint radio jet in the southern lobe of 3C 295 during the preparation of this paper. We also acknowledge the anonymous referee whose comments have improved the presentation of the paper. This work was partly supported by the Italian Ministry for University and Research (MURST) under grant Cofin98-02-32, and by the Italian Space Agency (ASI).Appendix A Spatial asymmetries from anisotropic IC scattering

By making use of semi–analytic anisotropic inverse Compton formulae, in this Appendix we give a general formalism to calculate the ratio between the X-ray intensities from the two lobes.
The general anisotropic IC emissivity per unit solid angle of incoming photons () scattered into an angle , is derived in Brunetti (2000). Here we consider the ultra–relativistic limit (i.e. ) of the equations derived for an isotropic electron momentum distribution, , in the Thompson case, i.e. :
| (4) |
where is a constant, is the incoming photon number density,
| (5) |
and . In the case of a simple power law energy distribution Eq.(4) approaches and the ratio between the emissivities at different does not depend on . However, in general the energy distribution of the relativistic electrons undergoing re–acceleration processes, radiative, adiabatic and Coulomb losses differs from a simple power law so that such a ratio can depend on the observing frequency and on .
The IC luminosity per unit solid angle from the volume is :
| (6) |
In our model the radio lobes are illuminated by the nuclear source, so that ; takes into account the pattern of the emitted nuclear photons. From Eqs.(4) and (6) the luminosity from a given radio volume is:
| (7) |
with a constant.


Once the electron energy distribution is given, Eq.(7) yields a general formalism to calculate anisotropic IC emissions per unit solid angle and at a given frequency.
To simplify the scenario in the case of the radio sources, we approximate the radio volume with a prolate ellipsoid of major and minor semiaxis and respectively (Fig.A1) and consider an uniform electron energy distribution. From Eq.(7) one obtains the IC luminosity from one lobe:
| (8) |
where the integral in is performed in the interval , while the extremes and are 0 or and or in the case of the near and far lobe respectively (Fig.A1); is a constant. The functions in Eq.(8) are:
| (9) |
| (10) |
| (11) |
In the simple case of an uniformly emitting cone pattern of half opening angle , one has:
| (12) |
where the boundary is defined as:
| (13) |

In Fig.A2 we report the ratio between far and near lobe X–ray luminosities as a function of and for different opening angles () of the quasar emitting cone : larger give in general larger X–ray ratios ( deg). As a consequence, in the case of radio galaxies, the IC scattering of the wide–angle nuclear radiation emitted by the dusty torus, disk and broad line region, produces a larger brightness asymmetry than the IC scattering of the beamed nuclear radiation.
The effects on such ratio due to the presence of a break energy in the electron energy distribution is reported in Figs.A3 and A4.
In the case , one has so that the ratio between two emitting volumes is independent on and the integrals in Eqs.(8) simplify. For each lobe one has:
| (14) |
the extremes of the integrals are given by Eq.(13); a constant.
References
- (1) Allen S.W., et al. 2000, MNRAS, submitted
- (2) Akujor C.E., Luedke E., Browne I.W.A., et al., 1994, A&AS 105, 247
- (3) Barthel P. D., 1989, ApJ 336, 606
- (4) Bell A.R., 1978, MNRAS 182, 147
- (5) Blundell K.M., Rawlings S., 2000, AJ 119, 1111
- (6) Brinkmann W., Yuan W., Siebert J., 1997, A&A 319, 413
- (7) Brunetti G., 2000, APh 13, 105
- (8) Brunetti G., 2001, in ”Particles and Fields in Radio Galaxies”, R.A.Laing and K.M.Blundell (Eds.), ASP Conf. Series, in press
- (9) Brunetti G., Setti G., Comastri A., 1997, A&A 325, 898
- (10) Brunetti G., Comastri A., Setti G., Feretti L., 1999, A&A 342, 57
- (11) Canosa C.M., Worrall D.M., Hardcastle M.J., Birkinshaw M., 1999, MNRAS 310, 30
- (12) Capetti A., Trussoni E., Celotti A., Feretti L., Chiaberge M., 2000, MNRAS 318, 493
- (13) Carilli C.L., Perley R.A., Dreher J.W., Leahy J.P., 1991, ApJ 383, 554
- (14) Carilli C.L., Perley R.A., Harris D.E., 1994, MNRAS 270, 173
- (15) Carilli C.L., Kurk J.D., van der Werf P.P., Perley R.A., Miley G.K., 1999, AJ 118, 2581
- (16) Cash W., 1979, ApJ 228, 939
- (17) Chartas G., Worrall D.M., Birkinshaw M., et al. 2000, ApJ 542, 655
- (18) Crawford C.S., Fabian A.C., 1995, MNRAS 273, 827
- (19) Crawford C.S., Fabian A.C., 1996, MNRAS 282, 1483
- (20) Eilek J.A., Hughes P., 1990, in ’Astrophysical Jets’, ed. Hughes P., Cambridge Univ. Press, 428
- (21) Elvis M., Wilkes B.J., McDowell J.C., et al., ApJS 95, 1
- (22) Fabian A.C., Sanders J.S., Ettori S., et al. 2000, MNRAS 318, L65
- (23) Fabian A.C., Crawford C.S., Ettori S., Sanders J.S., 2001, MNRAS in press; astro-ph/0101478.
- (24) Feigelson E.D., Laurent-Muehleisen S.A., Kollgaard R.I., Fomalont E.B., 1995, ApJ 449, L149
- (25) Gould R.J., 1979, A&A 76, 306
- (26) Gregory P.C., Condon J.J., 1991, ApJS 75, 1011
- (27) Haas M., Chini R., Meisenheimer K., et al., 1998, ApJ 503, L109
- (28) Hardcastle M.J., Worrall D.M., 1999, MNRAS 309, 969
- (29) Harris D.E., Grindlay J.E., 1979, MNRAS 188, 25
- (30) Harris D.E., Nulsen P.E.J., Ponman T.J., et al., 2000, ApJ 530, L81
- (31) Henry J.P., Henriksen M.J., 1986, ApJ 301, 689
- (32) Kaiser C.R., Alexander P., 1997, MNRAS 286, 215
- (33) Kaiser C.R., Alexander P., 1999, MNRAS 305, 707
- (34) Kaneda H., Tashiro M., Ikebe Y., et al., 1995, ApJ 453, L13
- (35) Kuhr H., Witzel A., Pauliny-Toth I.I.K., Nauber U., 1981, ApJS 45, 367
- (36) McNamara B.R., Wise M., Nulsen P.E.J., et al. 2000, ApJ 534, L135
- (37) Meisenheimer K., Roser H.-J., Hiltner P.R., et al., 1989, A&A 219, 63
- (38) Meisenheimer K., Haas M., Müller S.A.H., Chini R., Klaas U., Lemke D., 2001, A&A in press; astro-ph/0102333
- (39) Mushotzky R.F., Scharf C.A., 1997, ApJ 428, L13
- (40) Neumann D.M., 1999, ApJ 520, 87
- (41) Pier E.A., Krolik J.H., 1992, ApJ 401, 99
- (42) Röser H.-J., Meisenheimer K., 1986, A&A 154, 15
- (43) Sanders D.B., Phinney E.S., Neugebauer G., Soifer B.T., Matthews K., 1989, ApJ 347, 29
- (44) Sambruna R.M., Eracleous M., Mushotzky R.F., 1999, ApJ 526, 60
- (45) Schwartz D.A., Marshall H.L., Lovell J.E., et al. 2000, ApJ 540, 69L
- (46) Taylor G.B., Perley R.A., 1991, AJ 101, 1623
- (47) Taylor G.B., Perley R.A., 1992, A&A 262, 417
- (48) Tashiro M., Kaneda H., Makishima N., et al., 1998, ApJ 499, 713
- (49) Tashiro M., Makishima N., Iyomoto N., Isobe N., Kaneda H., 2000, ApJ L, in press; astro-ph/0010503
- (50) Tsakiris D., Leahy J.P., Strom R.G., Barber C.R., 1996, IAUS 175, 256
- (51) van Bemmel I.M., Barthel P.D., Yun M.S., 1998, A&A 334, 799
- (52) Ueno S., Koyama K., Nishida M., Yamauchi S., Ward M.J., 1994, ApJ 431, L1
- (53) Weaver K.A., 1993, PhD Thesis
- (54) Wilson A.S., Young A.J., Shopbell P.L., 2000 ApJ L in press; astro-ph/0009308
- (55) Wilson A.S., Young A.J., Shopbell P.L., 2001, ApJ 546 in press; astro-ph/0008467
- (56) Worrall D.M., 1999, in ‘Life Cycles of Radio Galaxies’ eds. J.Biretta et al., New Astronomy Reviews in press; astro-ph/9911056