F stars, metallicity, and the ages of red galaxies at
Abstract
We explore whether the rest-frame near-ultraviolet spectral region, observable in high-redshift galaxies via optical spectroscopy, contains sufficient information to allow the degeneracy between age and metallicity to be lifted. We do this by first testing the ability of evolutionary synthesis models to reclaim the correct metallicity when fitted to the near-ultraviolet spectra of F stars of known (sub-solar and super-solar) metallicity. F stars are of particular interest because the rest-frame near-ultraviolet spectra of the oldest known elliptical galaxies at appear to be dominated by F stars near to the main-sequence turnoff.
We find that, in the case of the F stars, where the HST ultraviolet spectra have high signal:noise, model-fitting with metallicity allowed to vary as a free parameter is rather successful at deriving the correct metallicity. As a result, the estimated turnoff ages of these stars yielded by the model fitting are well constrained. Encouraged by this we have fitted these same variable-metallicity models to the deep, optical spectra of the mJy radio galaxies 53W091 and 53W069 obtained with the Keck telescope. While the age and metallicity are not so easily constrained for these galaxies, we find that even when metallicity is allowed as a free parameter, the best estimates of their ages are still 3 Gyr, with ages younger than 2 Gyr now strongly excluded. Furthermore, we find that a search of the entire parameter space of metallicity and star formation history using MOPED leads to the same conclusion. Our results therefore continue to argue strongly against an Einstein-de Sitter universe, and favour a -dominated universe in which star formation in at least these particular elliptical galaxies was completed somewhere in the redshift range .
keywords:
galaxies: evolution – galaxies: stellar content – ultraviolet: galaxies – ultraviolet: stars1 Introduction
Deep optical spectroscopy with -metre class telescopes can overcome many of the problems associated with estimating the ages of high-redshift galaxies from cruder broad-band data. In particular, as demonstrated by Dunlop et al. (1996), Spinrad et al. (1997) and Dunlop (1999), high-quality spectral data not only provide reassurance that one is observing starlight, but allow reddening-independent age estimation based on the strength of specific spectral features. These observational advances have greatly enhanced the prospects for reliable age-dating of high-redshift stellar populations. Consequently, recent years have seen renewed interest in clarifying and attempting to resolve the remaining sources of uncertainty. As is often the case when an area of high-redshift astronomy finally enters the regime of quantitative astrophysics, the dominant sources of uncertainty transpire to be problems that have dogged work at lower redshift for many years. In this case the main outstanding issues are disagreements over the details of stellar evolution, and the well-known degeneracy between derived age and metallicity (Worthey 1994).
Of course the potential severity of both, and especially the former of these effects is expected to be a function of age and observed spectral region. In particular, as described by Magris & Bruzual (1993), and reaffirmed in the study of the red, galaxy LBDS 53W091 (Dunlop et al. 1996; Spinrad et al. 1997), it is in the rest-frame near-ultraviolet (near-UV), at ages less than 5 Gyr, that disagreements between the predictions of alternative models of spectral evolution should be minimised. This is because for such ages it is expected that the near-UV light should be dominated by the output of stars near the turnoff point of the ‘well-understood’ main sequence (e.g. Nolan et al. 2001). However, the ensuing controversy over the precise age of 53W091 (Bruzual & Magris 1998; Yi et al. 2000), and the resulting confusion over the wider implications for cosmology in general, have highlighted the need for a closer inspection of the uncertainties which continue to afflict galaxy age-estimation.
In an attempt to clarify the key issues we have now begun to study both the extent to which various evolutionary synthesis models differ in their evolutionary predictions, and the extent to which rest-frame near-UV data may allow the age-metallicity degeneracy to be lifted. In Nolan et al. (2001), we checked the time evolution of the solar-metallicity ( ) population synthesis models of several authors, by comparing the ability of the main-sequence components of these models to reproduce the near-UV solar spectrum of the Sun at its anticipated main-sequence turn-off age.
In this paper we explore whether, given data of sufficient quality, variable-metallicity stellar population models can extract the correct metallicity of a population simply from fitting to the near-UV spectral region accessible through optical spectroscopy of high-redshift galaxies.
We test whether the UV spectral region contains sufficient information to allow reliable recovery of the metallicity in two stages. Firstly, the single stellar atmosphere model spectra of Jimenez et al. (1998) are fitted to the HST ultraviolet spectra of two well-studied, non-solar metallicity, main-sequence stars, at a resolution (Heap et al., 1998a), and a typical signal-to-noise per pixel of 50, before re-binning (Heap et al., 1998b). These are kindly supplied by Sally Heap (Heap, private communication). Secondly, variable- and mixed-metallicity versions of the stellar population models of Jimenez et al.(1998) are fitted to the same two stellar spectra. These stars are HR 4683, an F4V star, with sub-solar metallicity, and HR 4688, an F8V star with super-solar metallicity (Edvardsson et al., 1993). The motivation for using the spectra of these particular stars is that the rest-frame near-UV spectra of the oldest known galaxies at (e.g. 53W091 and 53W069) mimic the spectra of main-sequence F stars (F5V - F9V; Dunlop 1999).
This is, of course, a rather one-sided test, but it is still potentially very instructive. Specifically, if the single stellar atmosphere models cannot extract the correct metallicity from the high-quality near-UV data available for these F-stars, then it is probably safe to assume that lifting the age-metallicity degeneracy in high-redshift galaxies is currently impossible. Conversely, if the single atmosphere models can yield the correct metallicity for these F-stars, then that provides some hope that the age-metallicity degeneracy can be lifted in high-redshift galaxies, given near-UV data of sufficient quality. In addition, if the variable- and mixed-metallicity stellar population model results are consistent with the results from fitting the single stellar atmospheres, then we may be confident that, at young ages, main-sequence stars do indeed dominate the UV flux of stellar populations, that the time-evolution of the non-solar metallicity population models is correct, and that we can constrain metallicity even with the greater flexibility allowed in the mixed-metallicity population models. We may then be confident that ages and metallicities recovered for the high-redshift galaxies are reliable.
However, such optimism must be tempered by the knowledge that the spectrum of a high-redshift galaxy is unlikely to be as clean as that of the test-case F-stars, given the obvious likelihood of a mixture of metallicities and ages in a substantial stellar population. Nevertheless, as we report in this paper, the results of fitting the variable/mixed metallicity models of Jimenez et al. (1998) to the near-UV spectra of the two F-stars are sufficiently encouraging to motivate the re-fitting of the Keck spectra of LBDS 53W091 and 53W069 with metallicity allowed to vary as a free parameter.
The layout of the paper is as follows. In section 2 we describe the models we have used, and the procedures by which they have been fitted to the data. In section 3 we present the results of fitting single, variable metallicity, model stellar atmosphere spectra, single (but variable) metallicity stellar population models, and mixed-metallicity stellar population models (comprising a free mix of seven different metallicities) to the HST near-UV spectra of the F stars. Then, in section 4, we present the results of fitting the same stellar population models to the optical (rest-frame near-UV) spectra of the galaxies LBDS 53W091 and 53W069, and discuss the extent to which such modelling allows the age-metallicity degeneracy to be lifted. Finally, as a check on whether our assumption of single burst models is appropriate, we have also fitted the spectra of these two galaxies using MOPED (Heavens et al., 2000), which allows the star formation history to be unconstrained. Our conclusions, including revised constraints on the ages of these red galaxies, are summarised in section 5.
2 Models and model fitting
2.1 The models
The stellar population evolutionary synthesis models utilised in this paper are the instantaneous starburst models of Jimenez et al. (1998), and the model single stellar atmospheres are those used in creating these population models. The reliability and consistency of the solar metallicity ( ) version of these population models were confirmed by Nolan et al. (2001). We now also possess non-solar metallicity models, for both the stellar population models and the single stellar atmosphere models, with metallicities 0.01 , 0.2 , 0.5 , 1.5 , 2.5 and 5.0 .
The stellar interior library of the Jimenez et al. (1998) models is computed using the latest version of the JMSTAR15 code (Jimenez et al. 1996, Jimenez & McDonald 1996). This uses the OPAL95 opacities (Iglesias & Rogers 1996) for stellar temperatures 6000K, and Alexander’s opacities for temperatures 6000K. The mixing-length theory of Baker & Temensvary (1966), modified to allow for the limit of optically thin convective elements (Mihalas 1978), is used for the treatment of convective energy transport. The model grid is calculated for a range of metallicities, Z 0.0002 0.1, with solar metallicity, 0.02, and the solar helium fraction, 0.28. The mixing-length parameter, , is calibrated by a comparison of the computed solar model with the observed effective temperature, Teff, age, luminosity and radius of the Sun. In addition, a consistency check was carried out, using the position of the red giant branch (RGB) in globular clusters with known metallicity (Jimenez et al. 1996).
Stellar masses range from 0.1 to 120 , with step size, M 0.05 , from 0.1 to 3 , and M 1 thereafter. The models used in this work have a Salpeter IMF (Salpeter 1955). The tracks are evolved all the way from the contracting Hayashi track to the planetary nebula (PN) phase, except for the most massive stars, where the evolution is followed until carbon ignition. All tracks are computed using solar-scaled abundances.
Stellar evolutionary tracks are computed using the boundary conditions set by the theoretical photospheric models calculated by Jimenez et al. (1998). Therefore, for each calculated point on the track, the associated stellar spectrum is known, and there is no need to introduce the uncertainties which arise in calibrating real stellar spectra to theoretical isochrones. Semi-convection arises as a natural consequence of this modelling method.
JMSTAR15 computes the whole evolution of a star in a single run, including the helium core flash, through the thermally-pulsing asymptotic giant branch (TPAGB), ejecting a PN at the end. This is possible due to the adaptive mesh of grid points, which allows very rapid stages of evolution to be modelled in detail. The SSP code includes a semi-empirical algorithm for computing the evolution of the RGB, horizontal branch (HB) and asymptotic giant branch (AGB). This is more realistic than a purely numerical code, and faster, but allows the same degree of accuracy. The AGB was modelled as in Jrgensen (1991).
A semi-empirical algorithm is also used in the calculation of mass-loss. The fast computation of post-main sequence (post-MS) stages allowed several values of the mass-loss efficiency parameter, ( in Reimers’ formula, Reimers 1975), and mixing-length parameter, , to be investigated. A realistic mean value of is then found by matching the observed HB mass distribution (Jimenez et al. 1995).
The stellar spectra are those of the Kurucz (1992) library of theoretical stellar atmosphere models for stars with Teff 6000 K. For cooler stars, theoretical photospheres are computed by Jimenez et al. (1998), using the improved (Helling et al. 1996) MARCS code (Gustafsson et al. 1975), which includes molecular opacities.
2.2 The fitting processes
Firstly, we have explored the results of simply fitting each of the seven single stellar atmosphere models in turn to the F star spectra, at all possible ages, to identify the best-fitting single value of metallicity, and the resulting inferred age. Secondly, the same process is carried out for the seven single-metallicity stellar population models, for both the F star spectra and the high-redshift galaxy spectra. Finally, we have combined the seven single-metallicity stellar population models to produce a composite model (of single age) in which mean metallicity is allowed to vary by varying the fractional contributions made by each of the seven different metallicity components. We have fitted the mixed-metallicity model to the spectra of the F stars, as well as the high redshift galaxies’ spectra, to confirm that fitting this model allows us to reclaim the correct metallicity.
2.3 Fitting the single stellar atmosphere and single-metallicity population models
The best fit was determined for each single-metallicity model (single-atmosphere and stellar population), i.e 0.01 , 0.2 , 0.5 , , 1.5 , 2.5 and 5.0 , in the following way. First, the data were re-binned to the same spectral resolution as the models, with the new flux calculated as the mean flux per unit wavelength in the new bin. Both the re-binned and model fluxes were then normalised to a mean flux per unit wavelength of unity across the wavelength range for the galaxy fits, and across the range for the F-star fits (because of the shorter wavelength range of the F-star spectra). The model age and normalisation were then varied as free parameters until was minimised. The wavelength range was excluded from the fits to all objects. When included, this feature contributed to 1/3 of the total for both the F stars. As this was felt to unfairly bias the fitting process for these objects, the area was masked from the fit for all the objects, and may indicate a failure of the models in this range.
In order to produce the contour plots for the single-metallicity stellar atmosphere and stellar population model fits in sections 3 and 4, the results were refined by carrying out two one-dimensional cubic spline interpolations, one for age, and one for metallicity, between the calculated points on the age-metallicity grid.
2.4 Fitting mixed-metallicity models
A mixed-metallicity model was constructed from the 0.01 , 0.2 , 0.5 , , 1.5 2.5 and 5.0 stellar population models of Jimenez et al. (1998). The relative contributions of the different metallicity models were allowed as free parameters. In this section, we assume that all the component populations were formed at the same time, so that the one other free parameter in the fit was the age of the complete population. In section 4.3, we lift this constraint and explore what happens when the stellar populations are formed at arbitrary times.

The mixed-metallicity model flux was built from the unnormalised single-metallicity model fluxes, and then normalised to a mean flux per unit wavelength of unity in the same regions as for the single-metallicity model fits, so that
where is the mixed, seven-metallicity model flux per unit wavelength in the bin centered on wavelength at age, Gyr; is the flux per unit wavelength at age, Gyr, for the single metallicity model with , where , and is the fractional contribution (by baryonic mass) of the model with to the total population.
The best-fitting age, normalisation and the value of each were determined by minimisation, with the wavelength range masked from the fit, as it was in the single stellar atmosphere and single stellar population fits. The entire parameter space of the seven-dimensional age-metallicity hyper-cube was searched, so that the best fits quoted in sections 3 and 4 are those parameter values which correspond to the point on the age-metallicity grid with the minimum .
2.5 Errors
The errors on the binned spectral data points for the LBDS galaxies have been derived from the propagation of the original observational errors in the Keck optical spectroscopy (Dey et al., 2002, in preparation). Using these errors, statistically acceptable fits were achieved. For the F-star spectra, the error adopted for each re-binned data point was simply the standard error in the mean for that bin. For HR 4683 (the low-metallicity star), a formally acceptable fit was obtained using these errors. However, for HR 4688 (the high-metallicity star), this did not prove possible. There are a number of reasons why this might occur (e.g. inadequacy of the super-solar models e.g. Kotoneva, Flynn & Jimenez (1998).
2.6 Marginalising the mixed-metallicity results
The contours of constant relative likelihood discussed in §3.3 and 4.2 are plotted with respect to mean metallicity and age. As it is possible for more than one combination of single-metallicity models to result in the same mean metallicity, the metallicity distribution was marginalised before plotting.
3 Comparison with F-star spectra
3.1 Single stellar atmospheres
| object | Z/ | Best fit age/Gyr | ν |
|---|---|---|---|
| F4V | 0.01 | 8 | 2.47 |
| 0.2 | 4 | 1.59 | |
| 0.5 | 3 | 1.73 | |
| 1.0 | 2 | 2.43 | |
| 1.5 | 1.5 | 2.71 | |
| 2.5 | 1 | 4.00 | |
| 5.0 | 0.5 | 8.31 | |
| F8V | 0.01 | not on MS | |
| 0.2 | 5 | 3.19 | |
| 0.5 | 3 | 3.21 | |
| 1.0 | 2.5 | 2.97 | |
| 1.5 | 2 | 2.58 | |
| 2.5 | 1.5 | 2.40 | |
| 5.0 | 1.5 | 3.20 |
In table 1 and figures 1 and 2, the results of fitting the seven single-atmosphere models, with metallicities 0.01 , 0.2 , 0.5 , , 1.5 , 2.5 and 5.0 to the HST spectra of the two F stars are presented. The best-fit single-star model to the F4V star spectrum has a metallicity of 0.2 , and an age of 4 Gyr. For the F8V star, the best-fit single-star model has an age of 1.5 Gyr, with a metallicity 2.5 .
Edvardsson et al. (1993) estimated the relative iron abundances ([Fe/H] = Z/ , where ) of these two stars by fitting model stellar atmospheres to spectral lines observed at optical wavelengths. They estimated the uncertainty in the derived metallicities to be, at most, 0.10 dex. Based on these optical lines, they found the F4V star to have a metallicity of 0.29 , and the F8V star to have a metallicity of 1.62 .
Edvardsson and coworkers also derived ages for these stars from fits in the plane to VandenBerg (1985) isochrones. They found an age of 4.4 Gyr for the F4 dwarf, HR 4683, and an age of 2.1 Gyr for the F8 dwarf, HR 4688. However, they expect the uncertainties in the relative ages of the stars in their sample to be %, with the possibility that the absolute errors are larger.
Our results from fitting the single stellar atmosphere models are in excellent agreement with these, entirely independently obtained, age and metallicity estimates. Encouraged that the UV spectral region contains sufficient data to determine both age and metallicity, we proceed to fit the stellar population models.
3.2 Single-metallicity stellar population models
Attempting to fit complete stellar population models to the spectra of single stars might seem like a strange thing to do. However, having established that the individual input stellar spectra seem to work well in the near-UV regime, extending the model fitting to complete stellar populations offers a means to test the extent to which the near-UV light from a complete stellar population is indeed dominated by the dwarfs near the MS turnoff. It is also important to test whether, with the addition of stars spanning a wide range in mass and evolutionary stage, the theoretical UV spectrum can still identify the correct metallicity of our adopted turn-off population (as represented by the single F-star spectrum) given data of this quality. Finally, expanding the parameter space still further to include a mix of stellar populations of different metallicity, it is of interest to test whether these stellar spectra still contain enough information to allow the age and metallicity to both be well constrained.
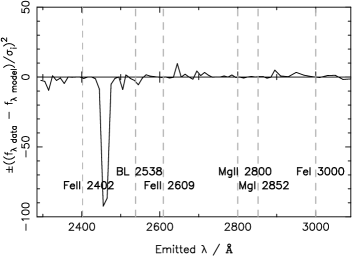
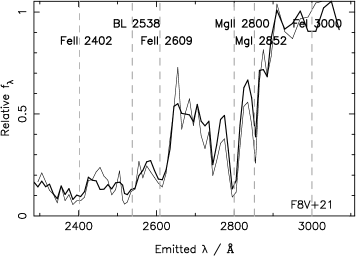
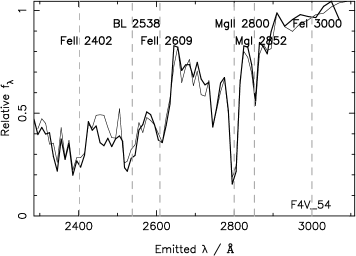
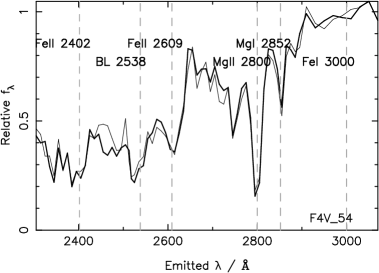
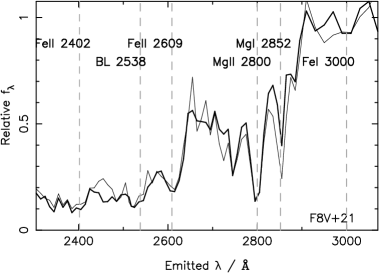
In figures 3 and 4, we show the results of fitting each of the seven single-metallicity stellar population models in turn to the HST spectra of the F stars HR 4683 and HR 4688 respectively. The first plot in each figure shows the best-fitting model spectrum superimposed on the observed near-UV stellar spectrum. The second plot shows contours of constant reduced () as a function of metallicity and age. The contour levels contain 68%, 90% and 95.4% relative likelihood. The results are presented in table 2.
| object | Z/ | Best fit age/Gyr | ν |
|---|---|---|---|
| F4V | 0.01 | 13 | 10.5 |
| 0.2 | 3 | 1.68 | |
| 0.5 | 3 | 1.72 | |
| 1.0 | 1 | 2.79 | |
| 1.5 | 1 | 4.48 | |
| 2.5 | 0.7 | 5.29 | |
| 5.0 | 0.3 | 8.45 | |
| F8V | 0.01 | 13 | 21.7 |
| 0.2 | 13 | 2.86 | |
| 0.5 | 13 | 2.55 | |
| 1.0 | 4 | 2.52 | |
| 1.5 | 3 | 2.35 | |
| 2.5 | 1 | 2.47 | |
| 5.0 | 0.7 | 3.76 | |
| LBDS 53W069 | 0.01 | 13 | 2.69 |
| 0.2 | 13 | 0.92 | |
| 0.5 | 9 | 0.92 | |
| 1.0 | 4 | 1.04 | |
| 1.5 | 3 | 1.02 | |
| 2.5 | 1 | 1.10 | |
| 5.0 | 0.7 | 1.26 | |
| LBDS 53W091 | 0.01 | 11 | 3.17 |
| 0.2 | 10 | 1.26 | |
| 0.5 | 8 | 1.32 | |
| 1.0 | 3 | 1.21 | |
| 1.5 | 3 | 1.30 | |
| 2.5 | 1 | 1.37 | |
| 5.0 | 0.7 | 1.51 |
The fitting process results in a minimum corresponding to an age of 3 Gyr, with a metallicity of 0.2 for the F4V star, HR 4683, and an age of 3 Gyr, with a metallicity of 1.5 for the F8V star, HR 4688.
Again, the metallicities yielded by our completely independent, near-UV model-fitting shown in figures 3 and 4 are in very good agreement with those previously derived from optical indices by Edvardsson et al. (1993); we have derived metallicities from the near-UV data which fall within the uncertainties in the optically-derived values (see figures 3 and 4).
It should be noted that the ages determined by Edvardsson and co-workers are the present ages of the stars, whereas fitting the stellar population models to the spectra should yield ages which correspond to the main-sequence lifetimes of the stars. For this reason it might be expected that our model-fitting should yield ages greater than those derived by Edvardsson and co-workers. However, the models include integration down the main-sequence, as well as post main-sequence contributions, both of which are likely to lead to an under-estimate of the true main-sequence turnoff age when fitted to the spectrum of a single star. Therefore, more important than the exact values of the derived ages for single stars is the fact that the age appears to be well constrained despite the availability of seven different metallicities at each age. In addition, the results of these stellar population model fits are in good agreement with the results of §3.1, as one would expect if stellar populations are indeed dominated by MSTO stars at ages 5 Gyr.
These results therefore demonstrate that by fitting the single-metallicity models to the near-UV spectra of the F stars, we have apparently managed to simultaneously determine both age and metallicity, recovering well-constrained and plausible metallicities for these two stars.
3.2.1 Age / metallicity determinators
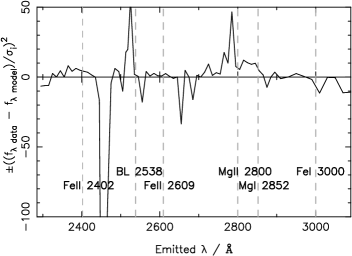
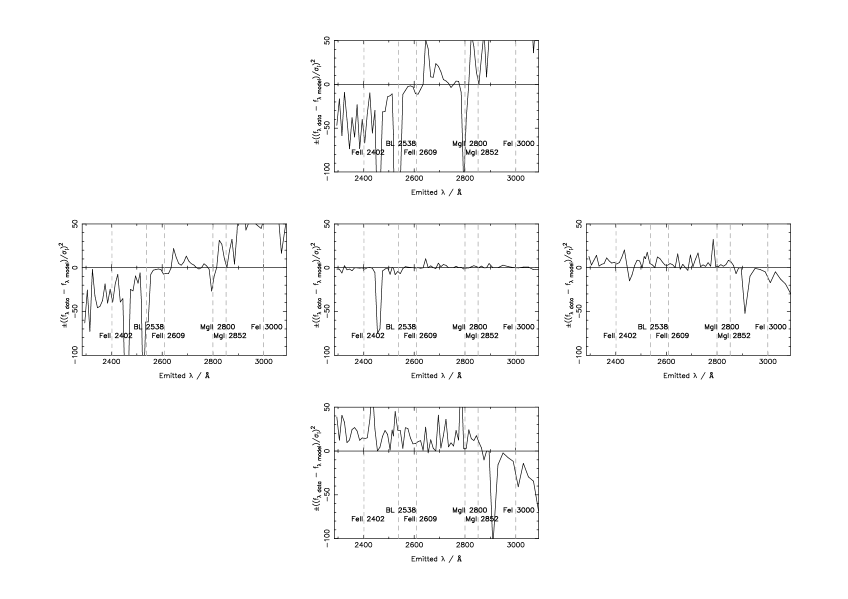
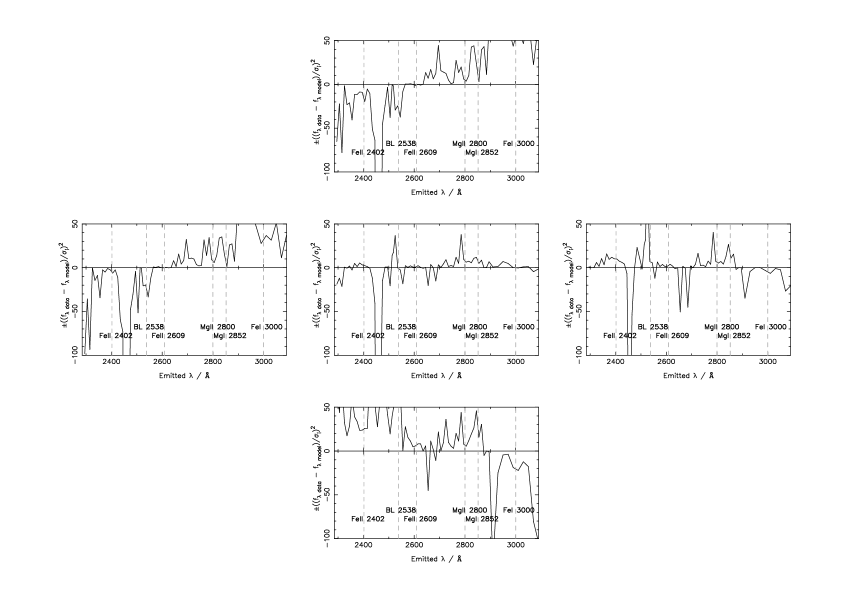
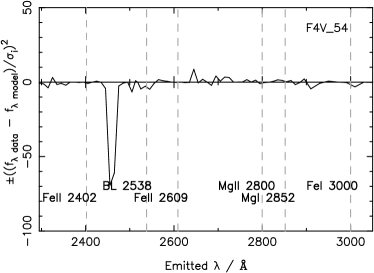
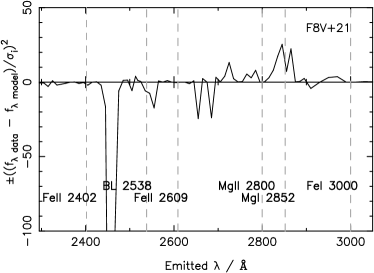
This success leads naturally to the question of whether any specific spectral features in this near-UV regime can be identified as primarily responsible for allow the metallicity and age to be so effectively determined in this analysis. To explore this we have derived residual plots for a range of single-metallicity stellar population models fitted to the observed stellar spectra, which are shown in figures 5 and 6. The central plot is the residual from the best over-all fit. The metallicity of the model fitted increases downwards, and the age increases from left to right. Where the (normalised) observed flux is less than the (normalised) model flux,the quantity plotted is . The feature at 2450 has been masked out in all fits.
In fact, from these figures it is hard to identify any particular absorption line as being primarily an indicator of age or of metallicity. However, there is a clear suggestion that changes in age and metallicity alter the shape of the residual spectrum in rather different ways; while changing age alters the overall slope of the residual continuum level, changing the metallicity introduces stronger steps into the residual continuum level, especially at 2850. This is perhaps not surprising since much of the detailed UV continuum shape produced by stellar populations around this age is dominated by extensive line blanketing.
For the sub-solar metallicity star, HR 4683, the spectral features identified by Fanelli et al. (1992), as marked on the plots, are remarkably well reproduced by the best-fitting model spectrum (figure 5, centre plot). The BL 2538 feature is least-well reproduced, although this is better fit by the best-fitting single stellar atmosphere model spectrum. One might expect that, as the spectral features of Fanelli et al. (1992) have been well studied, their flux would be well modelled.
For the super-solar metallicity star, HR 4688, the MgII 2800 and BL 2538 features (offset in the model flux with respect to the central wavelengths of the features because of the binning resolution) are not well fitted by the best-fitting single stellar population model (figure 6, centre plot). It is unlikely that the poor modelling of these features arises from including post-MS contributions to the model flux, as they are not well modelled even by the best-fitting single stellar atmosphere model. The MgII feature at 2800 is better fit by the 0.5 model. This illustrates the dangers associated with attempts to determine age and metallicity using only a handful of absorption features.


3.3 Mixed-metallicity models
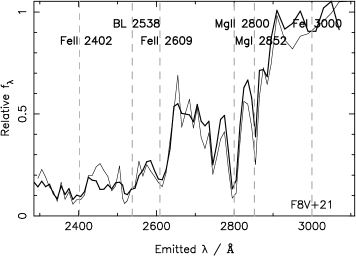
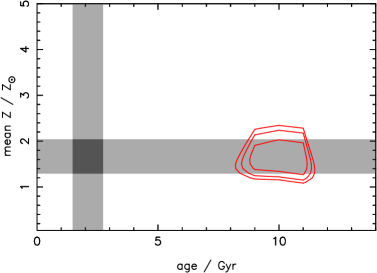
In figures 7 and 8, we show the results of fitting the mixed-metallicity model to the HST spectra of the F stars. Each figure shows the best-fitting model superimposed on the observed near-UV stellar spectrum, together with the residual plots, with the central wavelengths of the mid-UV spectral features identified by Fanelli et al. (1992) marked by dashed lines.
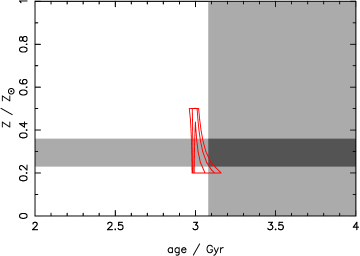
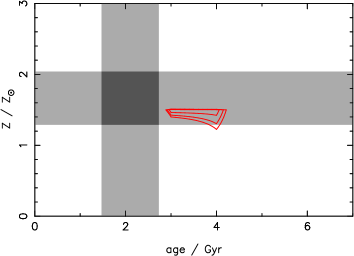
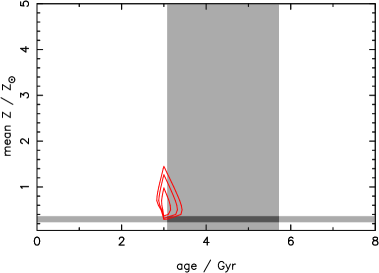
These are followed by contour plots of constant relative likelihood for the marginalised distribution of mean metallicity with age. The contours contain 68.3%, 90% and 95.4% relative likelihood. Also included is a fourth panel showing how the fractional contribution (by baryonic mass) of the different metallicity components varies as a function of age. The results are tabulated in table 3.
This time, the interpolated results predict a mean metallicity for the F4V star of 0.37 at an age of 3 Gyr, while for the F8V star a mean metallicity of 1.52 , at an age of 9 Gyr, is predicted.
From the residual plot in figure, it can be seen that the identified spectral features of HR 4683 are again well fitted by the model. For the super-solar metallicity star, HR 4688, the absorption features BL 2538 and MGII 2800 are much better reproduced by the mixed-metallicity model than by the single-metallicity models.
Fitting this type of mixed-metallicity model arguably provides a fairer test of our ability to simultaneously determine age and metallicity. Once again it can be seen that the derived metallicities and ages are well constrained, and the metallicities are in good agreement both with the completely independent, optically-based results of Edvardsson et al., and the results of the previous two subsections, although, in this case, the predicted age of HR 4688 is older than might be expected. However, it can be seen in the fourth plot of figure 8 that where a single metallicity dominates (at an age of 3 Gyr) the results are consistent with the results of the single-metallicity stellar population fits.
4 Red galaxies at z 1.5
4.1 Single-metallicity models
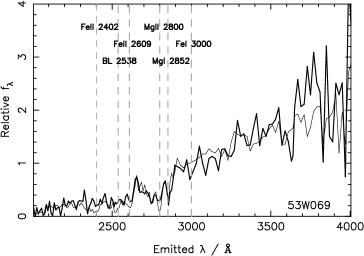
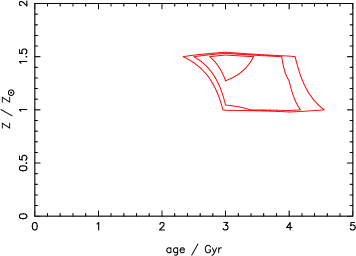
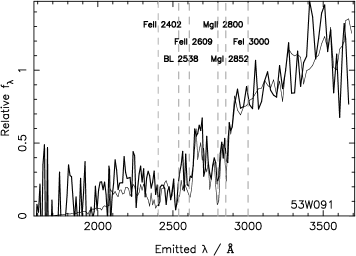
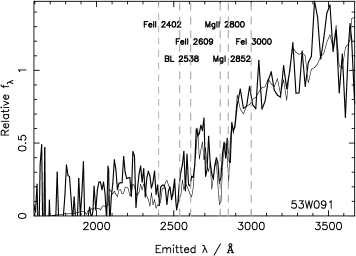
In figures 9 and 10, we show the results of fitting each of the seven single-metallicity models in turn to the Keck spectra of the red mJy radio galaxies LBDS 53W069 (Dunlop 1999, Dey et al. 2002, in preparation) and LBDS 53W091 (Dunlop et al. 1996; Spinrad et al. 1997) respectively. The first plot in each figure shows the best-fitting model spectrum superimposed on the rest-frame near-UV galaxy spectrum. The second plot shows contours of constant reduced () as a function of metallicity and age. The contour levels represent 68%, 90% and 95.4% confidence limits. The results are presented in table 2. An age of 3 Gyr, with a solar metallicity is derived for the galaxy LBDS 53W091 (z = 1.55). For LBDS 53W069 (z = 1.43), ages greater than 6 Gyr are discarded, as they are not possible at z in currently-accepted cosmological models. The best fit age is then 3 Gyr, at a metallicity 1.5 .
In both LBDS 53W069 and 53W091, age and metallicity have been simultaneously remarkably well constrained (see figures 9 and 10), with a predicted age for 53W091 between 2.7 and 3.5 Gyr with 95.4% confidence, and for 53W069, between 2.3 and 4.6 Gyr at the same level of confidence. Thus, under the assumption of a single metallicity for the observed stellar populations in these galaxies, it is clear that allowing metallicity to vary as a free parameter does not alter the conclusion of Dunlop (1999), that both these galaxies are Gyr old, by any more than 1 Gyr, even when, as in the case of LBDS 53W069, the predicted metallicity is super-solar.
The results confirm the validity of previous arguments in favour of assuming roughly solar metallicity when modelling LBDS 53W091 (Spinrad et al. 1997).
| object | mean Z | Best fit age | 95.4% age limits | ν |
|---|---|---|---|---|
| / | / Gyr | / Gyr | ||
| F4V | 0.37 | 3 | 1.47 | |
| F8V | 1.52 | 9 | 1.41 | |
| 53W069 | 3.78 | 0.78 | ||
| 53W091 | 1.00 | 3 | 1.25 |
We next investigate the robustness of these results by fitting the mixed-metallicity model to the galaxy spectra.


4.2 Mixed-metallicity models
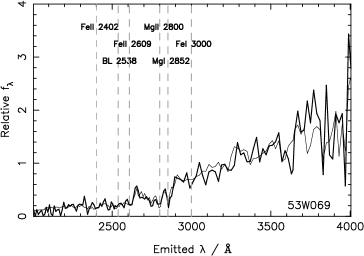
In figures 10 and 11, we show the results of fitting the mixed-metallicity model to the Keck spectra of the LBDS galaxies. As in figures 7 and 8, each figure shows the best-fitting model superimposed on the rest-frame near-UV spectrum, followed by contour plots of constant as a function of mean metallicity and age. The contours contain 68.3%, 90% and 95.4% relative likelihood. Again, a third panel is included showing how the fractional contribution (by baryonic mass) of the different metallicity components varies as a function of age. The results are presented in table 3. Again, ages greater than 6 Gyr are rejected as impossible in currently accepted cosmological models.
This time the best-fit mean metallicity of 53W069 is 3.78 . Only old ages ( 4.5 Gyr) are allowed, even at high metallicity. The third plot of figure 11 shows that the mixed-metallicity model is dominated by contributions from the high metallicity (2.5 and 5.0 ) models. This is a very different result from the single-metallicity fit, where the age is constrained at the 95.4 % level to between 1.9 3.2 Gyr, at less than half the metallicity here.
Despite the relatively high value of best-fitting mass-weighted metallicity, the interesting thing is that the inferred age of LBDS 53W069 remains old. The second panel in figure 11 demonstrates that, while the age is not constrained, ages 4.5 Gyr are prohibited at the 95.4% confidence level.
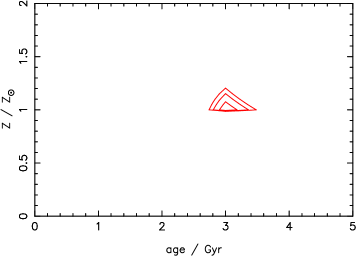
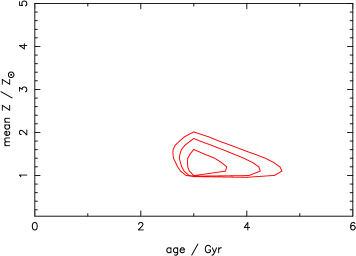
For 53W091, the mean metallicity derived from this mixed-metallicity modelling is reasonably well constrained, and is in fact precisely solar. Not surprisingly, therefore, the best-fit age remains 3 Gyr (c.f. table 2), with ages 2.5 Gyr formally rejected at the 95.4% confidence level. Again, ages 6 Gyr have been excluded on cosmological grounds.
Is this lower age limit on 53W091 robust, or are better fits possible at lower ages with even higher metallicities than those investigated? For this galaxy, the bottom plot in figure 12 shows that the highest metallicity component is only dominant at very young ages, where the statistical quality of the fit is completely unacceptable. A sufficient region of parameter space has been explored for the age limit 2.5 Gyr to be regarded as robust. Again, it should be noted that where a single metallicity component dominates the fit, the results are consistent with the single-metallicity model fits.
4.3 MOPED results
In all of the above, we have assumed that the galaxies have formed the bulk of their stellar populations, of whatever metallicity, in a single coeval starburst. To check the extent to which this simplification is appropriate, it is clearly desirable to explore a larger parameter space, in which star formation history is allowed to vary freely. We have therefore refitted the galaxy spectra using the MOPED algorithm (Heavens et al., 2000). In this approach, star formation is divided into several bins in time; the bins have equal width in log space, and allow widths small enough to account for the recent formation of stars in giant molecular clouds ( years). The height of each bin, allowed to float as a free parameter, represents the mass turned into stars at the corresponding epoch. The metallicity of each bin is allowed to take any value from 0.01 to 5 . In this way, we have the most model-independent prescription for describing a stellar population which is a composite of simple stellar populations with arbitrary metallicity, age and star formation rate. Since it is obvious that we cannot explore a parameter space with 1000 variables, we constrain ourselves to 12 bins in star formation history. With the help of MOPED (Heavens, Jimenez & Lahav, 2000, Reichardt, Jimenez & Heavens, 2001), we are able to explore this huge (25 dimensional) parameter space very efficiently, in only a few seconds.
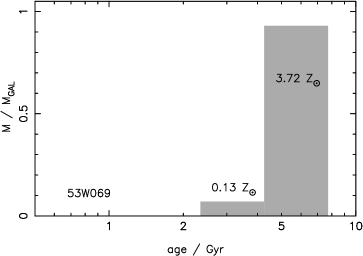
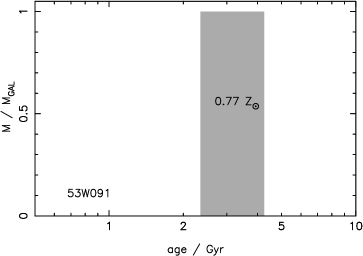
Figures 13 and 14 show the best fitting value found searching the hyper-likelihood surface111The hyper-likelihood surface is so large in this case that not all of it can be explored at once. Instead we chose 2000 random starting points to find the global minimum, which is shown in figures 13 and 14, for 53W069 and 53W091 respectively.. The results for 53W069 yield a population dominated by an old ( Gyr), high-metallicity (3.72 ) component, together with a small (7.0% by baryonic mass), younger component with a metallicity of 0.13 . For 53W091, we can see an old component ( Gyr) with a metallicity of 0.77 and negligible contributions from other populations, in good agreement with our previous findings. This, therefore, confirms that for both 53W091 and 53W069, the ages of the dominant populations remain old and apparently coeval, even when the star formation history is allowed to float freely. Unsurprisingly, therefore, the quality of the best fits achieved by MOPED are no better than those achieved with the single burst models explored in the earlier section of this paper.
It should be noted that the MOPED algorithm includes a parameter which allows for reddening of the spectra by dust. For both 53W091 and 53W069, the MOPED fits find a negligible contribution from dust. As the MOPED results are in good agreement with the results from the mixed-metallicity model spectral fits, we are justified in ignoring dust in the spectral fits.
5 Conclusion
The main conclusions of this work can be summarized as follows.
First, we have demonstrated that, when fitted to high-quality, near-UV spectra of F stars, the synthetic near-UV spectra produced by the variable-metallicity models of Jimenez et al. (1998) are sufficiently accurate to extract well-constrained estimates of metallicity in accord with the values determined from the study of well-established optical indices. This suggests that it should, in principle, be possible to lift the age-metallicity degeneracy when fitting such models to high-quality optical spectra of high-redshift galaxies.
Second, fitting these variability-metallicity models to the Keck optical (rest-frame near-UV) spectrum of the red, galaxy 53W091 we find that it is dominated by a 3-Gyr stellar population of solar metallicity, in good agreement with the original conclusions of Dunlop et al. (1996).
Third, the fit to the even redder z galaxy 53W069 has been able to constrain the metallicity well, but the age has not been convincingly determined. Given the success of the fits to the other spectra, where the old, 5 model does not make any significant contribution, this is most likely to represent some uncertainty in the very highest metallicity model at old ages. However, better quality UV data and / or the addition of rest-frame optical data may serve to resolve this problem.
The main finding of importance for cosmology is that, even after this exploration of the effects of varying metallicity, the best-bet age of the oldest known galaxies at remains 3 Gyr, with ages younger than 2 Gyr now more strongly excluded than before.
For an Einstein-de Sitter universe is younger than 3 Gyr at , and even the hard lower limit for coeval star formation of 2 Gyr translates into star-formation activity prior to . For a flat universe with and , the best-bet age of 3 Gyr translates into , while the hard lower limit of Gyr translates into . The added flexibility in the star formation history investigated using the MOPED algorithm allows some later star formation, but the bulk of the stars ( 90%) must still be formed at high redshift.
Our results therefore continue to argue strongly against an Einstein-de Sitter universe, and favour a -dominated universe in which star formation in at least LBDS 53W091 is completed somewhere in the range . Such a conclusion is in accord with recent results from sub-mm surveys which suggest that star-formation activity in radio galaxies, and potentially all massive ellipticals is largely completed at (Archibald et al. 2001; Dunlop 2001).
ACKNOWLEDGEMENTS
We would like to thank Sally Heap for making the F star data available to us. Louisa Nolan acknowledges the support of a PPARC Studentship. James
Dunlop acknowledges the enhanced research time afforded by the award of a
PPARC Senior Fellowship.
Raul Jimenez acknowledges the support of a PPARC Advanced Fellowship.
REFERENCES
Archibald, E., Dunlop, J.S., Hughes, D.H., Rawlings, S., Eales, S.A., Ivison, R.J., 2001, MNRAS, 323, 417
Baker N., & Temensvary S., 1966, in: Tables of Convective Stellar Models
Bruzual G., Magris G.C., 1997, The Ultraviolet Universe at Low
and High Redshift : Probing the Progress of Galaxy Evolution, College
Park, MD, edited by William H. Waller et al., New York, American Institute of Physics. Also AIP Conference Proceedings, v.408., p.291
Chambers K.C., Charlot S., 1990, ApJ, 348, L1
Charlot S., Worthey G., Bressan A., 1996, ApJ, 457, 626
Dunlop J.S., 1999, in ’The Most Distant Radio Galaxies’, Proceedings of the colloquium, Amsterdam, 15-17 October 1997, Royal Netherlands Academy of Arts and Sciences. Edited by H. J. A. Rttgering, P. N. Best, and M. D. Lehnert., p. 71
Dunlop, J.S., 2001, ’Sub-mm clues to elliptical galaxy formation’,In: Deep Millimetre Surveys, eds. Lowenthal, J. & Hughes, D.H., World Scientific, p. 11
Dunlop J.S., Guideroni B., Rocca-Volmerange B., Peacock J.A., Longair M.S., 1989, MNRAS, 240, 257
Dunlop J.S., Peacock J.A., Spinrad H., Dey A., Jimenez R., Stern D., Windhorst R, 1996, Nature, 381, 581
Edvardsson B., Andersen J., Gustafsson B., Lambert D.L., Nissen P.E., Tomkin J., 1993, A. & A. 275, 101
Fanelli M.N., O’Connell R.W., Burstein D., Wu C-C., 1992, ApJS, 82, 197
Gustafsson B., Bell R.A., Eriksson K., Nordlund A., 1975, A&A 42, 407
Heap S.R. et al., 1998a, ApJ, 492, L131
Heap S.R., Lanz T.M., Brown T., Hubeny I., 1998b, in ’The Hy-Redshift Universe: Galaxy Formation and Evolution at High Redshift’, Proceedings of a conference held in Berkeley, CA, 21-24 June, 1999. ASP Conference Proceedings, Vol. 193, Edited by Andrew J. Bunker and Wil J. M. van Breugel, p. 167
Heavens, A.F., Jimenez, R., Lahav, O., 2000, MNRAS, 317, 965
Helling C., Jrgensen U.G., Plez B., Johnson H.R., 1996, A&A, 315, 194
Iglesis C.A., & Rogers F.J., 1996, ApJ, 464, 943
Kotoneva E., Flynn C. & Jimenez R., 2002, MNRAS, in press (astro-ph/0203118)
Jimenez R., Jrgensen U.G., Thejll P., MacDonald J., 1995, MNRAS, 275, 1245
Jimenez R., & McDonald J., 1996, MNRAS, 283, 721
Jimenez R., Thejll P., Jrgensen U.G., MacDonald J., Pagel B., 1996, MNRAS, 283, 721
Jimenez R., Padoan P., Juvela M., Bowen D.V., Dunlop J.S., Matteucci F., 2000, ApJ, 532, 152
Jimenez R., Padoan P., Matteucci F., Heavens A.F., 1998, MNRAS, 229, 123
Jrgensen, U.G., 1991, A&A, 246, 118
Kurucz R., 1992, in: The Stellar Populations in Galaxies, ed. B Barbuy, A Renzini, 225
Lilly S.J., 1998, ApJ, 333, 161
Magris G.C., Bruzual G., 1993, ApJ, 417, 102
Mihalas D., 1978, in: Stellar Atmospheres, San Francisco: W.H. Freeman, 1978
Nolan L.A., Dunlop J.S., Jimenez R., 2001, MNRAS, 323, 385
Reichardt C., Jimenez R. & Heavens A.F., 2001, 327, 849
Reimers D., 1975, Mem. Soc. Roy. Sci. Lige, 8,369
Salpeter E.E, 1955, ApJ, 121, 161
Spinrad H., Dey A., Stern D., Dunlop J.S., Peacock J.A., Jimenez R., Windhorst R, 1997, ApJ, 484, 581
VandenBerg D.A., 1985, ApJS 58, 711
Worthey G., 1994, ApJS, 95, 107
Yi S., Brown T.M., Heap S., Hubeny I., Landsman W., Lanz T., Sweigart A., 2000, ApJ, 533, 670