On The Nature Of Superoutbursts In Dwarf Novae
Abstract
We present the first detailed hydrodynamic simulation of a superoutburst to incorporate the full tidal potential of a binary system. A two-dimensional smoothed particle hydrodynamics code is used to simulate a superoutburst in a binary with the parameters of the SU UMa system Z Chamaeleontis. The simulated light curves shows all the features observed in such systems. Analysis of the mass flux through the disc and the growth rate of the superhumps and disc eccentricity show that the superoutburst-superhump phenomenon is a direct result of tidal instability. No enhanced mass transfer from the secondary is required to initiate or sustain these phenomena. Comparisons of superoutbursts with normal outbursts are made and we show that the model can be reconciled with the behavior of U Geminorum type dwarf novae, which show no superoutbursts.
keywords:
accretion, accretion discs - instabilities - binaries:close - novae, cataclysmic variables- methods:numerical.1 Introduction
SU Ursae Majoris systems are a class of cataclysmic variable which lie below the period gap (they have hours) and which differ in their outburst behaviour from dwarf novae in two distinct ways : in addition to the normal outbursts displayed by dwarf novae which last two to three days, SU UMa systems undergo longer superoutbursts. These show a plateau of brightness extending the outburst to ten days or more. Also, during a superoutburst, the light curve of an SU UMa reveals superhumps - a superimposed variation in brightness with a period a few percent longer than the orbital period of the system. It has been suggested that normal and superoutbursts do not coexist independently of each other, with a superoutburst being initiated by a normal outburst. There is evidence for a relaxation time of days in VW Hyi (van der Woerd and van Paradijs 1987), with all normal outbursts triggering a superoutburst if they occur 170 days or longer after the previous superoutburst.
1.1 Outburst mechanisms
Historically, two models have been proposed to explain dwarf nova
outbursts : a varying mass transfer rate from the secondary due to
its envelope being dynamically unstable (Bath 1973), or a varying
viscosity in the accretion disc between quiescent and outburst states
(Hoshi 1979). It is the disc instability model that has prevailed as
the accepted explanation, offering better compatability with modern
observations and theory. An excellent review is given by Cannizzo
(1993). We have recently used a smoothed particle hydrodynamics (SPH)
model to simulate a wide range of dwarf nova outburst characteristics
(Truss et al., 2000).
A complete theory of superoutbursts has been much more elusive.
Several models have been presented, however few explain all the
necessary properties, in particular the superhumps which appear
without fail in every superoutburst. Models involving mass-transfer
instabilities (Osaki 1985), disc instabilities (Osaki 1989) and both
(Duschl and Livio 1989) all explain some properties of a superoutburst.
A brief summary of these can be found in Warner (1995).
Simulations by Whitehurst (1988) showed that discs in binaries with
mass ratios could become tidally unstable. Unlike
stable discs which had a shape that was fixed in the binary frame,
these unstable discs were significantly eccentric. In the inertial
frame this eccentricity executed a slow prograde precession. Thus in
the binary frame the disc precessed retrogradely. Whitehurst found
that the tidal stresses on the precessing disc gave rise to a
periodically varying light curve that neatly explained superhumps.
The disc instability was explained in detail by Lubow (1991a) in terms of an
(eccentric inner) Lindblad resonance that occurs where orbits in the
disc are resonant with the binary orbit.
Only discs in systems with mass
ratios are large enough to reach the resonance.
This theoretical result closely matches the spread of cataclysmic
variables that are observed to have superhumps (Patterson, 1998).
Osaki (1989) espoused a superoutburst model which combined the thermal
and tidal instabilities. His model relied on the the outer disc radius
varying significantly over the course of a superoutburst cycle. At
the end of a superoutburst, Osaki proposed that the disc radius was
small so that it could not access the resonance. Hence when the
disc became thermally unstable, a normal dwarf nova outburst
occurred. As a result of the outburst however, the disc spread
radially. With each successive normal outburst the disc grew until
it encountered the resonance and became tidally as well as
thermally unstable. Osaki proposed but could not conclusively show,
that the tidal removal of angular momentum was much more efficient
from an eccentric disc. Consequently, when the disc encountered the
resonance it would dump a large fraction of its mass upon the white
dwarf. A prolonged “super” outburst that left a much diminished
disc resulted. Osaki’s model could not be carried too far as the
efficiency with which tides removed angular momentum from the outer
disc could not be determined with certainty. Osaki, and other
workers, were relying upon one dimensional numerical models for disc
evolution in which the tidal forces had only been included
approximately.
In this paper we report the results of a smoothed particle
hydrodynamics (SPH) simulation of a cataclysmic variable binary with
mass ratio , representative of
the SU UMa system Z Chamaeleontis. As the code is fully three
dimensional (though for the purposes of this paper the third dimension
has been suppressed), tidal forces are included exactly. Thus for the
first time we are able to follow the evolution of an accretion disc over the
course of a superoutburst.
2 Numerical Method
2.1 The Model
The model and methods used in this work have already been described in our recent paper (Truss et al., 2000), as applied to a system with the properties of SS Cygni (0.6). The SPH code directly includes the tidal forces due to the secondary, and incorporates a simple model for the dwarf nova thermal instability.
The key to our calculations lies in the implementation of a viscosity switch. If the local surface density exceeds a defined value then that region is transformed to the high-viscosity outburst state on a time-scale appropriate to the thermal time-scale. There is a corresponding second trigger level, , which causes the viscosity to be switched back down to the quiescent level. In this way we can simulate the limit-cycle behaviour of a dwarf nova with an isothermal simulation. Viscosity switches are nothing new in themselves in disc simulations, but in the past they have used trigger levels which are constant throughout the disc. This is an unrealistic situation. Cannizzo, Shafter and Wheeler (1988) have calculated the format for the critcal values of surface density in a steady-state disc and found an almost linear relationship with disc radius R (Cannizzo, Shafter and Wheeler, 1988, equations 2.1 and 2.2). Therefore, we implement a linear relationship for the disc in steady-state.
There are, however, some important refinements that have been made for this study which were not made previously. In Truss et al. (2000) we incorporated an azimuthally smoothed trigger condition, in which the density condition was only tested for annuli in the disc. This is unsatisfactory for work on a system with a more extreme mass ratio because the outer regions of the disc depart strongly from azimuthal symmetry in response to the tidal resonance. We therefore calculate our trigger condition absolutely locally for every particle in the simulation. We also previously used an enhanced viscosity parameter ( in quiescence and in outburst) to improve the run-time of the code. The desire to examine the growth-rate of superhumps on the correct time-scale has motivated us to use more realistic viscosity parameters here at the expense of simulating many outburst cycles. We use in quiescence and in outburst, typical of the values in a dwarf nova disc (see, Shakura & Sunyaev (1973) for a discussion of this viscosity parameterisation). We use other physical parameters relevant to observations of Z Cha - (both from Wood et al. 1986) and (Wade et al. 1988). The disc is built up from a mass stream and undergoes normal outbursts during the build-up to steady state in exactly the same way as our previous simulations (Truss et al. 2000).
3 Results
3.1 Light Curves
We present light curves through the entire superoutburst. The curves are constructed by summing the viscous dissipation in different regions of the disc. In this way we are able to compare the results with observed lightcurves in different wavebands. This approach differs slightly from our previous work, in which we attempted to reconstruct several wavebands by treating the disc as a black body. Since the observed optical emission is expected to be dominated by the cooler outer regions of the disc and the extreme ultraviolet (EUV) emission is dominated by the very hot inner region, we can gain a qualitative understanding of the behaviour of the disc with this simplified approach. A more quantitative analysis should be left to future work in which full thermodynamics is incorporated self-consistently.

Figure 1 shows the viscous dissipation from the outer parts of the disc (R 20 ). The profile and duration of the outburst is in good agreement with V-band observations of SU UMa systems. The initial rise to outburst is fairly rapid, lasting for two days, and is followed by the characteristic superoutburst plateau. Superhumps begin to appear prominently at t = 8 days. The decay of the superhumps in the simulation is slower than observations have suggested - they persist (albeit with decreasing amplitude) during and just after the decline from supermaximum. Buat-Ménard et al. (2000) included the effects of stream-impact heating in a one-dimensional model, and showed that this causes the functional form of the critical surface density to rapidly decrease at the disc edge. We believe that this would cause the outer disc to drain faster than in our simulation and drive the edge away from the resonance more quickly, suppressing the superhumps sooner. The decay from supermaximum is slower than the rise, lasting for 5 days. The total duration of the simulated superoutburst is around 18 days.


Recent EUVE observations of OY Carinae, which has a similar mass ratio to Z Cha, have shown that in addition to the expected delay between the optical and EUV rise, the EUV emission shows a rebrightening during superoutburst which is not seen in the V-band (Mauche et al., 2000). We are able to look for this effect in the simulation by consideration of the viscous dissipation coming from the hot, inner part of the disc (R 10 ), which is shown in Fig. 2 and the accretion rate onto the white dwarf (a good measure of the X-Ray lightcurve - Fig. 3). The rebrightening can clearly be seen in both figures, and is caused by the arrival of additional material from the outer disc which has been tidally forced into the high state.
3.2 Disc Response
It is particularly instructive to construct a visualisation of the disc at various times through the superoutburst cycle.
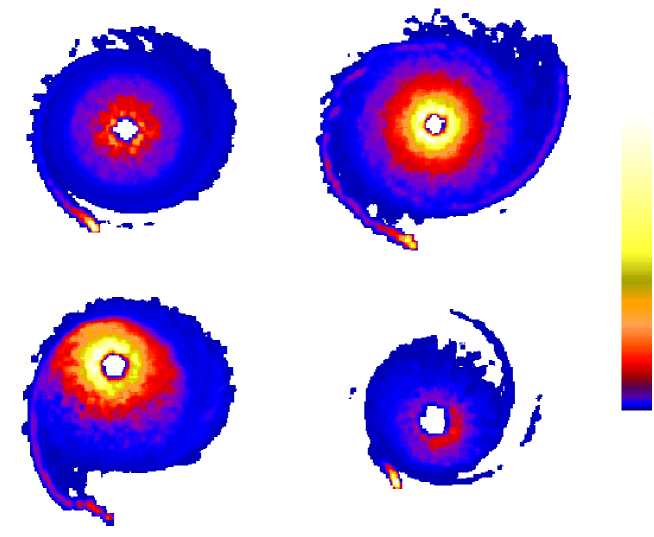
Figure 4 shows dissipation maps of the disc in four states. The hot-spot and spiral structure of the disc are clearly visible. In quiescence, the disc is not in contact with the 3:1 resonance; consequently it is circular. The innermost part of the disc remains in the high state. This is in agreement with our previous work on SS Cygni. The outburst progresses just as for a normal outburst, but during this time the disc radius increases and the edge of the disc encounters the resonance. We stress that this resonance is not available to systems with less extreme mass ratios. The disc rapidly becomes eccentric and virtually the entire disc is transformed to the high viscosity outburst state. It is interesting to note the brightness of the hot-spot in the lower-left hand panel of fig. 4. During supermaximum, we find that the brightness of the hotspot varies according to the orientation of the eccentric disc. This is not due to a varying mass transfer rate from the secondary - this remains constant at all times during the simulation - it is purely a result of the geometry of the stream impact region. The existence of such an effect in the nova-like V348 Pup has been reported by Rolfe et al. (2000).

Figure 5 shows the evolution of surface density with disc radius. Initially, the inner regions (R 0.25a) go into outburst (solid line), but it should be noted that the large reservoir of mass at larger radii is very close to the upper critical threshold. Consequently, it is only a short time before nearly the whole disc is in outburst, and at supermaximum the large reservoir of mass is seen to move to smaller radii (diamonds). At the end of the superoutburst, a large fraction of the disc has been accreted (stars); , compared with for a normal outburst.
3.3 Modal Analysis and Superhumps
We compare the response of the disc to the tidal field of the secondary star with the analysis of Lubow (1991a). The tidal potential can be decomposed into a set of functions
| (1) |
where each mode m generates a sinusoidal response in the disc with argument (). The (k,l) = (1,0) mode represents the disc eccentricity, which grows exponentially at a rate
| (2) |
is the surface density of the disc at radius r, is the mass of the disc and is the radius of the Lindblad resonance. This resonance couples with any existing eccentricity to launch a two-armed travelling spiral wave with (k,l) = (2,3).

The response of these two modes in our simulation is shown in Fig. 6. It is immediately clear that, as Lubow predicted, the growth of eccentricity is proportional to the strength of the (2,3) mode. For times less than t=11 days in the simulation, the growth rate of the (1,0) mode was
which compares favourably with the analytical prediction for this system of

Let us turn now to the superhumps themselves. The superhump period is, as expected from observations, slightly longer than the orbital period, and gradually decreasing as the outburst progresses. A Fast Fourier Transform of the dissipation data in the range where the eccentricity growth is a maximum (9.5 - 12 days) yields the period
However, between 12 and 18.5 days, when the superhumps are fully developed, we obtain
These results are in excellent agreement with the observations collated by Warner & O’Dononghue (1988), who found the superhump period to decrease according to
where T is the time after the beginning of the outburst in days.
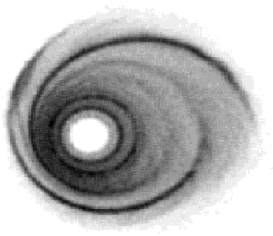
Fig. 7 shows a 15 hour portion of the lightcurve from the same region of the disc as defined in fig. 1. We also find a strong superhump signal produced from the inner part of the disc. This emission results from the spiral shock wave reaching all the way down into this region, and the effect can be seen with striking clarity in the map of the disc in fig. 8.
4 Discussion
We have performed the first two-dimensional simulation of a dwarf nova superoutburst. The method includes the full tidal potential of the binary and reproduces the observed characteristics of a superoutburst with no need for enhanced mass transfer from the secondary star. This leads us to conclude that the superoutburst-superhump phenomenon is purely a result of the tidal instability working in tandem with the thermal disc instability. Superoutbursts are therefore not seen in systems with less extreme mass ratios () because the tidal resonance is not available to them.
We feel that there is much confusion in the literature regarding the
terminology of ’wide’ and ’narrow’, ’inside-out’ and ’outside-in’
outbursts. This work coupled with our previous study of normal
outbursts suggests the following :
1. An outburst may be initiated at any point in the disc and in
general the resultant heating wave will travel in both directions.
2. All types of dwarf nova can exhibit both wide and narrow outbursts.
The physical distinction between the two is simply whether the
heating wave propagates to the large reservoir of mass stored in
the outer parts of the disc or not.
3. The superoutburst/superhump phenomenon is a result of the presence
of the tidal instability, in addition to the thermal
instability. The tidal instability is responsible for superhumps,
and the duration of a superoutburst is primarily determined by the
hot region of the disc arising from the thermal
instability. However, the duration will be lengthened by the
enhanced mass accretion arising from the tidally heated gas, which
produces the EUV rebrightening discussed in section 3.1.
Long-term observations of dwarf novae are still needed across a
variety of wavebands in order to improve our understanding of these
objects. EUV and X-Ray observations will reveal much about the physics
of the boundary layer between the disc and the surface of the white
dwarf, while eclipse mapping and döppler tomography should probe the
structure of the disc and the rôle of the spiral waves.
We also point out that observations of the growth rate of superhumps can
be used to gain estimates for mass ratio, through referral to
Lubow’s modal analysis that we have reprised here.
It is very important to concentrate on two and three dimensional simulations in the future, as the full tidal field is inherent in these models. The next step should be to perform a 3D calculation which includes fully self-consistent thermodynamics. One can envisage a hybrid of a 2D isothermal code such as this one with a traditional 1D thermodynamics code. This is a mammoth task in terms of computational requirements, but all the components of such a model already exist.
Acknowledgments
Research in theoretical astrophysics at Leicester is supported by a PPARC rolling grant. The simulations were performed using GRAND, a high-performance computing facility based at Leicester and funded by PPARC. MRT acknowledges a PPARC studentship and the support of the William Edwards Educational Charity.
References
- [1] Bath G.T., 1973, Nature Phys.Sci., 246, 84
- [2] Buat-Ménard V., Hameury J-M., Lasota J-P., 2000, A&A, 366, 612
- [3] Cannizzo J.K., 1993, in Accretion Disks in Compact Stellar Systems, ed. Wheeler J.C.. World Sci.Publ.Co., Singapore
- [4] Cannizzo J.K., Shafter A.W., Wheeler J.C., 1988, ApJ, 333,227
- [5] Duschl W.J., Livio M., 1989, Astr. Astrophys, 241, 153
- [6] Hirose M., Osaki Y., 1990, PASJ, 42, 135
- [7] Hoshi R., 1979, Prog.Theor.Phys., 61, 1307
- [8] Ichikawa S. et al., 1993, PASJ, 45, 243
- [9] Lubow S.H., 1991a, ApJ, 381, 259
- [10] Lubow S.H., 1991b, ApJ, 381, 268
- [11] Mauche C.W., Mattei J.A., Bateson F.M.,2000, astro-ph/0011347
- [12] Monaghan J.J., 1992, ARA&A, 30, 543
- [13] Murray J.R., 1996, MNRAS, 279, 402
- [14] Murray J.R., 1998, MNRAS, 297, 323
- [15] Osaki Y., 1985, Astr. Astrophys., 144, 369
- [16] Osaki Y., 1989, PASP, 41, 1005
- [17] Patterson, J., 1998, PASP, 110, 1132
- [18] Rolfe D.J., Haswell C.A., Patterson J., 2000, MNRAS, 317,759
- [19] Shakura N.I., Sunyaev R.A., 1973, A&A, 24, 337
- [20] Truss M.R., Murray J.R., Wynn G.A., Edgar, R., 2000, MNRAS, 319,467
- [21] van der Woerd H., van Paradijs J., 1987, MNRAS, 224, 271
- [22] Wade R.A., Horne K., 1988, ApJ, 324, 411
- [23] Warner B, O’Donoghue D., 1988, MNRAS, 233, 705
- [24] Warner B., 1995, Cataclysmic Variable Stars. Cambridge University Press
- [25] Whitehurst R., 1988, MNRAS, 232, 35
- [26] Wood J., Horne K., Berriman G., Wade R.A., O’Donoghue D., Warner B., 1986, MNRAS, 219,629