Interpreting the Cosmic Infrared Background: Constraints on the Evolution of the Dust Enshrouded Star Formation Rate
Abstract
The mid-infrared local luminosity function is evolved with redshift to fit the spectrum of the cosmic infrared background (CIRB) at m and the galaxy counts from various surveys at mid-infrared, far-infrared and submillimeter wavelengths. A variety of evolutionary models provide satisfactory fits to the CIRB and the number counts. The degeneracy in the range of models cannot be broken by current observations. However, the different evolutionary models yield approximately the same comoving number density of infrared luminous galaxies as a function of redshift. Since the spectrum of the cosmic background at m is quite sensitive to the evolution at high redshift, i.e. , all models that fit the counts require a flattening at to avoid overproducing the CIRB. About 80% of the 140 m CIRB is produced at 0 while only about 30% of the 850 m background is produced within the same redshift range. The nature of the evolution is then translated into a measure of the dust enshrouded star formation rate density as a function of redshift and compared with estimates from rest-frame optical/ultraviolet surveys. The dust obscured star formation rate density appears to peak at , much sooner than previously thought, with a value of 0.25, in excellent agreement with a value derived from extinction correction to NICMOS observations, and remains almost constant up to . At least 70% of this star formation takes place in infrared luminous galaxies with . The long wavelength observations that constrain our evolutionary models do not strongly trace the evolution at and a drop off in the dust enshrouded star formation rate density is consistent with both the CIRB spectrum and the number counts. However, a comparison with the infrared luminosity function derived from extinction corrected rest-frame optical/ultraviolet observations of the Lyman-break galaxy (LBG) population at suggests that the almost flat comoving star formation rate density seen between redshifts 0.8 and 2, extends up to a redshift of .
1 Introduction
The Extragalactic Background Light (EBL) in the infrared, also referred to as the Cosmic Infra-Red Background (CIRB), is a record of the emission, absorption and re-radiation of photons integrated over cosmic history. It provides a valuable constraint on theories of galaxy formation and evolution. The EBL at near-infrared wavelengths is due to redshifted radiation from stars. At mid-infrared (MIR) wavelengths, the background is due to redshifted emission from dust that consists of the polycyclic aromatic hydrocarbon (PAH) features and very small grains transiently heated to in individual galaxies. At far-infrared (FIR) wavelengths, the dominant contributor is thought to be cold dust () that is heated by the ambient interstellar radiation field in galaxies. The recent detection of this background at 2.2 m, 3.5 m, 140 m and 240 m using DIRBE/COBE data, and in the 1252000 range using FIRAS/COBE measurements by various groups (Puget et al., 1996; Dwek & Arendt, 1998; Fixsen et al., 1998; Hauser et al., 1998; Schlegel et al., 1998; Lagache et al., 1999; Gorjian, Wright & Chary, 2000; Wright & Reese, 2000; Wright, 2001), has indicated that the intensity of the optical/near-infrared background is roughly equal to that of the far-infrared background. This implies that about 50% of the integrated rest-frame optical/ultraviolet (UV) emission from stars and other objects is thermally reprocessed by dust and radiated at mid- and far-infrared wavelengths. Thus, star formation rates that are derived from rest-frame optical/UV luminosities of galaxies are a lower limit to the true star formation rate (e.g. Madau, Pozzetti, & Dickinson, 1998; Meurer et al., 1999; Steidel et al., 1999; Yan et al., 1999).
The first good evidence of this came from the IRAS sky survey which revealed a new population of galaxies with (see review by Sanders & Mirabel, 1996). Those with were classified as ultraluminous infrared galaxies (ULIGs) while galaxies with were classified as luminous infrared galaxies (LIGs) 111Previously, the term LIG was used for all objects with . We use “infrared luminous galaxies” when referring to both LIGs and ULIGs collectively.. These objects exhibited the largest known star formation rates of all local galaxies but had 90% of the bolometric luminosity being emitted in the far-infrared (40500 m) indicating that dust reprocessing is a significant parameter that needs to be considered in estimates of star formation in certain galaxies (e.g. Soifer et al., 1986). However, in the local universe, the integrated bolometric luminosity density of “normal” optically selected galaxies is while that of infrared luminous galaxies is i.e. 50 times less (Soifer et al., 1987). This seemed to indicate that the contribution from LIGs and ULIGs is sufficiently small that they need to be considered only as extreme cases.
Spectroscopic follow-up of the faint IRAS population which covered a relatively small redshift range () indicated that infrared luminous galaxies were more numerous in the past than they are today and may have a significantly larger contribution to the integrated luminosity density than inferred from observations of the local universe (Kim & Sanders, 1998). Deeper observations that trace the far-infrared luminosity of galaxies to high redshift are difficult since cirrus and confusion noise rapidly begins to dominate.
The ISOCAM guaranteed time extragalactic surveys in conjunction with the ELAIS survey and observations of the lensing cluster Abell 2390 covered a range of flux densities between 50 Jy and 50 mJy at 15 (Altieri et al., 1999; Elbaz et al., 1999; Serjeant et al., 2000). The differential counts resulting from these surveys revealed that the counts of galaxies increase quite rapidly as at brighter flux levels ( mJy) and then flatten out as at fainter levels. The observed mid-infrared counts are an order of magnitude higher than expected if the local mid-infrared luminosity function were not evolving with redshift. This rapid increase in mid-infrared luminous galaxies has been modeled as a luminosity evolution in the 15 m local luminosity function by Xu (2000), and as a combination of number density and luminosity evolution by Franceschini et al. (2001). This evolution is much stronger than observed in the UV by Cowie, Songaila & Barger (1999) who find that the comoving UV luminosity density evolves as , instead of the initially proposed by Lilly et al. (1996). Furthermore, observations of galaxies in the local universe have shown that the mid-infrared and infrared luminosities are well correlated (Section 2). The mid-infrared luminosity of % of the sources seen in the ISOCAM surveys, particularly in the Hubble Deep Field-North and flanking fields (HDFN+FF) translates to an infrared luminosity greater than implying that the majority of them are LIGs and ULIGs (Elbaz et al., 2001). At , the mid-infrared luminosity density derived from the ISOCAM 15 m sources is 710 while the luminosity density adopting the mid to far-infrared correlation seen in the local universe is 510. In comparison, at 0, LIGs and ULIGs contribute to the 12 m and 15 m luminosity density and 7.8106 to the infrared luminosity density, as derived from the local luminosity function (LLF) of Soifer et al. (1987); Fang et al. (1998); Xu et al. (1998). This indicates an increase by a factor of about 60 between 0 and 0.8, providing further evidence for an evolution in the infrared luminosity function (IRLF) with redshift.
Similar deep surveys have been conducted at 850 m using the SCUBA instrument on the JCMT (Hughes et al., 1998; Barger, Cowie, & Sanders, 1999; Blain et al., 1999a; Eales et al., 2000). The large beam size (14 FWHM) and the negative -correction in this wavelength regime makes identification of the optical counterparts and thereby the redshift distribution of the sources very difficult. High resolution radio interferometric observations and the use of 450 m/850 m flux ratios have helped somewhat in localizing the sources and constraining the redshifts (Hughes et al., 1998; Barger, Cowie, & Richards, 2000). These have placed the bright ( mJy) submillimeter sources at , which has been confirmed by the more extensive survey of Chapman et al. (2001). The implication of this is that most, if not all the submillimeter sources are extreme ULIGs with star formation rates of . Furthermore, the star formation rate density due to ULIGs must have increased by about 2 orders of magnitude between 0 and .
Many of the LIGs and ULIGs in the local universe show morphological signatures of interaction, and 50% of the optical counterparts of ISOCAM HDFN galaxies show evidence for interactions (Mann et al., 1997). Surveys at visible wavelengths show a redshift evolution of the merger fraction, defined as the fraction of close pairs of galaxies, as (e.g. Le Fevre et al., 2000). Thus, if mergers were indeed a tracer of LIGs and ULIGs, this would again suggest that the bright end of the IRLF is evolving strongly. However, the faint end of the IRLF is very poorly constrained at since none of the long wavelength surveys are sensitive enough to detect galaxies with at . Meurer et al. (1999) has shown that the FIR to UV flux ratio is closely related to the UV slope for normal starbursts but that the relationship breaks down for ULIGs (Meurer et al., 2000). This indicates that the visible/near-infrared counts can potentially place constraints on the evolution of the faint end of the infrared luminosity function but we postpone this discussion to the future.
In this paper, we combine data from a variety of published surveys of nearby galaxies to determine the correlation, if any, between the luminosities at various mid- and far-infrared wavelengths. We use these correlations to generate smoothly varying spectral energy distributions for galaxies as a function of luminosity class. We assess the need for luminosity and density evolution in the 15 m luminosity function of Xu et al. (1998) and therefore the 60 m luminosity function of Soifer et al. (1987) based on fits to the ISOCAM 15 m, ISOPHOT 90 m, ISOPHOT 170 m and SCUBA 850 m galaxy counts, as well as the spectrum of the CIRB at m. The evolution of the mid-infrared luminosity function is then translated to an estimate of the dust enshrouded star formation rate density (SFR) as a function of redshift and compared with SFR values derived from optical/near-infrared surveys. We adopt a =75 km s-1 Mpc-1, , cosmology throughout this paper unless otherwise explicitly stated.
2 Luminosity Correlations in the Infrared and Template Spectral Energy Distributions


It can be shown that the 12 m and far-infrared luminosities of galaxies in the IRAS Bright Galaxy Sample (BGS) cannot be accurately derived from their band luminosities (Soifer et al., 1987)222The Zwicky magnitudes, , in the BGS were converted to B-luminosities using and a band zero point of 4260 Jy.. The peak to peak scatter in the ratio for a fixed is about a factor of 20. However, as mentioned earlier, the FIR to UV flux ratio has been shown to be closely related to the UV slope for normal starbursts (Meurer et al., 1999). This relationship breaks down for the ULIGs (Meurer et al., 2000). The phenomenon can be qualitatively explained by the fact that the UV emission arises from stars which are relatively unobscured to the observer. Regions of star formation with large optical depth i.e. H II regions, could exist in the central regions of galaxies where almost all the UV light is reprocessed to the MIR and FIR. Thus, the regions of FIR and UV emission would be unrelated, especially for ULIGs. The best observational evidence for this explanation can be seen in the Antennae galaxy (Mirabel et al., 1998) where about half the 15 m emission seen by ISOCAM arises from regions that are inconspicuous at visible wavelengths. The breakdown in the FIR to UV slope correlation for ULIGs is problematic for determination of the true star formation rate from optical/UV surveys, since submillimeter observations using the SCUBA instrument indicate that ULIGs might have a larger contribution to the star formation rate density at high redshift. This suggests that it will be difficult to determine the true SFR by applying an accurate extinction correction to the optical/UV determined value.
Since the short wavelength starlight and dust emission are not closely related, an estimate of the dust enshrouded star formation rate can only be derived from other tracers such as the mid-infrared and far-infrared luminosities or using the radio to far-infrared correlation shown by Condon (1992). In the mid-infrared regime, the spectra of galaxies exhibit broad emission features at 6.2, 7.7, 8.6, 11.3 and 12.7 m which are probably from polycyclic aromatic hydrocarbons (see review by Puget & Leger, 1989). These features and their associated continuum dominate the emission at mid-infrared wavelengths shortward of 10 m. There is, in addition, a continuum from very small grains (VSGs) of size 10 nm which dominates the emission above 10 m (Désert et al., 1990; Laurent et al., 2000) except for quiescent star forming galaxies. The VSGs get transiently heated to temperatures of 200 K by the ambient optical/UV continuum which is proportional to the star formation activity. In addition, mid-infrared measurements do not need large extinction corrections since the extinction at mid-infrared wavelengths is only about 1% that at visible wavelengths (Mathis, 1990). The radio wavelengths on the other hand are dominated by free-free emission from HII regions and synchrotron emission from supernova remnants. Although radio observations are almost confusion limited at an 8.5 GHz sensitivity of 9 Jy obtained over the HDF (Richards et al., 1998), we find that they are typically as sensitive as the ISOCAM 15 m observations in that they can typically probe galaxies with at . Since the ISOCAM 15 m observations provide the primary constraint on evolution models at , we adopt as a starting point the local 15 m luminosity function described in Xu et al. (1998) and Xu (2000). For the rest of this paper, we will use the convention defined in Sanders & Mirabel (1996):
| (1) |
| (2) |
In the above, the symbol is defined as in units of . and are in .
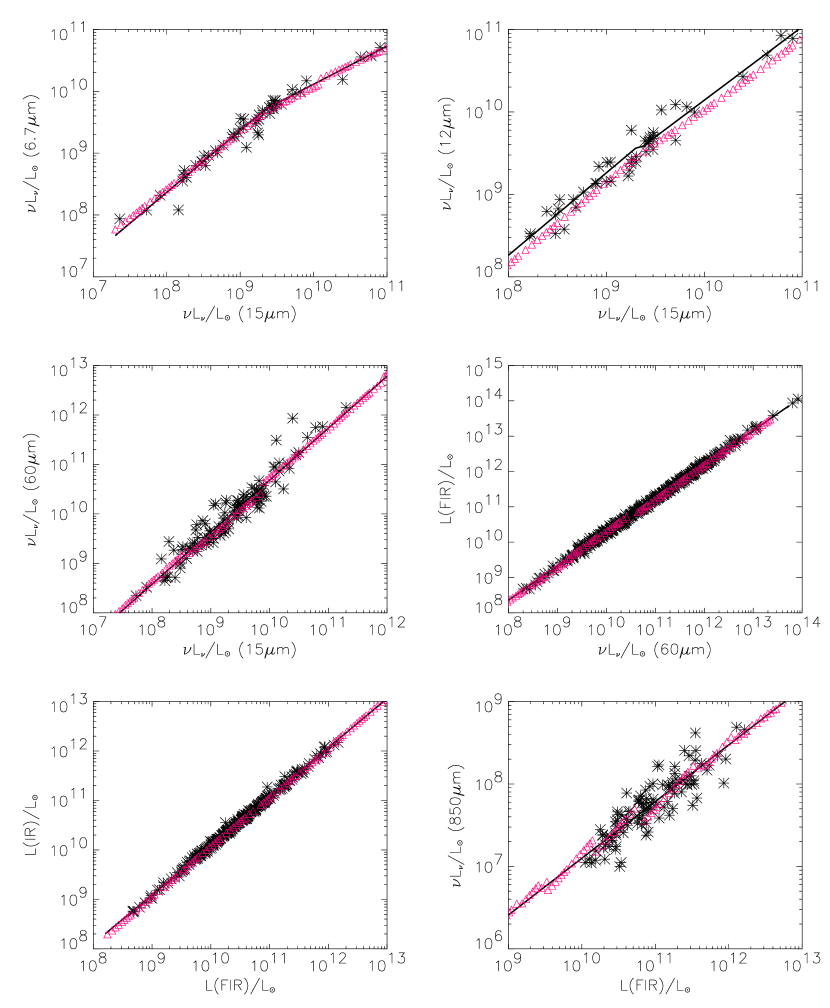
To use the mid-infrared luminosity function as a tracer of the dust enshrouded star formation rate, we first need to define a calibration scale. Figures 1 and 2 illustrate the accuracy with which the infrared luminosity of galaxies can be derived from their mid-infrared luminosities. Figure 1 is based on 300 galaxies from the IRAS BGS while Figure 2 is based on published ISOCAM and ISOPHOT observations of IRAS galaxies. The data points with are fit by a first order polynomial shown in Equations 4-6. This is shown as a solid black line in the upper panels of the figure. Objects with are not used for the fits. At these low luminosities, the fraction of the bolometric luminosity emitted in the infrared is 50% i.e. visible starlight that is not obscured by dust is dominating the radiated energy of the galaxy. On the other hand a significant fraction of the more luminous objects show disturbed morphologies, suggesting interactions with other galaxies that would result in gas-rich systems with star formation in highly obscured regions. The lower plots in both figures show the scatter in the ratio of the infrared luminosity as derived from IRAS data for these galaxies to the infrared luminosity derived from the polynomial fits. Also shown is the 1 uncertainty in the derived infrared luminosity calculated as the range within which 68% of the galaxies lie. The lowest luminosity objects () have been rejected in the lower plots.
The 6.7 m luminosities were derived from ISO observations of 90 nearby starburst dominated galaxies. 44 spiral and starburst galaxies had photometry from ISOCAM (Chanial et al., 2001; Roussel et al., 2001; Laurent et al., 2000), 8 ULIGs had spectra from ISOCAM circular variable filters (CVF) observations (Tran et al., 2001) while 37 ULIGs had ISOPHOT mid-infrared spectra (Rigopoulou et al., 1999). Rigopoulou et al. (1999) obtained mid-infrared spectra with ISOPHOT of about 60 ULIGs and about 15 low luminosity starbursts and normal galaxies to study the emission features from the PAHs. Of the 60 ULIGs, about 45 had the 7.7 m PAH feature detected with good signal to noise. However, the calibration and performance of the instrument is not very well determined. To assess the quality of the data set, we compared the ISOPHOT observations on 5 ULIGs and 4 low luminosity starbursts/normal galaxies to the Chanial et al. (2001) ISOCAM LW2 observations of the same galaxies333The LW2 filter is broad enough to include the 7.7 m PAH feature but is centered at 6.75 m.. We find that for the ULIGs, the ratio of 7.7 m line+continuum flux density as published in Rigopoulou et al. to the ISOCAM 6.7 m flux density lies in the range 1.53.0. In comparison, for the starbursts/normal galaxies, the ratio of 7.7 m line+continuum to the ISOCAM 6.7 m flux density falls in the range 0.21.6, a factor of 8. So, for assessing the correlation between the mid and far-infrared luminosities, we consider the ISOCAM data on bright IRAS galaxies as well as the ULIG sample of Rigopoulou et al. (1999), dividing the line+continuum flux value published in the latter by 2.4 and assigning a peak to peak error bar of a factor of 2. This is consistent with the range of 1.52.7 that we find for the 7.7 m line+continuum to the 6.7 m flux density ratio in the ISOCAM CVF observations of Tran et al. (2001).
The 15 m and infrared luminosities of 120 IRAS galaxies were taken from the sample of Chanial et al. (2001) and the survey performed in the North Ecliptic Pole Region (NEPR) by Aussel et al. (2000). The NEPR sample of galaxies only has IRAS 60 m luminosities available and we have converted these to a far-infrared luminosity based on a 60 m to far-infrared correlation derived by combining the IRAS BGS and the IRAS PSCz catalog of Saunders et al. (2000). The far-infrared luminosity is typically about 83% of the total infrared luminosity and we have applied this conversion to be consistent with the other plots.
Clearly, the 6.7 m, 12 m and 15 m luminosities of galaxies trace the infrared luminosity much better than the band luminosity. The 15 m-to-IR and 12 m-to-IR correlations were determined from a first order polynomial fit to the data with . Since the 6.7 m-to-IR correlation is based on different data sets from CVF and broadband photometry with ISOCAM and spectroscopy using ISOPHOT, the polynomial fit for the 6.7 m-to-IR correlation was determined by applying a correction from 6.7 m to 15 m based on ISOCAM observations of nearby galaxies (Figure 3) and then using the 15 m-to-IR correlation. The mid-infrared to IR correlations show a similar scatter around the correlation line which is about a factor of 5 better than the optical-to-IR correlation.
These data sets tentatively illustrate the potential of using the mid-infrared as a tracer of dust enshrouded star formation and a more homogeneous and comprehensive survey of nearby galaxies, as will be undertaken by SIRTF, will be required to either strengthen or reject this correlation.
Kennicutt (1998) has transformed the infrared luminosity of young yr starburst galaxies to a star formation rate. If we adopt the correlations shown in the previous figures, we can translate the mid-infrared luminosity of galaxies with to an approximate estimate of the dust enshrouded SFR () using the formulae:
| (3) | |||||
| (4) | |||||
| (5) | |||||
| (6) |
where all values are in . The 1 values have been estimated by calculating the range of values within which 68% of galaxies have their observed infrared luminosities.
As mentioned earlier, the main observational constraints on models that trace the redshift evolution of the IRLF are:
-
1.
differential counts from various surveys at mid-infrared, far-infrared and submillimeter wavelengths and
-
2.
the spectrum of the CIRB at m.
To use these constraints, it is necessary to know the luminosity at different wavelengths for galaxies in each luminosity bin of the infrared luminosity function. This motivates the generation of template spectra for objects of different luminosity classes. It is useful to note that many evolutionary models which have already been developed either use a mid-infrared template which is a very poor representation of the true PAH emission features (e.g. Rowan-Robinson, 2000; Pearson, 2001; Sadat, Guiderdoni & Silk, 2001) or neglect the PAH features altogether (Malkan & Stecker, 1998, 2001). It is trivial to show that this makes a critical difference in the quality of the fits to the ISOCAM mid-infrared number counts and therefore affects the evolution parameters particularly at . So, it is important to have template SEDs that reproduce the observed trend in the luminosity of local galaxies at different wavelengths.
Using MIR, FIR and submillimeter data from ISOCAM, IRAS and SCUBA observations of nearby galaxies, we fit the observed trend between different mid- and far-infrared luminosities as shown in Figure 3. The top two panels in the figure show the ISOCAM observations at 6.7 m and 15 m for 50 IRAS galaxies which are described in Chanial et al. (2001). The solid lines in the panels show two first order polynomial fits, one for galaxies with 15 m luminosity less than and another for more luminous galaxies. This is because the ratio between the mid-infrared luminosities changes as a function of 15 m luminosity, possibly due to enhanced emission from the VSG component (Laurent et al., 2000). The luminosity break corresponds to which is similar to the luminosity cutoff used for deriving Equations 4-6. The panel showing the 15 m to 60 m trend consists of data described in Figure 2. The 60 m to FIR correlation is for the IRAS BGS and PSCz galaxies while the panel showing the IR to FIR correlation is only for the IRAS BGS galaxies. The last panel shows SCUBA submillimeter data on 100 IRAS galaxies (Dunne et al., 2000). In addition, the correlation between IRAS 25 m and 100 m luminosities for galaxies in the BGS was also determined. The solid lines for the four lower panels utilize only a single first order polynomial fit to all the data points. Also shown in the panels as red triangles are the luminosities at the corresponding wavelength for the different templates that were generated as described below.
Template spectral energy distributions (SEDs) were generated between 0.1 and 1000 m to reproduce the observed trend between mid-infrared and far-infrared luminosities. To generate these templates, we used the basic Silva et al. (1998) models to reproduce the ultraviolet-submillimeter SED of 4 prototypical galaxies: Arp220, NGC6090, M82 and M51. These correspond to objects of four different luminosity classes - ULIGs, LIGs, “starbursts” (SB) and “normal galaxies” respectively. ISOCAM CVF observations between 3 and 18 m of these galaxies provided new data on the relative strength of the mid-infrared features and continuum (Charmandaris et al., 1999; Laurent et al., 2000; Forster-Schreiber et al., 2001; Roussel et al., 2001). The mid-infrared region of the modelled spectra were then replaced with the ISOCAM observations. In addition, corrections were made for the 17.9 m silicate feature based on observations by Smith et al. (1989). The four template spectra were checked to ensure that the IRAS observed values of these four galaxies were reproduced. We then partitioned the four templates into a mid-infrared (420 m) and far-infrared (201000 m) component and interpolated between the four to generate a range of mid-infrared and far-infrared sample templates of intermediate luminosity. An additional set of far-infrared templates provided by Dale et al. (2000) were added to the ensemble of far-infrared templates to span a wider range of spectral shapes.
For each luminosity bin of the 15 m luminosity function, the luminosity at the following wavelengths: 6.7, 12, 25, 60, 100, 850 m was predicted based on the polynomial fits to the data shown in Figure 3. Of the mid-infrared sample templates generated as described above, the mid-infrared template that best fits the predicted 6.7, 12 and 15 m luminosities was selected. Similarly, the far-infrared template that best fits the predicted 25, 60, 100 and 850 m luminosities was selected. The luminosity of the templates at the corresponding wavelengths was determined by integrating over the filter curves of the instruments. Our goal was only to generate SEDs that reproduce the observed trend in luminosities at different wavelengths. Selecting a variety of sample templates provided better fits to the predicted luminosities than by just interpolating between the four SEDs generated by the Silva et al. (1998) models. The best fitting mid-infrared and far-infrared templates were then merged together to provide the final template SED for each luminosity bin. The red triangles in Figure 3 are the luminosities at the corresponding wavelengths from the final merged template SEDs. The band luminosity of galaxies in the IRAS BGS shown in Figure 1 was also used to constrain the optical/near-infrared spectral energy distribution of galaxies but as stated before, we have not constrained the UV slope of the template SEDs. The absence of a good correlation between the band and IR luminosities implies that the optical/near-infrared part of our SEDs is highly uncertain. This is not a major problem since we are only analyzing the dust emission in this paper. The templates for three objects with infrared luminosities of and along with the predicted luminosities at different wavelengths based on the correlations in Figure 3 are shown in Figure 4.

3 Evolution of the 15 m and Far-Infrared Local Luminosity Function
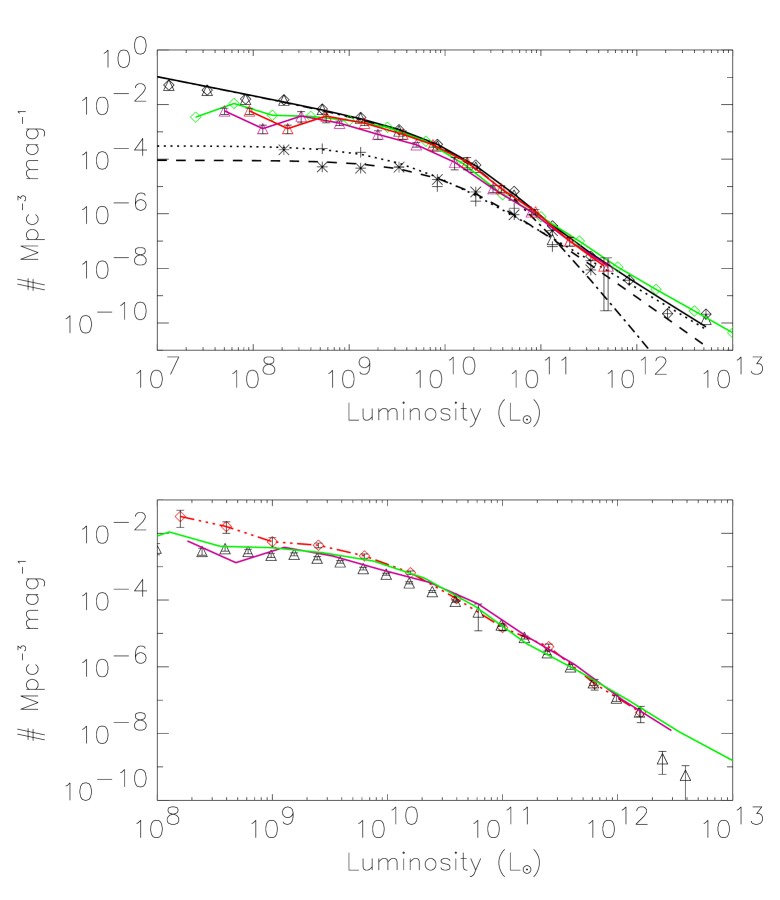
Since our intention is to use the different mid- and far-infrared observational constraints to estimate the evolution of the dust enshrouded star formation rate with redshift, we use the 15 m LLF as a tracer of dust emission in the local universe. Xu et al. (1998) and Xu (2000) derived a 15 m LLF based on a correlation between ISOCAM mid-infrared and IRAS mid- and far-infrared data. In addition, estimates of the 12 m LLF have been made by Rush, Malkan & Spinoglio (1993) and Fang et al. (1998). The different 12 m and 15 m luminosity functions are shown in Figure 5. Also shown is the predicted 60 m LLF derived from the mid-infrared LLF using a mid-infrared to 60 m conversion from the polynomial fit to the observations of Aussel et al. (2000) and Chanial et al. (2001) described earlier. All these are in good agreement with each other since they were essentially derived from IRAS observations of nearby galaxies.
Evolution of the luminosity function with respect to redshift can be expressed as:
| (7) | |||||
| (8) |
where is the number density of galaxies as a function of luminosity and redshift . The term represents evolution in the number density of galaxies while the term represents luminosity evolution. is the local luminosity function. We consider models where is of the form up to a turnover redshift followed by up to . The luminosity evolution component up to followed by .
It should be emphasized that there is considerable degeneracy in the density and luminosity evolution of galaxies. While density evolution slides the luminosity function along the vertical axis, the latter slides it on the horizontal axis. However, current observations at mid- and far-infrared wavelengths detect galaxies only at the luminous end of the luminosity function, as a result of which the two are indistinguishable. This is shown in Figure 6. The figure also shows that evolving just the luminous end of the LLF i.e. similar to the model proposed by Dole et al. (2000) would result in the same degeneracy with observations although it would result in a somewhat unphysical break in the luminosity function.
There is an additional degeneracy induced by the fraction of the luminosity function that is evolving. Redshift measurements of ISOCAM 15 m sources in the HDFN+FF indicate that the majority of them are LIGs and ULIGs (Elbaz et al., 2001). Interestingly, when the local 60 m luminosity function is compared to the Schechter function commonly used to represent the local luminosity function at visible wavelengths, an excess of galaxies is seen in the 60 m LLF beyond since the Schechter function drops faster at the bright end. On one hand it seems likely that just this excess of galaxies, most of which show morphological signatures of merger activity, could be evolving at high redshift. Alternatively, it is possible that a luminosity dependent fraction which approaches 100% at of the LLF could be evolving. Unfortunately, the observational constraints on the faint end of the IRLF are limited since these galaxies are undetected at mid- and far-infrared wavelengths at . The correlation between mid-infrared and visible wavelengths being poor, the counts of galaxies at visible/near-infrared wavelengths cannot be used to constrain the distribution. However, we will investigate in a future paper if the relationship between the FIR/UV flux ratio and UV slope can constrain the evolution of the faint end of the IRLF.

The principal observational constraints on the evolution of the bright end of the luminosity function then are:
-
•
The ISOCAM differential number counts at 15 m especially the “knee” in the counts slope at 0.4 mJy (Elbaz et al., 1999),
-
•
The 15 m extragalactic background light which has a lower limit from ISO counts and an upper limit from gamma-ray observations of a TeV flare in Markarian 501,
- •
-
•
The spectrum of the cosmic far-infrared background between 100 and 850 m as measured by DIRBE and FIRAS on COBE,
- •
The correction of galaxies illustrated in Figure 7 clearly illustrates the range of redshifts that can be studied by observations at these wavelengths. The 850 m observations are typically confusion limited at 2 mJy. However, deeper lensed surveys or using high resolution radio interferometric data can push the detection threshold down to 0.5 mJy, past the confusion limit. This allows detection of objects with out to which transforms to a star-formation rate of 85 . On the other hand, the ISO mid- and far-infrared observations are typically dominated by galaxies at and so can constrain the low redshift turnover in the luminosity function evolution.

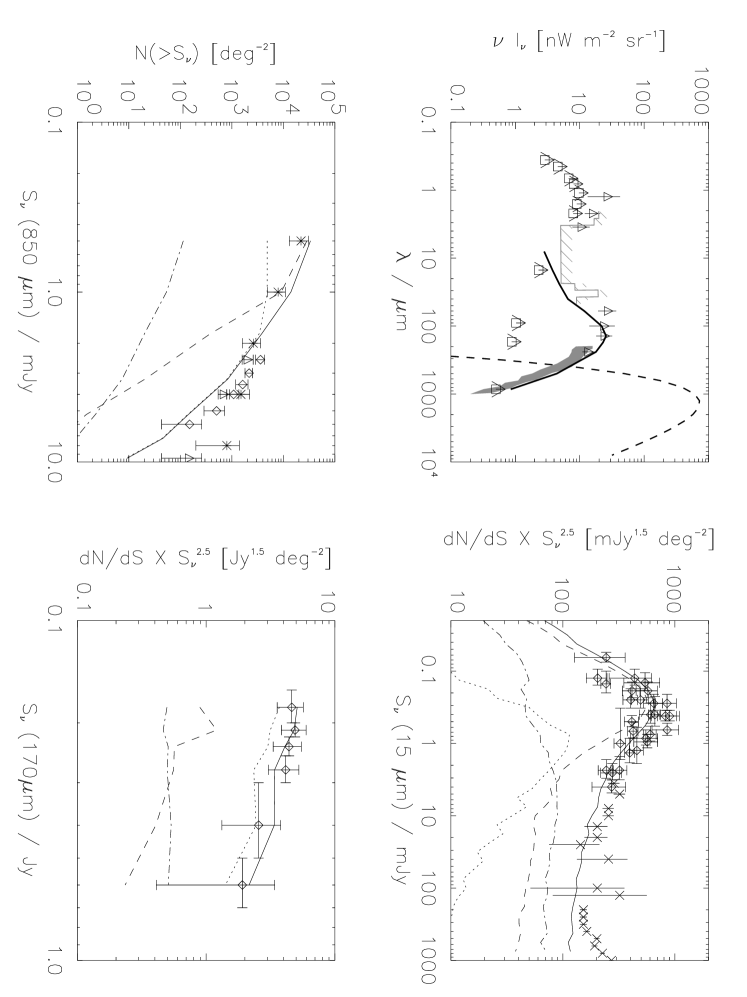
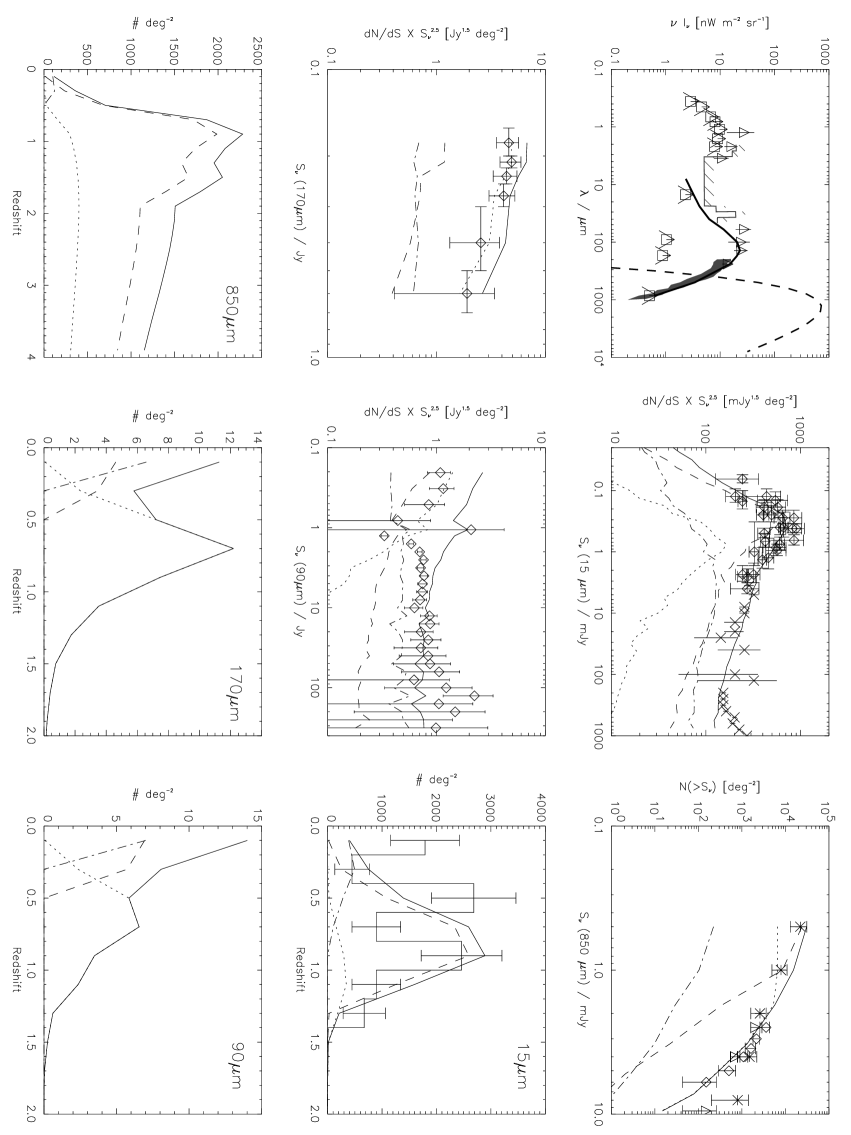
Figure 8 illustrates the nature of the counts if the 15 m luminosity function remained equal to the local one at all redshifts, i.e. no evolution. The first plot shows the ISOCAM 15 m differential counts from Elbaz et al. (1999), which include the IRAS 12 m counts converted to 15 m by Xu (2000) and the ELAIS 15 m counts of Serjeant et al. (2000) renormalized as in Genzel & Cesarsky (2000). The remaining plots show the ISOPHOT FIRBACK 170 m counts, ISOPHOT, IRAS BGS and PSCz 90 m counts and SCUBA 850 m integral counts. Also shown are the relative contributions from ULIGs, LIGs and galaxies to the counts at different wavelengths444 From now on we refer to the galaxies as normal/SB galaxies. Clearly, some form of redshift evolution in the luminosity function is required to fit the counts. It should be emphasized that evolutionary models should be fit to the differential counts at different wavelengths since integral counts tend to smooth over any subtle changes in the galaxy counts slope. This requires that the calibration of the data from different surveys using the same instrument be consistent and accurate.
The ISOPHOT 90 m data are known to suffer from large calibration uncertainties which are not reflected in the error bars. We show in Section 3.3 that our models fit the 170 m counts but consistently overpredict the 90 m counts although both wavelengths probe similar populations of galaxies at . We find that an upward correction of the 90 m flux densities by 30%, which is well within the calibration uncertainties, leads to excellent agreement between our models and the data. In addition, the faint end PSCz counts are known to suffer from incompleteness (Efstathiou et al., 2000).

Any evolution of the luminosity function must have a turnover at some redshift to avoid overproducing the CIRB. In theory, the turnover redshifts (), the value for the slope of the density (luminosity) evolution at and the value for can be different implying that there are effectively six parameters. We however consider models with = since it is unclear why the turnover for luminosity and density evolution, both of which are probably induced by galaxy interactions, should be different. The range of values for , and selected for our models were , and respectively. Evolutionary models with pure luminosity evolution and pure density evolution are also considered.
3.1 Constraints on Pure Density Evolution
We find that pure density evolution of the entire luminosity function cannot reproduce the counts at all the wavelengths. In this scenario, the 15 m counts are dominated by the normal/SB galaxies, not by LIGs and ULIGs, which is inconsistent with observations in the HDFN+FF. Secondly, the normal/SB galaxies are unable to reproduce the break in the 15 m counts seen at 0.4 mJy but instead produce a sharp break only at mJy.
However, density evolution models which evolve just a fraction of the 15 m luminosity function with the fraction being 5% at and approaching 100% at 15 m luminosities greater than 810 provide reasonable fits to the data (red broken line in Figure 14). The best fit density evolution parameters then are up to followed by (Figure 9). The first plot shows the spectrum of the cosmic infrared background with lower limits from integrated counts of galaxies in the optical/UV from Madau & Pozzetti (2000), measurements in the near- and far-infrared using the DIRBE instrument (Hauser et al., 1998; Finkbeiner et al., 2000; Gorjian, Wright & Chary, 2000; Wright, 2001), an estimate of the far-infrared background from FIRAS (Lagache et al., 1999), and lower limits in the mid-infrared, far-infrared and submillimeter from counts of individual galaxies (Elbaz et al., 1999; Blain et al., 1999a; Matsuhara et al., 2000). Also shown is the upper limit on the CIRB from TeV observations of Mrk501 (Stanev & Franceschini, 1998) and the cosmic microwave background at m. The remaining plots show the counts for this evolution model.
Models with result in a significant overprediction of the 170 m counts while underpredicts the submillimeter counts. Changing the turnover redshift to high redshift shifts the knee in the 15 m differential counts to fainter flux levels and vice-versa. The slope of the evolution at is mainly constrained by the spectrum of the CIRB at m and the 850 m counts.
The 170 m, 90 m and 15 m observations all probe the population of galaxies at . However, in this density evolution model, the 15 m counts are dominated (90%) by LIGs and have 5% contribution from ULIGs. In comparison, the 170 m counts are dominated by ULIGs at redshifts between 0.51 while the 90 m counts have roughly equal contributions from all three populations of galaxies. The 850 m galaxies at flux densities larger than 1 mJy are mainly ULIGs at while LIGs between redshifts of dominate the counts at fainter flux levels.
The pure density evolution model shown appears to overpredict the contribution from LIGs (90%) to the 15 m number counts and underestimates the bright end 850 m counts. Secondly, many LIGs and ULIGs have been morphologically associated with disturbed systems. So a steep evolution in the density of objects should reflect in an increase of the merger fraction which is defined as the fraction of galaxies in close pairs. Observationally, the merger fraction when averaged over all galaxies appears to evolve much slower with redshift, approximately as (e.g. Le Fevre et al., 2000). It is possible though that the LIGs and ULIGs have a merger fraction that increases much more rapidly than but this has not been estimated since there are no clear observational signatures of LIGs and ULIGs at visible wavelengths. Although there is no strong observational evidence in favor of pure density evolution of a fraction of the luminosity function, we show in Figure 14 that it does predict the same number density of infrared luminous galaxies at high redshift as other models and so cannot be entirely ruled out.
3.2 Constraints on Pure Luminosity Evolution
We have shown above that some form of luminosity evolution is required to avoid deriving large values for the slope of the density evolution. The slope of the luminosity evolution is strongly constrained by the mid-infrared number counts. Values of are unable to reproduce the break of the differential counts seen at a 15 m flux density of 0.4 mJy while results in an overproduction of the counts at bright flux densities (Figure 10). If the entire LLF is evolved (solid black line in Figure 14), up to =0.8 followed by , the 90 m differential counts are overproduced but all the other counts are reproduced very well.
This is only partially consistent with the results of Xu (2000) who suggested that the mid-infrared counts can be modelled by evolving the entire LLF by for and by for higher redshifts. We find that a luminosity evolution of up to followed by overpredicts the CIRB and provides only marginal fits to the mid-infrared counts at the faint end. Extending this evolution up to severely overpredicts the CIRB as well as the observed faint end 15 m and 850 m counts.
The main problem with pure luminosity evolution is that the 90 m counts at Jy are overproduced but as mentioned earlier, this can be resolved by rescaling the ISOPHOT 90 m flux densities upwards by 30% which is within the calibration uncertainties of the instrument. In addition, the break in the 15 m differential counts in this evolution model is not as sharp as observed.
As in the pure density evolution model, the counts at 15 m, 90 m and 170 m all trace galaxies at but the relative contributions from LIGs, ULIGs and normal/SB galaxies differ, with the 90 m counts having roughly equal contributions from all three populations, the 170 m counts being dominated by ULIGs and the 15 m counts being dominated by LIGs and low redshift normal/SB galaxies. Pure luminosity evolution predicts that the contribution from normal/SB galaxies to the 15 m counts between 0.1 and 0.4 mJy is 35%, similar to that observed in the HDFN+FF. However, the contribution from ULIGs in the same flux density range is found to be only 6% in this model; a factor of smaller than that observed.

3.3 Combination of Luminosity and Density Evolution
We have already illustrated the degeneracy and problems with pure luminosity and pure density evolution in the fits to the number counts. As illustrated above, both of them provide reasonable fits to the spectrum of the CIRB and to the differential counts at three wavelengths. An additional degeneracy is introduced when using a combination of luminosity and density evolution with only a fraction of the LLF evolving.
The fraction of the LLF that is evolving is defined as the “dusty starburst” population. We consider these to be galaxies with . This corresponds to . All galaxies with are then evolved while only about 5% of the galaxies with (“normal” galaxy population) is evolved, with a smooth transition between the two (purple broken line in Figure 14). We also considered models where the dusty starburst population is defined at a larger minimum luminosity () but were unable to find evolution parameters that could reasonably reproduce all the data.
Our best fit model using a combination of both density and luminosity evolution for a fraction of the LLF as defined above is shown in Figure 11. Almost all the counts are reproduced quite well, with the exception of the 90 m counts from ISOPHOT and PSCz which all our models consistently over estimate. We interpret this to be due to a calibration error in the ISOPHOT data as a result of which the published flux density values are low by 30%. Also shown in the figure is the surface density of galaxies per redshift bin contributing to the counts at different wavelengths, as derived from the model, and the observed redshift distribution of the ISOCAM 15 m galaxies in the HDFN+FF (Aussel et al., 2001). The size of each redshift bin is 0.2.
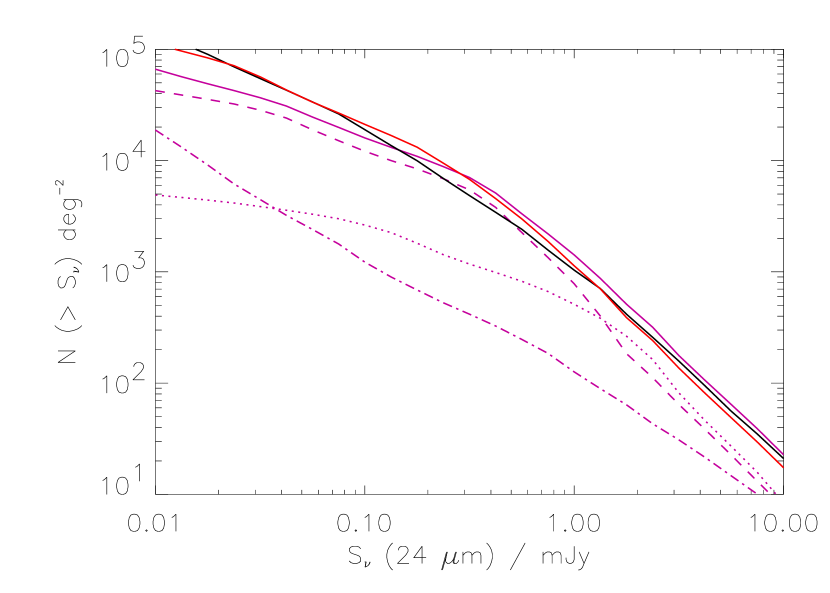
In the preceding three subsections, we have shown a range of models that evolve the local 15 m luminosity function and fit the observed counts at mid- and far-infrared wavelengths as well as the spectrum of the CIRB. Ultradeep SIRTF observations at 24 m can potentially break the degeneracy in these models if the counts can be determined to an accuracy of 20% or better (Figure 12). The range of integral source counts that we predict based on our three evolutionary models (density, luminosity and combination of both) are 4.7, 3.8 and 3.7 per for Jy and 19.8, 19.3 and 11.8 per for Jy respectively. However, the integral counts can be as low as 9.1/ at a flux density limit of 22 Jy for models which are at the extreme lower limit of the uncertainty in current observations.
4 The Origin of the CIRB
4.1 Nature of the Galaxies Contributing to the CIRB
In our evolution models, we have assumed that the contribution from AGN to the counts and the cosmic background is insignificant. Other evolutionary models, which assumed an AGN component, arrived at the same conclusion (Malkan & Stecker, 1998; Rowan-Robinson, 2000; Xu et al., 2000; Franceschini et al., 2001). Observational evidence for this assumption comes from deep Chandra observations of the HDFN proper (Brandt et al., 2001) which detected 8 of the ISOCAM 15 m sources. However, only one of these is an AGN at 1 and this was already known as such from observations at visible wavelengths (see discussion in Elbaz et al., 2001; Aussel et al., 2001). It should be noted that it is insufficient to have an AGN in a galaxy to violate this assumption but that the integrated infrared light of the galaxy must be dominated by an AGN rather than by star formation. However, since the contribution of dust obscured AGN at high redshift, beyond ISOCAM detection thresholds, is unknown, our results are subject to this uncertainty. A large ( 20%) contribution from AGN to the source counts or the CIRB will imply a weaker redshift evolution of the luminosity function.
The evolution parameters in our model are constrained strongly by the ISOCAM counts at and by the SCUBA counts at . In addition, the ISOCAM counts are dominated by LIGs while the SCUBA counts are dominated by ULIGs. Thus, barring a dramatic change in the ratio of LIGs to ULIGs between a redshift of 1 and 2, we conclude that our models have robustly determined the evolution of the luminous end () of the LLF up to . At , the best constraint comes from the spectrum of the CIRB. Since all our models which are almost flat beyond provide values for the CIRB that are at the upper limit of the values observed by FIRAS, we conclude that these models place a strong upper limit on the estimate of dust enshrouded star formation at .
| Wavelength | Contribution from galaxies | ||
|---|---|---|---|
| nW m-2 sr-1 | |||
| Observed | Model | ||
| 15 m | 2.40.5 | 3.2 | 90% |
| 24 m | … | 4.2 | 83% |
| 140 m | 257 | 23.1 | 82% |
| 240 m | 143 | 15.1 | 67% |
| 850 m | 0.50.2 | 0.63 | 28% |
| Source Type | Contribution |
|---|---|
| ULIGs | 25% |
| LIGs | 60% |
| galaxies | 15% |
| ISOCAM galaxies with mJy | 63% |
| ISOCAM galaxies with mJy | 73% |
| SCUBA galaxies with mJy | 15% |
| SCUBA galaxies with mJy | 71% |
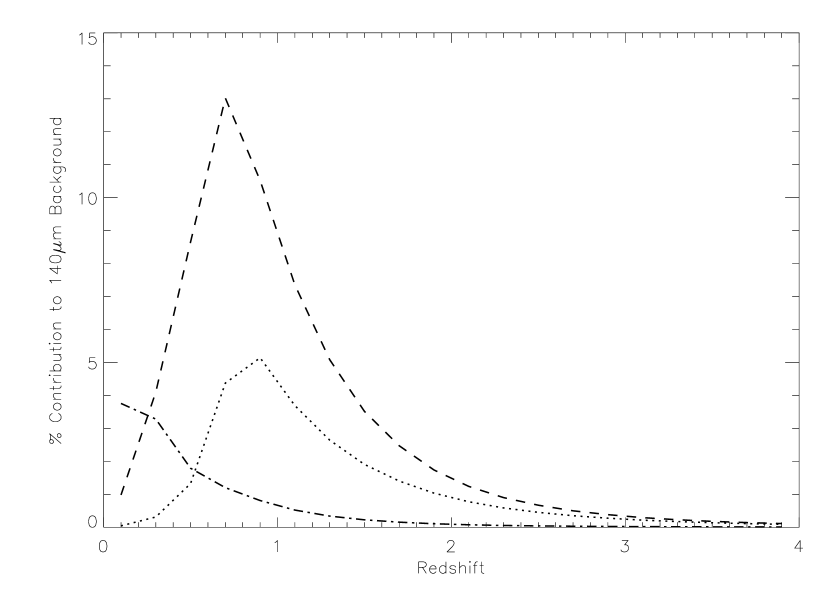
Our models indicate that about 80% of the 140 m CIRB is produced at . In comparison, 90% of the 15 m EBL, 65% of the 240 m background and only about 30% of the 850 m background, is produced within this redshift range (Table 1). We also derive that ISOCAM galaxies brighter than 0.1 mJy contribute 14.5 nW m-2 sr-1 to the 140 m EBL, while galaxies brighter than 0.05 mJy produce 16.8 nW m-2 sr-1. This accounts for about 75% of the total far-infrared background (Table 2). In comparison, we find that the contribution from SCUBA detected galaxies brighter than the confusion limit of 2 mJy at 850 m is only 3.4 nW m-2 sr-1 at 140 m while galaxies brighter than 0.5 mJy produce 16.4 nW m-2 sr-1. This is because at 850 m flux densities fainter than 1 mJy, the LIGs which dominate the ISOCAM counts and produce the majority of the 140 m EBL contribute significantly to the SCUBA counts. The total EBL at 15 m from our model is 3.2 nW m-2 sr-1. The EBL obtained by integrating the observed ISOCAM counts above 50 Jy is 2.40.5 nW m-2 sr-1 (Elbaz et al., 2001), hence as much as 7315% of the 15 m background might have already been resolved by ISOCAM. The models indicate that ULIGs contribute 15% of the 15 m EBL observed by ISOCAM above 0.1 mJy, LIGs about 65% and normal and low luminosity starburst galaxies the balance. In comparison, at 140 m, we find that ULIGs contribute 25% of the CIRB, LIGS contribute 60% and normal/SB galaxies the balance (Figure 13). Thus, infrared luminous galaxies which appear to be indistinguishable from normal galaxies in terms of their optical/near-infrared luminosity and form a negligible part of the energy budget in the local universe, dominate the star formation and therefore the energy budget at redshifts .
4.2 Infrared Luminosity Function and the LBG Connection
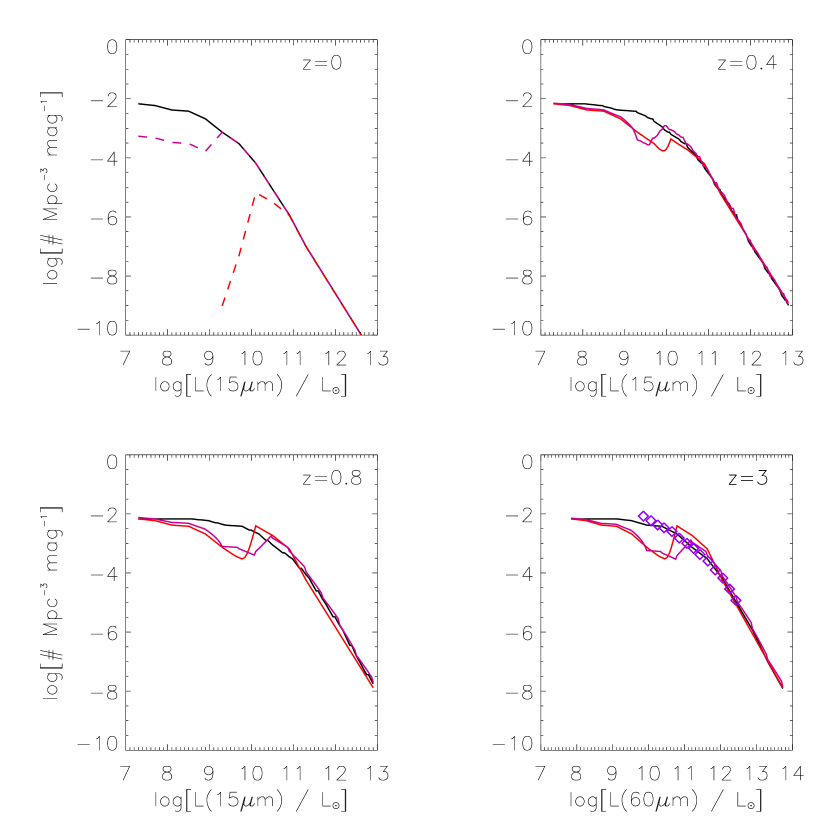
The first panel of Figure 14 shows the 15 m local luminosity function (LLF) along with the fraction of galaxies that are evolved in the different models. For the density evolution model, the broken red line is evolved. For the luminosity evolution model, the whole 15 m LLF shown as the solid black line, is evolved. For the model with density+luminosity evolution, the broken purple line is evolved. In the pure density evolution and density+luminosity evolution model, there is a non-evolving component with a constant comoving density which corresponds to the difference between the total LLF and the evolving component.
Although the fraction of the luminosity function that is evolving and the evolutionary parameters are significantly different in our three evolutionary scenarios, we find that our models predict similar comoving number densities of infrared luminous galaxies at high redshift. This is illustrated in two panels of Figure 14 which show the derived 15 m luminosity function at redshifts of 0.4 and 0.8. The models also provide strong evidence for a change in the shape of the infrared luminosity function. The comoving number density of luminous infrared galaxies has to increase by more than two orders of magnitude between redshifts of 0 and 1, to fit the ISOCAM and SCUBA counts. The faint end of the LLF cannot be enhanced by the same factor since this would lead to an over-production of the CIRB although these galaxies would be below the sensitivity limit of the long wavelength surveys. Lastly, as much as 85% of the far-infrared background can be attributed to infrared luminous galaxies. This implies that the contribution from normal and low-luminosity starburst galaxies () to the dust enshrouded star formation rate is relatively small. So, estimates of the total SFR by applying a constant extinction correction to all optical/UV selected galaxies are incorrect. We conclude that long-wavelength surveys between 15 m and 850 m that probe galaxies at the luminous end of the infrared luminosity function provide a very effective way of tracing the bulk of the dust obscured star formation.
The connection between infrared luminous galaxies and the Lyman-break galaxy (LBG) population is intriguing. Figure 14 shows a comparison between the LBG 60 m luminosity function at of Adelberger & Steidel (2000, hereafter AS00), which was derived based on an extinction correction to optical/UV data as a function of the UV slope of individual galaxies, and our equivalent 60 m luminosity function at , which we have argued earlier is only a strong upper limit. The agreement is extremely good considering that they were estimated in completely independent ways. The AS00 luminosity function predicts almost the same luminosity function as our estimate from the pure luminosity evolution model to within 50%. It is discrepant with the luminosity functions from our other two models by as much as an order of magnitude at the faint end but only a factor of 2 at the bright end. As mentioned earlier, the long wavelength surveys which constrain our models are mainly sensitive to the evolution of galaxies at the bright end of the luminosity function at . We are unable to constrain with much certainty the evolution of the faint end of the luminosity function although we do place an upper limit based on the observed intensity of the CIRB. Furthermore, our estimates at are only a strong upper limit to the number density of infrared luminous galaxies since any further evolution at high redshift overproduces the CIRB at m while a decay in the evolution at as is marginally consistent with both the submillimeter counts and the CIRB spectrum. Thus, we conclude that optical/UV surveys that trace the LBG population at , after an extinction correction factor that spans the range 2100, provide a good estimate of dust obscured star-formation at high redshift. They complement the results of future mid- and far-infrared surveys with SIRTF which will be able to directly observe the dust emission of LBGs with LIG-type infrared luminosities up to .
There is observational evidence for the LBG population to be distinct from the bright ( mJy) submillimeter galaxies (Barger, Cowie, & Richards, 2000; Chapman et al., 2000). This is because most of the bright 850 m galaxies are extreme ULIGs with . The AS00 observations detect only 2 out of 831 galaxies above this detection threshold and only 27 of their LBG sample would have a submillimeter detection above the level of 1 mJy. Secondly, at , 850 m observations would probe rest frame 200 m emission. For a given far-infrared luminosity, the 60 m luminosity shows a factor of 23 less scatter than the 850 m luminosity among local galaxies (Figure 3) suggesting that the m spectral shape of galaxies might potentially have a larger scatter which would lead to uncertain flux estimates on a galaxy by galaxy basis. Lastly, we do not find any scenario where the contribution from ULIGs is greater than 30% of the comoving star formation rate at . Naturally, the contribution from extreme ULIGs traced by the bright submillimeter galaxies is even smaller. Thus, although the contribution to the star formation rate density from extreme ULIGs is missed in observations of the LBG population, their contribution is significant only at the level of 10% and hence they are less important to an estimate of the high-redshift dust obscured star formation.
4.3 The Revised Star Formation History of the Universe
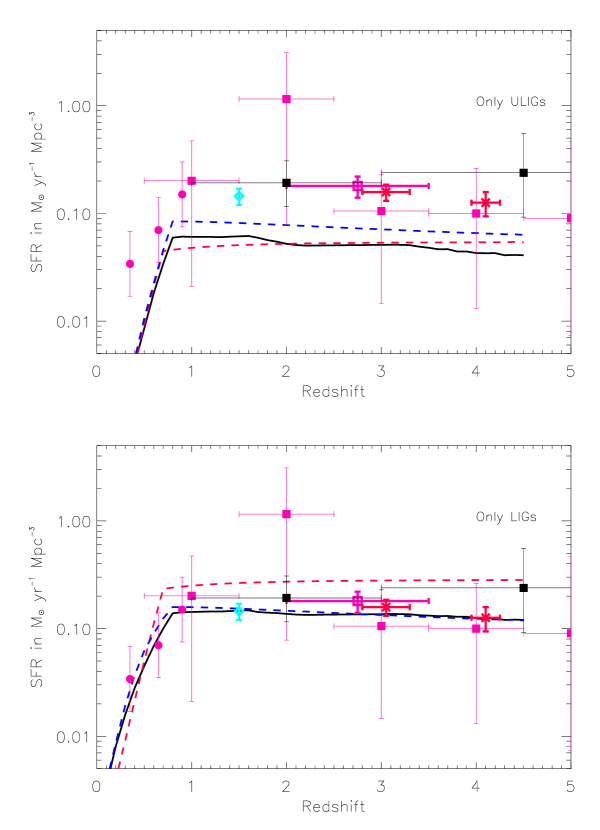
Having constrained the evolution of the mid-infrared and thereby the far-infrared luminosity functions, we can derive the evolution of the dust enshrouded star formation rate with redshift. Using the equations listed in Section 2, our derived comoving SFR from all galaxies is shown in Figure 15 while the separate contribution from LIGs and ULIGs is shown in Figure 16. Figure 15 also shows the absolute minimum and maximum range of dust obscured star formation rate values. The maximum values are derived from models which marginally overproduce the CIRB and the counts. The minimum values are derived by using an evolutionary model which is marginally consistent with the observations (Section 4.2) and by only considering the contribution from LIGs and ULIGs since those are the only galaxies which are directly observed at high redshift in the 15 m and 850 m surveys. Also shown is the SFR as inferred from direct observations at visible/UV/near-infrared wavelengths (Lilly et al., 1996; Madau et al., 1996; Connolly et al., 1997; Cowie, Songaila & Barger, 1999; Steidel et al., 1999; Yan et al., 1999), SFR estimates obtained from extinction corrections to these observations (Madau, Pozzetti, & Dickinson, 1998; Meurer et al., 1999; Steidel et al., 1999; Thompson, Weymann & Storrie-Lombardi, 2001), and SFR derived from ISOCAM observations of the Canada France Redshift Survey (CFRS) field (Flores et al., 1999). In addition, lower limits to the SFR from radio measurements and two points representing the completeness corrected submillimeter observations are also shown (Barger, Cowie, & Richards, 2000). The 1 uncertainty in our derived rate is about 50% and is primarily dependent on the transformation from 15 m to infrared luminosities which as derived earlier has a 1 of 40%, and the transformation from infrared luminosities to star formation rate which assumes a Salpeter initial mass function (IMF) and also has an uncertainty of about 30% (Kennicutt, 1998).
The dust enshrouded SFR density peaks at a redshift of 0.80.1 with a value of 0.25. In a (0.3,0.7,75) cosmology this corresponds to 6.2 Gyr after the Big Bang. The dusty SFR then remains almost constant up to which corresponds to an age of 3 Gyr beyond which this value provides a strong upper limit to the amount of dust obscuration. This is similar to the shape of the star formation history preferred by Sadat, Guiderdoni & Silk (2001) in their analysis of the CIRB. Our values are a factor of 2 larger than estimates at from observations by Yan et al. (1999) and a factor of 3-7 larger than extinction uncorrected optical/UV observations at . The models are in excellent agreement with the submillimeter data corrected for incompleteness (Barger, Cowie, & Richards, 2000) but are higher than the Steidel et al. (1999) extinction corrected points. The values we derive are systematically higher than those in Gispert, Lagache & Puget (2000) but within the uncertainties especially if the difference in the -to-SFR calibration coefficient is factored in. Our models also indicate a faster evolution at than the models of Blain et al. (1999b) which is not surprising since they did not use the ISOCAM data to constrain their low redshift evolution. However, our high redshift plateau is similar to their ‘Anvil-10’ model.
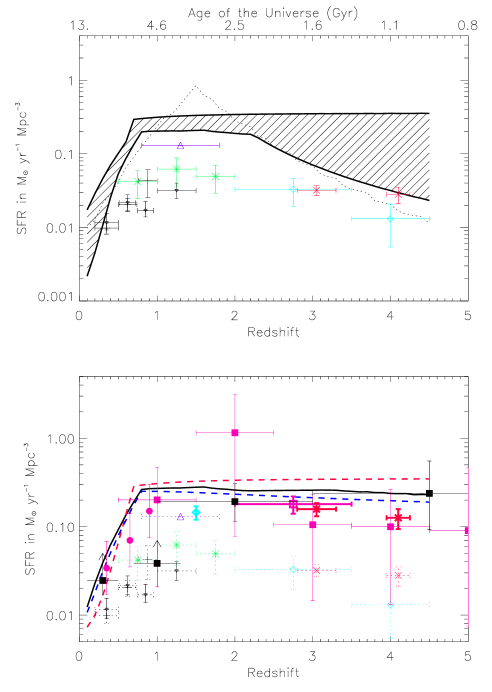
Recently, Xu et al. (2000) has developed a multiparameter model where the 25 m luminosity function of Shupe et al. (1998) is partitioned into three components - starburst, late-type galaxies and AGN and each component is evolved independently of the other. Specifically, they evolved the starburst population in luminosity as and in density as out to . The late-type galaxy population was evolved in luminosity as while the galaxies with AGNs evolve in luminosity as . Beyond , all the components drop-off as . Using a 25 m to IR luminosity conversion based on IRAS data, we have converted their evolution for starburst and late-type galaxies into a star formation rate and compared it with ours. This is shown as the black dotted line in the upper plot of Figure 15. We find that their derived rates between redshifts of 1 and 2.5 are inconsistent with our models. The motivation for this peak is not clear since only the CIRB and the SCUBA counts place constraints on the evolution at this redshift range and both can be reproduced very well by an almost flat evolutionary history at (See Section 3). However, their evolution at agrees reasonably well with ours since both are principally constrained by the 15 m ISOCAM counts. Furthermore, their decline in the SFR at high redshift () is similar but below our lower limit.
By integrating our comoving star formation rate density over redshift and thereby cosmic time, we can derive the density of stars and stellar remnants and compare it with the total baryon density in the local Universe. Stellar lifetimes were chosen for solar metallicity stars (Bressan et al., 1993) while the mass of remnants was chosen using the recipe of Prantzos & Silk (1999, and references therein). If a Salpeter IMF is assumed, then the model predicts a local density of baryons of about 1.0 which is a factor of 2 in excess of the value of 53 estimated by Fukugita, Hogan & Peebles (1998). The model also predicts that 100% of the local stars and remnants would have been produced at a redshift . If we instead use the shape of the IMF below 1 M☉ suggested by Gould, Bahcall & Flynn (1996) which reduces the number density of low mass stars, then the density of stars and remnants resulting from the model is 7.5, in agreement with the local density. Madau & Pozzetti (2000) argued for a similar IMF based on their analysis of the total extragalactic background light. Interestingly, our model predicts that the local baryon density in stars and remnants, derived by integrating the star formation in ULIGs with a redshift distribution as shown in Figure 16, is similar to that seen in local spheroids, suggesting that high redshift infrared luminous galaxies may be the progenitors of present day spheroids.
5 Conclusions
A variety of observational data at mid-infrared through submillimeter wavelengths trace the fraction of emission from stars that is thermally reprocessed by dust. By using the counts of galaxies at these wavelengths, it is possible to estimate the amount of star formation that is enshrouded by optically thick HII regions and thereby invisible to observations at ultraviolet and visible wavelengths. In addition, the spectrum of the cosmic infrared background at mid- and far-infrared wavelengths places an upper limit on the fraction of starlight that has undergone thermal reprocessing by dust.
We have developed a set of template spectral energy distribution (SEDs) for galaxies as a function of infrared luminosity, which reproduce existing data at 0.44, 7, 12, 15, 25, 60, 100, and 850 m from ISO, IRAS and SCUBA on nearby galaxies. The 15 m local luminosity function was then evolved with redshift, considering both luminosity and density evolution models into account, and using the template SEDs to fit the observed counts at 15 m, 90 m, 170 m and 850 m. A number of evolutionary models provide reasonable fits to the data and the spectrum of the CIRB. The principal reason for this is that all the long wavelength surveys are typically sensitive to only the most luminous galaxies () at . So, evolutionary models that result in similar luminosity functions at are degenerate. However, our models accurately constrain the comoving number density of these luminous galaxies as a function of redshift. In the local universe, it is these galaxies, many of which show morphological signatures of interaction, that show an infrared-determined star formation rate (SFR) that is about an order of magnitude higher than the corresponding UV-determined SFR. By integrating the infrared luminosity of these luminous galaxies we then obtain an estimate of the dust enshrouded star formation rate. The dust enshrouded star formation rate density appears to peak at a much lower redshift than previously thought, at with a value of 0.25 and remains approximately constant at least till . Any drop off at a lower redshift would result in an underestimate of the 850 m galaxy counts. Although our models do not constrain the evolution of the faint-end () of the luminosity function, their net contribution to the high-redshift dust enshrouded star-formation is negligible as can be seen in the range of evolutionary models considered. The evolution at is constrained much more weakly. Having a constant SFR between redshifts of 0.8 and 4 is consistent with the CIRB spectrum and the submillimeter counts as is a decay by a factor of 7 between redshift 2 and 5. However, we find that there is excellent agreement between our luminosity function and the infrared luminosity function derived from extinction correction to optical/UV observations of Lyman-break galaxies at . This suggests that dust obscuration is significant even at and that the dust enshrouded star formation rate is constant to within a factor of 2 between redshifts 2 and 4.
The models also provide a census of the luminosity of galaxies that contribute to the counts at different wavelengths, their redshift distribution and the relative contribution to the cosmic infrared background at m as a function of redshift. Furthermore, we find that ultradeep observations with SIRTF at 24 m down to a sensitivity of 25 Jy can potentially break the degeneracy in the evolutionary models by detecting galaxies with out to , well beyond the turnover redshift of 0.8 that is derived from our models.
References
- Adelberger & Steidel (2000) Adelberger, K., & Steidel, C. C., 2000, ApJ, 544, 218
- Altieri et al. (1999) Altieri, B., et al., 1999, A&A, 343, 65
- Aussel et al. (2000) Aussel, H. A. et al., 2000, A&AS, 141, 257
- Aussel et al. (2001) Aussel, H. A. et al., 2001, A&A, in preparation
- Barger, Cowie, & Sanders (1999) Barger, A. J., Cowie, L. L., & Sanders, D. B., 1999, ApJ, 518, L5
- Barger, Cowie, & Richards (2000) Barger, A. J., Cowie, L. L., & Richards, E. A., 2000, AJ, 119, 2092
- Blain et al. (1999a) Blain, A. W., Kneib, J.-P., Ivison, R. J., Smail, I., 1999a, ApJ, 512, L87
- Blain et al. (1999b) Blain, A. W., Smail, I., Ivison, R. J., Kneib, J.-P., 1999b, MNRAS, 302, 632
- Brandt et al. (2001) Brandt, W. N., et al., 2001, AJ, submitted (astro-ph/0102411)
- Bressan et al. (1993) Bressan, A., et al., 1993, A&AS, 100, 647
- Chanial et al. (2001) Chanial, P., et al., 2001, A&A, in preparation
- Chapman et al. (2000) Chapman, S. C., et al., 2000, MNRAS, 319, 318
- Chapman et al. (2001) Chapman, S. C., et al., 2001, ApJ, submitted (astro-ph/0011066)
- Charmandaris et al. (1999) Charmandaris V., Laurent O., Mirabel I.F., et al., 1999, Ap&SS 266, 99
- Condon (1992) Condon, J. J., 1992, ARA&A, 30, 575
- Connolly et al. (1997) Connolly, A. J., Szalay, A. S., Dickinson, M., Subbarao, M. U., & Brunner, R. J. 1997, ApJ, 486, L11
- Cowie, Songaila & Barger (1999) Cowie, L. L., Songaila, A., & Barger, A., 1999, AJ, 118, 603
- Dale et al. (2000) Dale, D. A., et al., 2000, ApJ, submitted (astro-ph/0011014)
- Désert et al. (1990) Désert, F.-X., Boulanger F., Puget J. L., 1990, A&A 237, 215
- Dole et al. (2000) Dole, H., et al., 2000, to appear in proceedings of ISO Surveys of a Dusty Universe, eds. D. Lemke, M. Stickel, K. Wilke,
- Dole et al. (2001) Dole, H., et al., 2001, A&A, accepted (astro-ph/0103434)
- Dunne et al. (2000) Dunne, L., Eales, S., Edmunds, M., Ivison, R., Alexander, P., Clements, D. L., 2000, MNRAS 315, 115
- Dwek & Arendt (1998) Dwek, E. & Arendt, R. 1998, ApJ, 508, L9
- Eales et al. (2000) Eales, S., et al., 2000, AJ, 120, 2244
- Efstathiou et al. (2000) Efstathiou, A., et al. 2000, MNRAS, 319, 1169
- Elbaz et al. (1999) Elbaz, D., et al., 1999, A&A, 351, L37
- Elbaz et al. (2001) Elbaz, D., et al., 2001, A&A, submitted
- Fang et al. (1998) Fang, F., et al., 1998, ApJ, 500, 693
- Finkbeiner et al. (2000) Finkbeiner, D. P., Davis, M., & Schlegel, D. J., 2000, ApJ, 524, 867
- Fixsen et al. (1998) Fixsen, D. J., Dwek, E., Mather, J. C., Bennett, C. L., Shafer, R. A. , 1998, ApJ, 508, 123
- Flores et al. (1999) Flores, H., et al., 1999, ApJ, 517, 148
- Forster-Schreiber et al. (2001) Forster-Schreiber, N. M., Genzel, R., Lutz, D., Kunze, D., Sternberg, A., 2001, ApJ, in press (astro-ph/0101153)
- Franceschini et al. (2001) Franceschini, A., et al., 2001, in preparation
- Fukugita, Hogan & Peebles (1998) Fukugita, M., Hogan, C. J. & Peebles, P. J. E., 1998, ApJ, 503, 518
- Genzel & Cesarsky (2000) Genzel, R., & Cesarsky, C., 2000, ARA&A, 38, 761
- Gispert, Lagache & Puget (2000) Gispert, R., & Lagache, G., & Puget, J.-L., 2000, A&A, 360, 1
- Gorjian, Wright & Chary (2000) Gorjian, V., Wright, E. L., Chary, R. R., 2000, ApJ 536, 550
- Gould, Bahcall & Flynn (1996) Gould, A., Bahcall, J. N., Flynn, C., 1996, ApJ, 465, 759
- Hauser et al. (1998) Hauser, M. et al., 1998, ApJ, 508, 25
- Hughes et al. (1998) Hughes, D. H. et al., 1998, Nature, 394, 241
- Kennicutt (1998) Kennicutt, R. C., 1998, ARA&A, 36, 189
- Kim & Sanders (1998) Kim, D.-C., & Sanders, D. B., 1998, ApJS, 119, 41
- Lagache et al. (1999) Lagache, G., et al., 1999, A&A, 344, 322
- Laurent et al. (2000) Laurent, O. et al., 2000, A&A, 359, 887
- Le Fevre et al. (2000) Le Fevre, O. et al., 2000, MNRAS, 311, 565
- Lilly et al. (1996) Lilly, S. J., Le Fevre, O., Hammer, F., Crampton, D., 1996, ApJ, 460, L1
- Madau et al. (1996) Madau, P., et al., 1996, MNRAS, 283, 1388
- Madau, Pozzetti, & Dickinson (1998) Madau, P., Pozzetti, L., & Dickinson, M., 1998, ApJ, 498, 106
- Madau & Pozzetti (2000) Madau, P. & Pozzetti, L., 2000, MNRAS, 312, L9
- Malkan & Stecker (1998) Malkan, M. A., & Stecker, F. W., 1998, ApJ, 496, 13
- Malkan & Stecker (2001) Malkan, M. A., & Stecker, F. W., 2001, ApJ, in press (astro-ph/0009500)
- Mathis (1990) Mathis, J. S., 1990, ARA&A, 28, 37
- Matsuhara et al. (2000) Matsuhara, H., et al., 2000, A&A, accepted (astro-ph/0006444)
- Mann et al. (1997) Mann, R. G., et al., 1997, A&A, 289, 482
- Meurer et al. (1999) Meurer, G. R., Heckman, T. M., Calzetti, D., 1999, ApJ, 521, 64
- Meurer et al. (2000) Meurer, G. R., et al., 2000, to appear in Cold Gas and Dust at High Redshift, Highlights of Astronomy, 12, ed. D. J. Willner, astro-ph/0011201
- Mirabel et al. (1998) Mirabel, I. F., et al., 1998, A&A, 333, L1
- Pearson (2001) Pearson, C., 2001, MNRAS, submitted (astro-ph/0011335)
- Prantzos & Silk (1999) Prantzos, N., & Silk, J., 1998, ApJ, 507, 229
- Puget & Leger (1989) Puget, J.-L. & Leger, A., 1989, ARA&A, 27, 161
- Puget et al. (1996) Puget, J.-L., et al. 1996, A&A, 308, L5
- Richards et al. (1998) Richards, E. A., et al., 1998, AJ, 116, 1039
- Rigopoulou et al. (1999) Rigopoulou, D., et al., 1999, AJ, 118, 2625
- Roussel et al. (2001) Roussel, H., et al., 2001, A&A, accepted (astro-ph/0102051)
- Rowan-Robinson (2000) Rowan-Robinson, M., 2000, ApJ, accepted (astro-ph/0012022)
- Rush, Malkan & Spinoglio (1993) Rush, B., Malkan, M. A., & Spinoglio, L., 1993, ApJ, 89, 1
- Sadat, Guiderdoni & Silk (2001) Sadat, R., Guiderdoni, B., & Silk, J., 2001, A&A, 369, 26
- Sanders & Mirabel (1996) Sanders, D. B., & Mirabel, I. F., 1996, ARA&A, 34, 749
- Saunders et al. (1990) Saunders, W., et al., 1990, MNRAS, 242, 318
- Saunders et al. (2000) Saunders, W., et al., 2000, MNRAS, 317, 55
- Schlegel et al. (1998) Schlegel, D., Finkbeiner, D. & Davis, M. 1998, ApJ, 500, 525
- Serjeant et al. (2000) Serjeant, S., et al., 2000, MNRAS, 316, 768
- Shupe et al. (1998) Shupe, D., et al., 1998, ApJ, 501, 597
- Silva et al. (1998) Silva, L., et al., 1998, ApJ, 509, 103
- Smith et al. (1989) Smith, C. H., Aitken, D. K., Roche, P. F., 1989, MNRAS, 241, 425
- Soifer et al. (1986) Soifer, B. T., et al., 1986, ApJ, 303, L41
- Soifer et al. (1987) Soifer, B. T., et al., 1987, ApJ, 320, 238
- Stanev & Franceschini (1998) Stanev, T., & Franceschini, A., 1998, ApJ, 494, L159
- Steidel et al. (1999) Steidel, C. C., et al. 1999, ApJ, 519, 1
- Thompson, Weymann & Storrie-Lombardi (2001) Thompson, R., Weymann, R. J., & Storrie-Lombardi, L., 2001, ApJ, 546, 694
- Tran et al. (2001) Tran, Q. D., et al., 2001, ApJ, accepted (astro-ph/0101187)
- Wright (2001) Wright, E. L., 2001, ApJ, accepted (astro-ph/0004192)
- Wright & Reese (2000) Wright, E. L., & Reese, E. D., 2000, ApJ, 545, 43
- Xu et al. (1998) Xu, C., et al., 1998, ApJ, 508, 576
- Xu (2000) Xu, C., 2000, ApJ, 541, 134
- Xu et al. (2000) Xu, C., et al., 2000, ApJ, submitted (astro-ph/0009220)
- Yan et al. (1999) Yan, L., et al., 1999, ApJ, 519, L47