(richer@astrosen.unam.mx) 22institutetext: Instituto de Astrofísica de Canarias, Vía Láctea, E-38200 La Laguna, Tenerife, Spain (almudena@astroscu.unam.mx) 33institutetext: Instituto de Astronomía, UNAM, Apartado Postal 70-264, Ciudad Universitaria, 04510 México, D. F., México
(georgiev@astroscu.unam.mx, margarit@astroscu.unam.mx) 44institutetext: Institute of Astronomy, Bulgarian Academy of Sciences and Isaac Newton Institute of Chile, Bulgarian Branch, 72 Tsarigradsko chaussèe, BG-1784 Sofia, Bulgaria (jura@haemimont.bg) 55institutetext: Dept. of Physics & Astronomy, York University, 4700 Keele Street, Toronto, Ontario, Canada M3J 1P3
(mccall@aries.phys.yorku.ca, lee@aries.phys.yorku.ca, robin@aries.phys.yorku.ca) 66institutetext: Department of Astronomy and Isaac Newton Institute of Chile, Bulgarian Branch, Sofia University, BG-1164 Sofia, Bulgaria (kurtev@phys.uni-sofia.bg)
IC 10: More evidence that it is a blue compact dwarf
Abstract
We present optical spectroscopy of H ii regions in the Local Group galaxy IC 10 and photometry of foreground stars in three fields towards this galaxy. From these data, we find that the foreground reddening due to the Milky Way is . We find that IC 10 contains considerable internal dust, which qualitatively explains the variety of reddening values found by studies of its different stellar populations. Based upon our foreground reddening, IC 10 has intrinsic photometric properties like those of a blue compact dwarf galaxy, and not those of a dwarf irregular. This result is consistent with much evidence that IC 10 is in the throes of a starburst that began at least ago. We also report the discovery of a new WR star in the H ii region HL111c.
Key Words.:
Galaxies: Individual: IC 10 – Galaxies: Local Group – Galaxies: fundamental parameters – Galaxies: starburst – Galaxies: dwarf1 Introduction
IC 10 has long been recognized as a peculiar object (Hubble Hubble1936 (1936)), and is now considered the Local Group’s representative of a starburst galaxy (van den Bergh vandenBergh2000 (2000)). As we will show, IC 10 may very well be the nearest example of a blue compact dwarf galaxy (BCD). Certainly, its surface brightness is similar to that seen in BCDs once we account for the foreground reddening. Among Local Group dwarf galaxies, IC 10 has the highest surface density of WR stars and the highest current rate of star formation (Mateo Mateo1998 (1998)). The presence of so many WR stars and the high H luminosity emphasize that IC 10 is undergoing a strong burst of star formation that began at least 10 Myr ago. Observations of 21-cm emission from H i reveal that IC 10 consists of an inner disk embedded in an extended, complex, counter-rotating envelope (Shostak & Skillman ShostakSkillman1989 (1989)), and leads Wilcots & Miller (WilcotsMiller1998 (1998)) to conclude that IC 10 is still in its formative stage. These H i observations emphasize the youth of the current star formation episode, for there is a notable lack of interstellar medium structures that are attributable to supernovae (Wilcots & Miller WilcotsMiller1998 (1998)). Several studies of the stellar populations in IC 10 have revealed the existence of young, intermediate-age, and old stellar populations (Massey & Armandroff MasseyArmandroff1995 (1995); Sakai et al. Sakaietal1999 (1999); Borissova et al. Borissovaetal2000 (2000)). However, with the exception of the very recent star formation, very little is known of the history of star formation in IC 10, and nothing is known of the star formation history outside of the star-forming region.
All optical studies of IC 10 are hampered by the large foreground reddening due to its position near the plane of our galaxy . Our objective here is to reconsider the nature of IC 10 on the bases of its photometric properties and a new determination of its foreground reddening. We investigate its foreground reddening using spectroscopy of eleven of its H ii regions. We find that IC 10 should be considered a BCD instead of a typical dwarf irregular galaxy.
2 Observations and data reduction
|
2.1 Spectroscopy
The spectroscopic observations were carried out at three different observatories. The details of the observations are listed in Table 1. At Steward Observatory, the spectra were obtained with the Boller & Chivens (B&C) grating spectrograph at the telescope’s Cassegrain focus. The spectrograph slit covered on the sky and was oriented at a position angle of 10° (from north towards east). At the Observatorio Astronómico Nacional in San Pedro Mártir (SPM), Baja California, México, the spectra were obtained with a similar B&C spectrograph at the telescope’s Cassegrain focus. The spectrograph slit covered on the sky and was oriented and positioned very similarly to the Steward observations. At the Observatorio Astrofísico Guillermo Haro (GH), Sonora, México, the observations were obtained using two techniques. First, we obtained long slit spectroscopy using a B&C spectrograph at the telescope’s Cassegrain focus. The slit covered on the sky and was oriented east-west. Second, we obtained multi-object spectroscopy with the LFOSC imaging spectrograph, which uses a transmission grism as the dispersing element (Zickgraf et al. Zickgrafetal1997 (1997)). Objects were selected for spectroscopy using focal plane masks constructed from direct images obtained with the spectrograph. Holes of 3″ in size were used for the objects of interest. Any object could be selected provided that it was not aligned with another in declination, for the dispersion axis was oriented east-west. The standard stars that were observed in each case are listed in Table 1.
The reduction of these spectra was carried out using the Image Reduction and Analysis Facility (IRAF)111IRAF is distributed by the National Optical Astronomical Observatories, which is operated by the Associated Universities for Research in Astronomy, Inc., under contract to the National Science Foundation. software package (specifically the specred package). First, the bias images were combined and their signature subtracted from all of the images. Next, pixel-to-pixel variations were removed using spectra of the internal lamp. For the long slit spectra, sky emission for each H ii region was subtracted by identifying a neighbouring area without emission. For the multi-object spectra, two adjacent holes were always used, one for the object (H ii region or standard star) and the other for the sky, which ensured the same spectral range for each object-sky pair. The standard star spectra were obtained using the masks cut for the H ii regions. The spectra of all objects were calibrated in wavelength using the arc lamp spectra obtained at the same time as the observations. Finally, the flux calibration was made using the observations of the spectrophotometric standard stars listed in Table 1 to obtain the instrumental sensitivity function.
2.2 Photometry
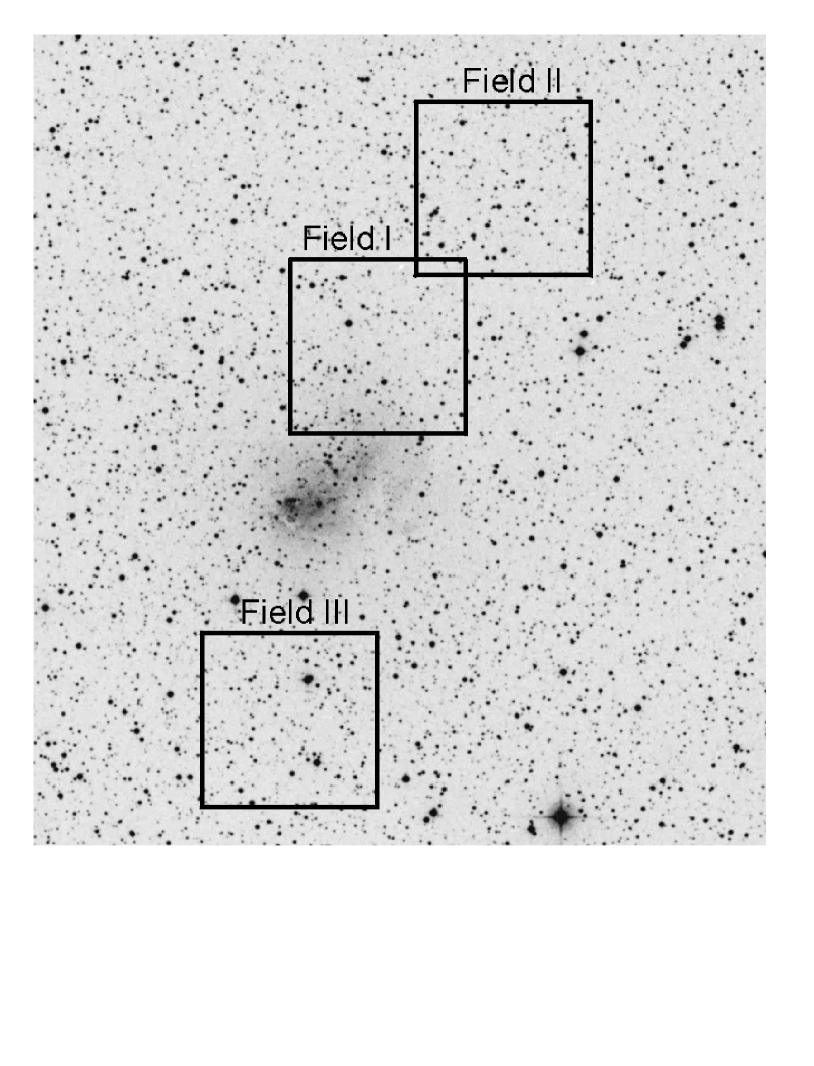
The optical photometry of foreground fields towards IC 10 was obtained at the Bulgarian National Astronomical Observatory (Rozhen). The CCD had a plate scale of , yielding a field of view. The seeing was under stable and very good photometric conditions. Three selected fields towards IC 10 were observed, and are shown in Fig. 1. Sets of images were obtained for Fields I and II, and a set was obtained for Field III. Landolt (Landolt1992 (1992)) standards were taken before and after all observations. The IRAF data reduction package was used to carry out the basic image reductions. The stellar photometry of the frames was performed with the point-spread function fitting routine ALLSTAR available in DAOPHOT (Stetson Stetson1993 (1993)). Complete details of the data reduction and analysis may be found in Georgiev et al. (Georgievetal1999 (1999)).
3 A new WR star
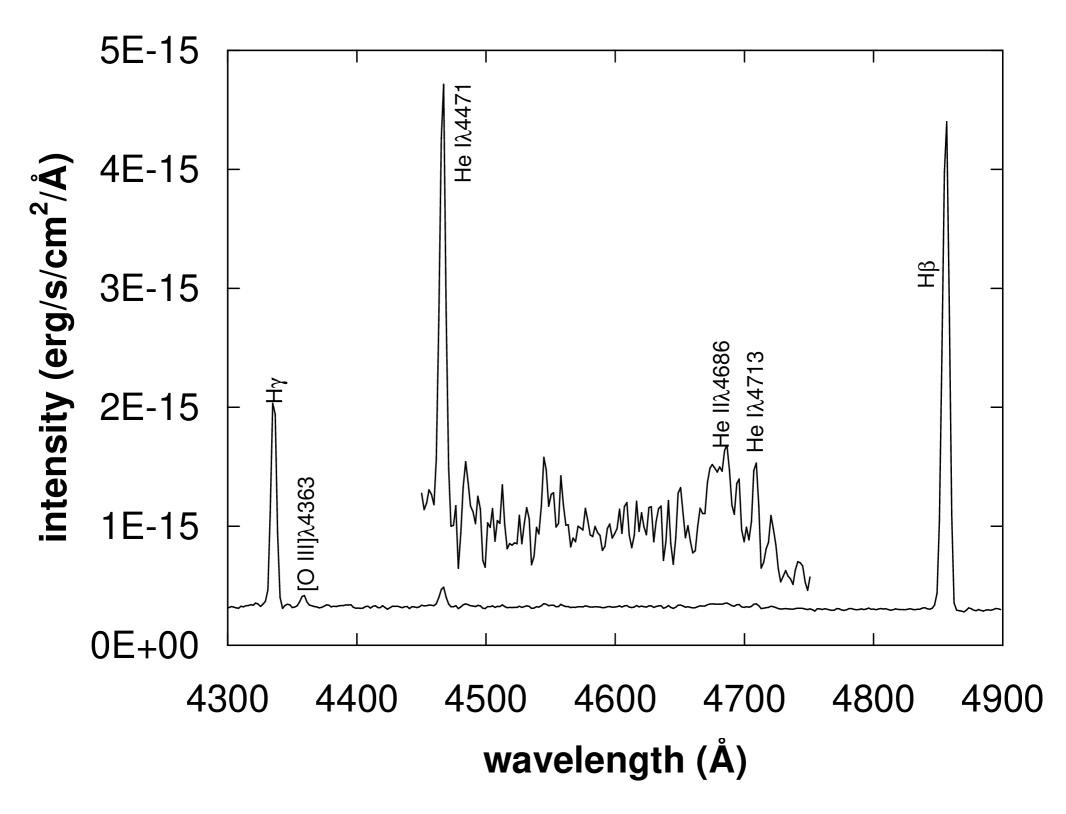
The Steward spectrum of HL111c (Fig. 2) contained broad He ii4686 emission indicating the presence of at least one WR star (WN specifically since there is no C iv emission at 4650Å). This feature is absent in the SPM spectrum, undoubtedly due to the slightly different placement of the slit for the two observations. In accordance with the stronger continuum expected due to the WR star, the equivalent widths of all of the emission lines are smaller in the Steward spectrum. The He ii4686 emission has an equivalent width of 3Å. Given the correlation between He ii4686 and H line intensities in WN stars, we expect an H equivalent width of order 0.6Å in emission (Conti et al. Contietal1983 (1983)).
4 Line intensities
|
-
a
The object identifications are from Hodge & Lee (HodgeLee1990 (1990)).
Tables 2-4 list the raw line intensities and reddenings for the H ii regions observed in IC 10. The line intensities were measured using locally-developed software (McCall et al. McCalletal1985 (1985)). The errors quoted for each line intensity include contributions from the fit to the line itself, from the fit to the reference line, and from the noise in the continuum for both the line and reference line. Table 2 also includes the electron temperature computed from the [O iii] lines and the corresponding oxygen abundance, calculated using the prescription given in Richer (Richer1993 (1993)) but adopting an electron density of .
To compute the reddening, we first corrected the Balmer lines for underlying stellar absorption according to
| (1) |
where and are the observed and corrected fluxes and , , and are the equivalent widths of the underlying stellar absorption, of the emission line in question, and of H, respectively. In all cases, except for the Steward spectrum of HL111c, we used Å (McCall et al. McCalletal1985 (1985)). Actually, our H-based reddenings would not be changed significantly for any Å. For the Steward spectrum of HL111c, was required to be less than 0.2Å in order to derive an H-based reddening that is consistent with the H- and H-based reddenings from the SPM spectrum, i.e., there is very little remaining absorption once one accounts for the H emission from the WR star (0.6Å). The values given in Table 2 were calculated using Å. Though an upper limit of 0.8Å is considerably smaller than the typical Balmer absorption found by McCall et al. (McCalletal1985 (1985)), it is not unreasonable for a very young cluster (Santos et al. Santosetal1995 (1995)).
We used these corrected line intensities to calculate the reddening via
| (2) |
where and are the observed and theoretical emission-line fluxes at wavelength , is the reddening, and . Values of were derived from Fitzpatrick’s (Fitzpatrick1999 (1999)) monochromatic reddening law parametrized with a ratio of total-to-selective extinction of 3.041. This parametrization gives a law that delivers a true ratio of total-to-selective extinction equal to 3.07 when integrated over the spectrum of Vega (McCall & Armour McCallArmour2000 (2000)). For all of the H- and H-based reddenings of H ii regions in IC 10, we adopted and , respectively, appropriate for an electron density and temperature of and , respectively (Osterbrock Osterbrock1989 (1989)).
Several external tests indicate that our flux calibrations, and hence our reddenings, are secure within the quoted errors. The and H line intensities from the Steward and SPM long slit spectra (Tables 2 and 3) are identical within errors for all objects in common. (Blueward of H, the sensitivity of the SPM data drops rapidly.) All of the line intensities for HL111c from both datasets agree with those observed by Lequeux et al. (Lequeuxetal1979 (1979)). For the Cananea multi-object spectra (Table 4), the line intensities and reddening we derive for HL45 are identical to those found by Lequeux et al. (Lequeuxetal1979 (1979)). There are no extant data with which we might compare our Cananea long slit data (Table 4). As we show below, however, the reddenings we derive for HL77 and HL111d+e are consistent with those for the other H ii regions. We therefore conclude that our flux calibrations and the resulting reddenings are not affected by any serious systematic errors.
|
-
a
The object identifications are from Hodge & Lee (HodgeLee1990 (1990)).
|
-
a
The object identifications are from Hodge & Lee (HodgeLee1990 (1990)).
5 The foreground reddening towards IC 10
The minimum reddening towards an H ii region in IC 10 is a first estimate of the foreground reddening towards this galaxy. The minimum value in Tables 2-4 is for the H ii region HL111c. (Throughout we use H-based reddenings when available.) This value is substantially lower than the values found in the literature, commonly (cf. Sect. 6). The reddening towards HL111c is all the more surprising since this H ii region likely suffers some reddening due to dust within IC 10.
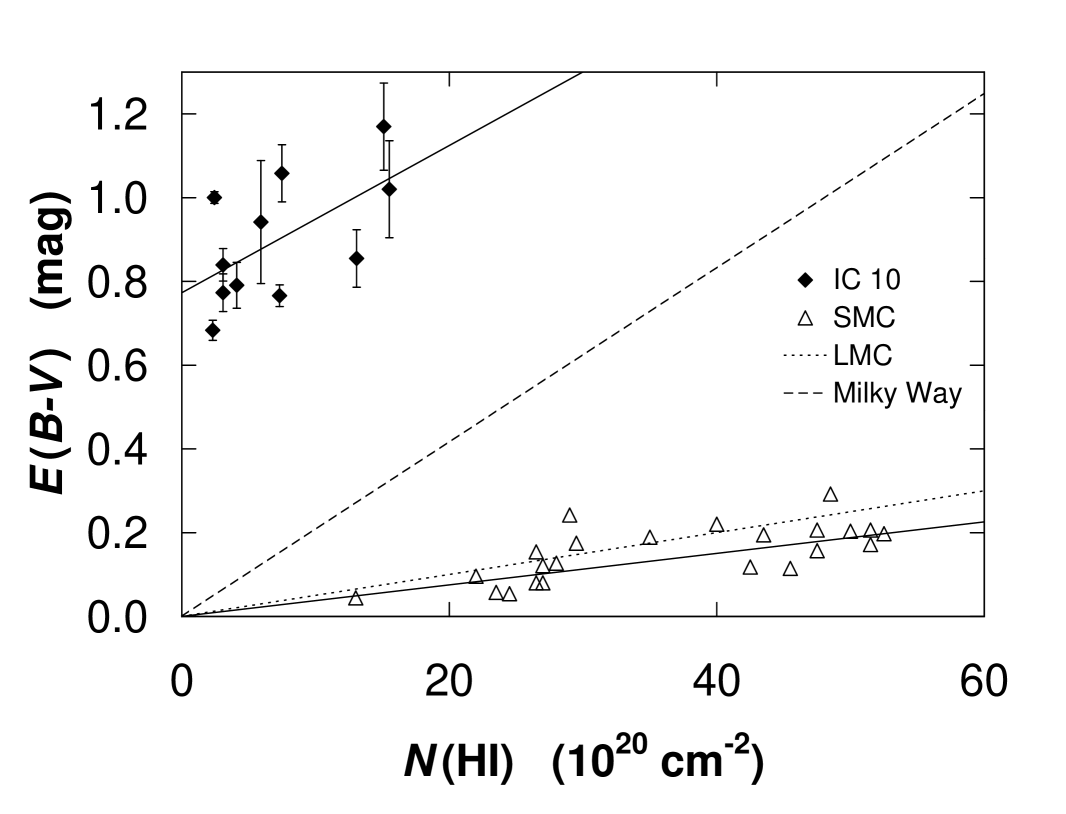
A second estimate of the foreground reddening toward IC 10 may be obtained from a plot of the reddening for each H ii region as a function of the column density of H i within IC 10 along that line of sight (McCall McCall1989 (1989)). The H i in the central part of IC 10 is in a disk (Shostak & Skillman ShostakSkillman1989 (1989); Wilcots & Miller WilcotsMiller1998 (1998)) and the H ii regions we observed are necessarily embedded within it. Thus, in Fig. 3, we plot the reddening as a function of half of the H i column density along the line of sight within IC 10 using the Wilcots & Miller (WilcotsMiller1998 (1998)) column density map (11″ beam; their Fig. 2). The adopted column densities are given in Tables 2-4 and were determined from a surface brightness map provided by B. Miller. As can be seen, there is a good correlation. The straight line is an unweighted least squares fit to all of the data points. This fit extrapolates to a reddening of at zero column density. We adopt this value as our second estimate for the foreground reddening toward IC 10.
As a test of this method, in Fig. 3 we also plot the reddenings and H i column densities for the H ii regions in the SMC from Caplan et al. (Caplanetal1996 (1996)). We excluded their data for N84c and N88, which deviate most strongly. The fit to the remaining points yields a foreground reddening of . The Schlegel et al. (Schlegeletal1998 (1998)) maps indicate reddenings of in the vicinity of the SMC. Likewise, McNamara & Feltz (McNamaraFeltz1980 (1980)) found a foreground reddening of . That our intercept is in good agreement with these values implies that the H i is reliably tracking the dust content. Thus, the intercept appears to yield the true foreground reddening.
The scatter about the fitted line for IC 10 in Fig. 3, , is likely primarily due to variations in foreground dust within the Milky Way. This scatter could be produced by fluctuations of order 10% of the mean foreground H i column density, (Cohen Cohen1979 (1979)), supposing the gas-to-dust ratio found by Bohlin et al. (Bohlinetal1978 (1978)). If due entirely to dust within IC 10, the scatter would require differences in the depths of the H ii regions within IC 10’s disk of order of the total column density (Shostak & Skillman ShostakSkillman1989 (1989)) or might be due to unresolved dust clouds. Regardless of the origin of the scatter, its magnitude is easily accounted for and its effect upon the intercept in Fig. 3 should be minimal by virtue of our large number of sight lines.
Given IC 10’s low galactic latitude, , it was not removed from the Schlegel et al. (Schlegeletal1998 (1998)) reddening maps. Indeed, at the position of IC 10, there is a feature of roughly the size expected for IC 10. Although the area around IC 10 in these maps is very complex, the foreground reddening implied is , in excellent agreement with our spectroscopy of IC 10’s H ii regions. Within IC 10, the reddening maps indicate .
de Vaucouleurs & Ables (deVaucouleursAbles1965 (1965)) deduce a foreground reddening of by comparing IC 10’s apparent colours with those for unreddened dwarf irregulars. If IC 10’s colours are atypical of dwarf irregulars (Sect. 7), this method will over-estimate the reddening.

Finally, in Fig. 4, we present colour-colour diagrams based upon our photometry for the foreground stars along the line of sight towards IC 10 in Fields I, II, and III (Fig. 1). We fit the colours of main sequence stars (Bessell Bessell1990 (1990)) to our colour-colour diagrams to obtain a mean reddening for the stars in all three fields of , with no evidence for significant variation between them. These foreground stars will not sample the full column density of gas and dust towards IC 10, so this estimate of the foreground reddening should be interpreted as a lower limit to the reddening towards IC 10.
Considering the above evidence as well as that to be presented in the following section, we adopt the intercept in Fig. 3, , as the most reliable estimate of the foreground reddening toward IC 10 since it is based upon many independent reddening estimates along individual lines of sight.
6 Internal dust
Fig. 3 clearly implies that IC 10 contains a considerable amount of internal dust. The slope found differs from zero at the 95% confidence limit, despite the scatter. Extant studies of IC 10’s different stellar populations corroborate the existence of internal dust. Massey & Armandroff (MasseyArmandroff1995 (1995)) obtain and for WR and blue plume stars, respectively. Sakai et al. (Sakaietal1999 (1999)) obtain and for Cepheids and RGB stars, respectively. Borissova et al. (Borissovaetal2000 (2000)) find and for red supergiant and Br sources, respectively. Generally, younger stellar populations suffer greater reddening. The exceptions are the blue plume and WR reddenings, but these are likely skewed towards the lower limits for these stellar populations since the least reddened stars in these populations are the easiest to study. Curiously, the reddening found for Br sources is similar to the maximum reddening in the Schlegel et al. (Schlegeletal1998 (1998)) maps. All of these reddenings match or exceed our foreground value, implying the reality of significant internal dust.
7 The nature of IC 10
In light of IC 10’s foreground reddening, we now consider its photometric properties, and, in particular, whether it should be considered a typical dwarf irregular. We summarize some of IC 10’s relevant properties in Table 5.
There is no modern surface photometry for IC 10. The best available photoelectric aperture photometry is that of de Vaucouleurs & Ables (deVaucouleursAbles1965 (1965)), who obtained the results listed in Table 5. Since their data for their smallest apertures is uncertain, we concentrate on their effective aperture values, i.e., the values for an aperture containing one half of IC 10’s total luminosity.
We adopt the distance modulus from Sakai et al. (Sakaietal1999 (1999)), which is based upon photometry of Cepheids, incorporates a self-consistent reddening, and is corroborated by that found by Borissova et al. (Borissovaetal2000 (2000)).
The derived photometric parameters were calculated as follows:
,
,
,
,
where
,
and
(FitzGerald FitzGerald1970 (1970)).
The colours we derive for IC 10 are rather different from those of dwarf irregulars (de Vaucouleurs et al. deVaucouleursetal1981 (1981)). Although its colour is similar to that of dwarf irregulars, its colour is much too red. Instead, IC 10’s colours are very similar to those of Markarian galaxies (Huchra Huchra1977 (1977)).
The surface brightnesses we derive for IC 10 are very high! Admittedly, the higher reddening values mentioned earlier imply even higher surface brightnesses, but we believe our foreground reddening is more reliable and the photometric parameters we derive therefore more reliable. Patterson & Thuan (PattersonThuan1996 (1996)) find that the central surface brightness for typical dwarf irregulars is fainter than in the band, nearly two magnitudes fainter than the mean surface brightness within IC 10’s effective radius. In fact, IC 10’s effective surface brightness is brighter than the canonical central surface brightness for spiral galaxy disks (Freeman Freeman1970 (1970)).
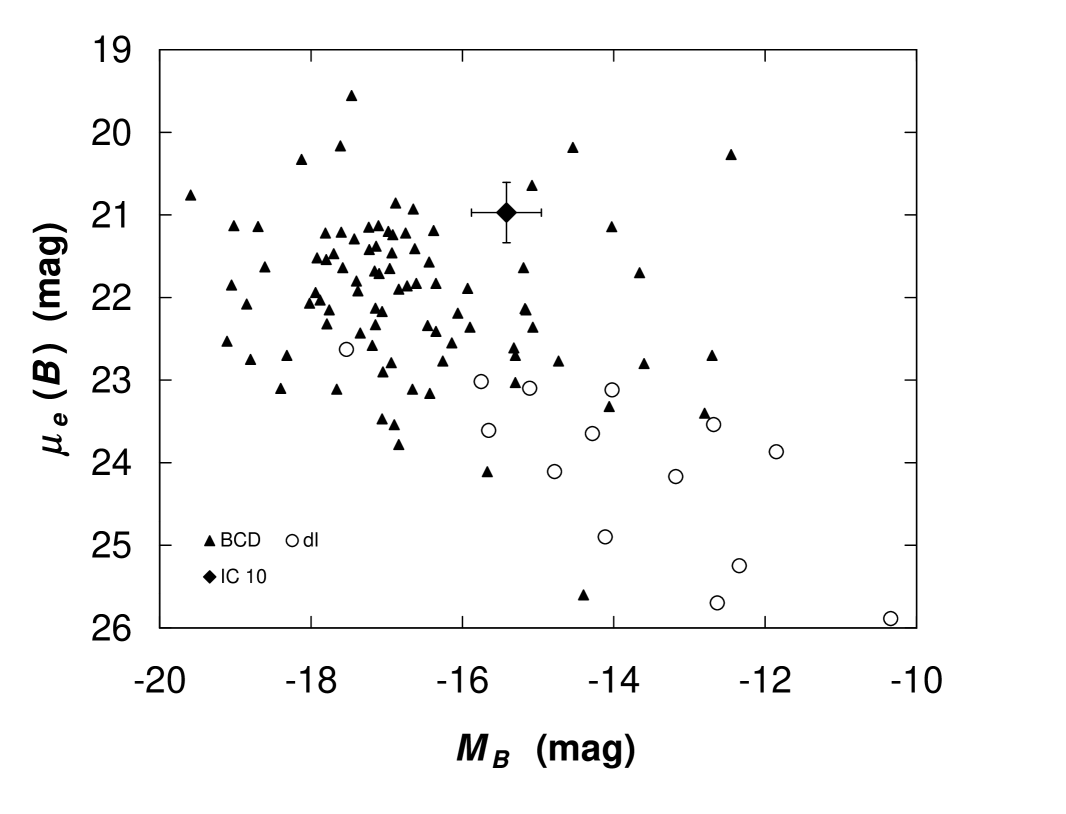
Only when we consider more actively star-forming galaxies do we find surface brightnesses similar to that of IC 10. Fig. 5 illustrates this graphically. Here, we plot the mean effective surface brightness as a function of absolute magnitude, both in the band, for various samples of dwarf galaxies. IC 10’s effective surface brightness is typical of that of BCDs, but at least two magnitudes brighter than that of typical dwarf irregulars. Quantitatively, IC 10’s effective surface brightness is similar to or brighter than the mean for the galaxy samples plotted in Fig. 5 or of the mean for the dwarfs in Telles & Terlevich’s (TellesTerlevich1997 (1997)) sample of H ii galaxies. IC 10’s effective radius is typical of galaxies in any of these samples.
Massey & Armandroff (MasseyArmandroff1995 (1995)) found at least 15 WR stars in IC 10. We have located another in our Steward spectrum of HL111c. Thus, at least 16 WR stars are known within the extent of the optically-bright part of the galaxy. Given IC 10’s distance of (Sakai et al. Sakaietal1999 (1999)), its surface density of WR stars is then . This surface density exceeds that found in discrete centres of active star formation in local galaxies by at least a factor of two (Massey & Johnson MasseyJohnson1998 (1998)), even though it applies to the entire area of the optically-bright part of the galaxy. Thus, there can be little doubt of the exceptional strength of IC 10’s recent episode of star formation.
IC 10’s flux ratio is consistent with its dust emission being dominated by a strong starburst component (IRAS PSC PSC (1988); Helou Helou1986 (1986)). The flux ratio is less conclusive because of the uncertainty in the flux.
In summary, IC 10 is not a typical dwarf irregular. Given the foreground reddening we obtain, which is lower than most of the values that have been suggested, its surface brightness is typical of that found for dwarf starburst galaxies. The same is true of the scale length of the optically-bright part of the galaxy. That the entire surface area of the optically-bright part of the galaxy has a surface density of WR stars double that in active centres of massive star formation observed elsewhere leaves no doubt that IC 10 is undergoing an intense starburst on a large scale. Thus, IC 10 should be considered to be a blue compact dwarf galaxy (BCD).
Acknowledgements.
We thank Margarita Valdéz Gutiérrez for her help in obtaining the telescope time at the Observatorio Astrofísico Guillermo Haro. We thank Bryan Miller for allowing us the use of his H i map in constructing Fig. 3. We thank the anonymous referee for helpful comments. MGR thanks Stanley Kurtz and Robin Fingerhut for very helpful discussions. MGR thanks the staff of the Observatorio Astrofísico Guillermo Haro for their hospitality and Raúl González and Gerardo Miramon for their able assistance with the observations. AB acknowledges a Mutis graduate fellowship from the Agencia Española de Cooperación Internacional. MR, MGR, and AB acknowledge financial support from CONACYT project 27984-E and DGAPA project IN122298. Support for JB and RK was provided by a Bulgarian National Science Foundation grant under contract No. F-812/1998 with the Bulgarian Ministry of Education and Sciences. MLM and RLK thank the staff of the Observatorio Astronómico Nacional in San Pedro Mártir for its help with the observations and gratefully acknowledge the continuing support of the Natural Sciences and Engineering Research Council of Canada. MLM thanks the staff of the Steward Observatory for its assistance with observations. LG acknowledges financial support from DGAPA project IN113999.References
- (1) Bessell, M. S. 1990, PASP, 102, 1181
- (2) Bohlin, R. C., Savage, B. D., & Drake, J. F. 1978, ApJ, 224, 132
- (3) Borissova, J., Georgiev, L., Rosado, M., Kurtev, R., Bullejos, A., & Valdez-Gutiérrez, M. 2000, A&A, accepted
- (4) Bremnes, T., Binggeli, B., & Prugniel, P. 1998, A&AS, 129, 313
- (5) Bremnes, T., Binggeli, B., & Prugniel, P. 1998, A&AS, 137, 337
- (6) Burstein, D., & Heiles, C. 1978, ApJ, 225, 40
- (7) Caplan, J., Taishen, Ye, Deharveng, L., Turtle, A. J., & Kennicutt, R. C. 1996, A&A, 307, 403
- (8) Cohen, R. J. 1979, MNRAS, 187, 839
- (9) Conti, P. S., Leep, M. E., & Perry, D. N. 1983, ApJ, 268, 228
- (10) FitzGerald, P. M. 1970, A&A, 4, 234
- (11) Fitzpatrick, E. L. 1999, PASP, 111, 63
- (12) Freeman, K. C. 1970, ApJ, 160, 811
- (13) Freedman, W. L., Hughes, S. M., Madore, B. F. Mould, J. R., Lee, M. G., Stetson, P., Kennicutt, R. C., Turner, A., Ferrarese, L., Ford, H., Graham, J. A., Hill, R., Hoessel, J. G., Huchra, J., & Illingworth, G. D. 1994, ApJ, 427, 628
- (14) Georgiev, L., Borissova, J., Rosado, M., Kurtev, R., Ivanov, G., & Koenigsberger, G. 1999, A&AS, 134, 21
- (15) Helou, G. 1986, ApJL, 311, 33
- (16) Hodge, P., & Lee, M. G. 1990, PASP, 102, 26
- (17) Hubble, E. 1936, in The Realm of the Nebulae (Yale University Press: New Haven)
- (18) Huchra, J. P. 1977, ApJS, 35, 171
- (19) IRAS Point Source Catalog 1988, IRAS Catalogs and Atlases, Joint IRAS Science Working Group II (Washington DC, USA)
- (20) Jurcevic, J. S., Pierce, M. J., & Jacoby, G. H. 2000, MNRAS, 313, 868
- (21) Knapp, G. R., & Kerr, F. J. 1974 A&A, 35, 361
- (22) Koornneef, J. 1982, A&A, 107, 247
- (23) Landolt, A. U. 1992, AJ, 104, 340
- (24) Lequeux, J., Peimbert, M., Rayo, J. F., Serrano, A., & Torres-Peimbert, S. 1979, A&A, 80, 155
- (25) Massey, P., & Armandroff, T. E. 1995, AJ, 109, 2470
- (26) Massey, P., & Johnson, O. 1998, ApJ, 505, 793
- (27) Mateo, M. 1998, ARA&A, 36, 435
- (28) McCall, M. L. 1989, AJ, 97, 1341
- (29) McCall, M. L., & Armour, M.-H. 2000, in Mapping the Hidden Universe: The Universe Behind the Milky Way – The Universe in H i, ASP Conference Series, eds. R. C. Kraan-Korteweg, P. A. Henning, & H. Andernach (ASP: San Francisco), in press
- (30) McCall, M. L., Rybski, P., & Shields, G. A. 1985, ApJS, 57, 1
- (31) McNamara, D. H., & Feltz, K. A. 1980, PASP, 92, 587
- (32) Miller, B. W., & Hodge, P. 1994, ApJ, 427, 656
- (33) Osterbrock, D. E. 1989, Astrophysics of Gaseous Nebulae and Active Galactic Nuclei (University Science Books: Mill Valley, CA)
- (34) Papaderos, P., Loose, H.-H., Thuan, T. X., & Fricke, K. J. 1996, A&AS, 120, 207
- (35) Patterson, R. J., & Thuan, T. X. 1996, ApJS, 107, 103
- (36) Richer, M. G. 1993, ApJ, 415, 240
- (37) Sakai, S., Madore, B. F., & Freedman, W. L. 1999, ApJ, 511, 671
- (38) Santos, J. F. C., Jr., Bica, E., Clariá, J. J., Piatti, A. E., Girardi, L. A., & Dottori, H. 1995, MNRAS, 276, 1155
- (39) Schlegel, D. J., Finkbeiner, D. P., & Davis, M. 1998, ApJ, 500, 525
- (40) Shostak, G. S., & Skillman, E. D. 1989, A&A, 214, 33
- (41) Stetson, P. B. 1993, User’s Manual for DAOPHOT II.
- (42) Telles, E., & Terlevich, R. 1997, MNRAS, 286, 183
- (43) van den Bergh, S. 2000, in The Galaxies of the Local Group (Cambridge: Cambridge University Press)
- (44) de Vaucouleurs, G., & Ables, H. 1965, PASP, 77, 272
- (45) de Vaucouleurs, G., de Vaucouleurs, A., & Buta, R. 1981, AJ, 86, 1429
- (46) de Vaucouleurs, G., de Vaucouleurs, A., Corwin, H. G., Jr., Buta, R. J., Paturel, G., & Fouqué, P. 1991, in Third Reference Catalogue of Bright Galaxies (New York: Springer)
- (47) Vennik, J., Hopp, U., & Popescu, C. C. 2000, A&AS, 142, 399
- (48) Wilcots, E. M., & Miller, B. W. 1998, AJ, 116, 2363
- (49) Zickgraf, F.-J., Thiering, I., Krautter, J., Appenzeller, I., Kneer, R., Voges, W. H., Ziegler, B., Chavarria, C., Serrano, A., Mujica, R., Pakull, M., & Heidt, J. 1997, A&AS, 123, 103