Polarization Insights for Active Galactic Nuclei
Abstract
Optical spectropolarimetry and broadband polarimetry in other wavebands has been a key to understanding many diverse aspects of AGN. In some cases polarization is due to synchrotron radiation, and in other cases it’s due to scattering. Recognition of relativistically beamed optical synchrotron emission by polarization was vital for understanding blazars (BL Lacs and Optically Violently Variable quasars), both physically and geometrically. Radio polarimetry of quiescent AGN is equally important, again for both purposes. Scattering polarization was central to the Unified Model for Seyferts, Radio Galaxies and (high ionization) Ultraluminous Infrared Galaxies. It provides a periscope for viewing AGN from other directions. Finally, if we could understand its message, polarization would also provide major insights regarding the nature of the AGN “Featureless Continuum” and Broad (emission) Line Region.
I point out that high ionization ULIRGs have all the exact right properties to be called Quasar 2s. Mid-IR observations generally don’t penetrate to the nucleus, greatly reducing their ability to diagnose the energy source. In particular, LINER ULIRGs aren’t necessarily starburst-dominated, as has been claimed.
1 Seyfert Galaxies
1.1 Type 2 Seyferts
1.1.1 Polarization alignments and hidden Type 1 Seyfert nuclei
In the 1970s the continua of Seyfert 2s were decomposed into two parts: relatively red light from the old stellar population, and a bluer component modeled satisfactorily with a power law. The latter was called the “Featureless Continuum,” in a commendable attempt to avoid prejudice as to its nature. (Unfortunately some of them were later found to have strong features; see below.)
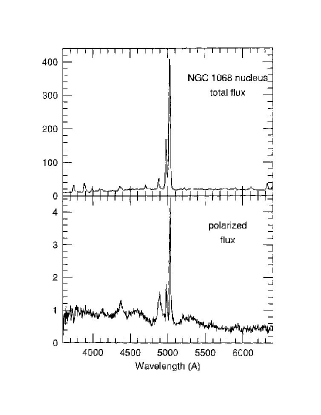
The small (%) V-band polarization often seen usually derives from the power law component. Most of these continua are dominated by unpolarized starlight, so the implied “FC” polarization is sometimes intrinsically large. The red starlight also strongly affects the wavelength-dependence of P so it really had to be removed. It was shown that for the brightest and best observed Seyfert 2, NGC1068, the true FC polarization was a surprisingly high 16%, and independent of wavelength ([Miller & Antonucci 1983]; [McLean et al. 1983]). The former paper noted the cause might be either scattering above and below an opaque torus, or synchrotron emission; the latter focused on synchrotron radiation as the more likely.
Following the initial discovery of a geometrical relationship between optical polarization and radio axis for quasars ([Stockman, Angel, & Miley 1979]), [Martin et al. (1983)] and I (Antonucci 1982a, 1983) sought such patterns in Seyferts and radio galaxies. (Ulvestad and Wilson were discovering tiny, weak, but linear radio sources in many Seyferts, using the new Very Large Array.) The Martin et al. paper presented a lot of data, but didn’t find alignment effects. I did claim to see them, and with essentially the same data. I think there were two reasons for the difference: 1) I didn’t consider the whole sample statistically, but only the few whose polarization was very likely to be intrinsic to the nuclei, and 2) I divided them into the two spectroscopic classes (Type 1 and 2), considering each separately.
There was pretty good evidence that the Type 2s tended to be polarized perpendicular to the radio axis, and not so good evidence that the Type 1s were parallel. (I tended to believe the latter though, because of the parallel polarizations of their “cousins”(?), the radio loud quasars.)
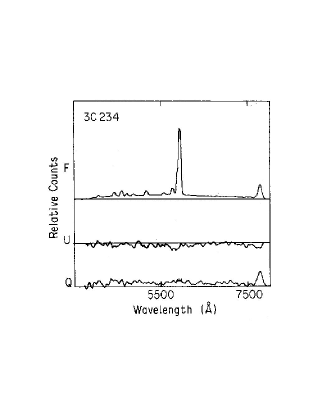
At the same time Joe Miller and I (I was the thesis student) were observing NGC1068 and the radio galaxy 3C234 with a new spectropolarimeter. This device had just been built, mainly by J Miller and G Schmidt. (Since I have no talent with instrumentation, my goal was just to avoid breaking it.) I realized pretty quickly that the explanation for the high “perpendicular” polarization of 3C234 was reflection from a quasar hidden inside a torus (Antonucci 1982a, b). We had to puzzle over NGC1068 longer, I suppose because the strong starlight confused us. Because of the wavelength independence of starlight-subtracted P, as well as some other moderately good reasons, we thought the scattering was by free electrons. Miller et al. (1991) then presented much better data, and showed the polarized spectrum as scattered off dust clouds in the host galaxy. These data indicated that 1) the dust-scattered light is much bluer than the inner, putative electron scattered light; and 2) the broad lines are narrower, indicating that the line widths are somewhat smaller than those in the electron-scattered polarized flux plot, when the reflection is from dust. This confirms that the nuclear scatters are electrons, and provides a temperature estimate of K. Note that according to the true line widths, NGC1068 would be classified as a “Narrow Line Seyfert 1” by astronomers looking from above. The Miller et al. 1991 nuclear data appear as the present Fig. 1.
We now know that many Seyfert 2s are just Seyfert 1s hidden inside opaque tori, and that therefore at least part of the class difference is just orientation. Some early references are Miller and Goodrich 1990 and Tran et al. 1992. We still don’t know if this applies to all the 2s. For a while I thought it probably didn’t because Kay (1994) was finding that the FC for many Seyfert 2s have low polarization. However, starting with 3C234, it was becoming clear that some of that blue light was coming from hot stars or some other source, and that there was in fact highly polarized reflected light from hidden 1s in many more (Miller and Goodrich et al 1990, Tran 1995a,b). The high polarization of the actual scattered part of the FC is proven by the polarization of the broad lines, and the normal Seyfert 1 spectra in polarized flux. (The key here is that the broad lines have normal equivalent width in polarized flux.) In most cases we just have very high –20% lower limits on the broad line region (BLR) polarization since at least I can’t see them at all in the total flux in many objects (P = polarized flux in broad line/total flux in broad line.) Soon afterwards Heckman et al. 1995, and Gonzalez-Delgado et al. 1998 showed definitive spectroscopic evidence that most of the FC in several famous objects is in fact light from hot stars.
As noted, the general applicability of the hidden-1 model for the 2s is still poorly known. It would be great to select a sample by some nearly isotropic property such as emission, and observe them all down to a certain level of sensitivity. One (contentious) idea is that the scattering regions are themselves often partially occulted, so that the trick works only for those viewed at relatively small inclinations (Miller and Goodrich 1990). Models of the torus (e.g., Pier and Krolik 1993) indicate that such relatively polar views would expose warm dust to the observer, and it’s been argued that we can in fact detect the hidden 1s in all the warm Seyfert 2s (Heisler et al. 1997).
1.1.2 Mirror and torus; a 3-D image of an AGN
These components were entirely hypothetical in the early 1980s. The mirrors (scattering regions) weren’t resolved significantly from the ground (but see Elvius 1978 for resolution of the outer dust-scattering part of the NGC1068 mirror). HST however could spatially resolve some of them. Our multiaperture HST UV spectropolarimetry resolved the inner “electron-scattering” mirror in NGC1068 (Antonucci et al. 1994), as did the beautiful polarization images by Capetti et al. (1995a,b).
The central arcsec or so shows neutral (wavelength-independent) scattering, and for this and other reasons, electron scattering seems to dominate there. The km/sec redshift of the broad lines in polarized light indicates polar outflow; recall that the scattering must be polar to explain the position angles (PAs). The dominance of electron scattering means that this gas has lost virtually all its dust, probably by travelling inside the sublimation radius (pc). Finally, as noted above, the gas temperature is thought to be K because the electron-scattered versions of the broad lines are somewhat wider than the lines seen scattered off dust clouds in the host galaxy (Miller, Goodrich and Mathews 1991).
The probable physical basis of this whole occultation/reflection scenario was first provided by Krolik and Begelman (1986, 1988). Krolik and collaborators also calculated the theoretical requirements and consequences of the scenario, predicting, for example, that the scattering region should produce a high-ionization Fe K- line of enormous (keV) equivalent width, as observed. The large " pc size of the electron scattering mirror was anticipated by the models of Miller, Goodrich and Mathews (1991).
Capetti et al. did a fine job analyzing the HST imaging, delineating for example the inner electron-scattering (neutral scattering) mirror, and the outer regions which show dust scattering (strong rise in cross-section with frequency). There was a slight puzzle left over from their analysis: in the inner region the polarization PAs were not quite centrosymmetric as expected for scattering. In principle this means that the hidden source isn’t quite pointlike. However, Kishimoto (1999 and p.c., 2000) found that the deviations were entirely traceable to instrumental effects. Also, since we know the polarization phase function perfectly for electron scattering, it’s possible to determine the angle between the nucleus and a scattering cloud, relative to the sky plane. For example, if some scattered light has a polarization of 100%, we know it’s right-angle scattering, so that the cloud is right in the sky plane. Kishimoto’s paper shows the first (I think) 3-D image of an AGN (Fig. 2)! See that paper for some caveats. The overall image is fairly robust I think, and wonderful.

I won’t say much about the earliest detections of the torus material since they didn’t involve polarimetry. But structures which are acceptable manifestations of it have been observed in the infrared, and in various molecular emission lines. The observed molecular tori, whose “outer radii” are pc, are observed in NGC1068, and also in luminous quasars and infrared galaxies (Section 3 has some more information on this). Two points to bear in mind: the polarization and spectral-energy distribution information indicate that the inner radius is somewhere near the sublimation radius. Independent of the unified model, the near-IR upturn in the SEDs alone implies a substantial covering factor of hot dust. And remember that the polarimetry indicates a torus only in the sense of something opaque, with holes along the axis so the photons can get out. In the real world there could be (and are) more complicated structures, including bars; it’s also possible that a warped thin disk could do the job, but it would have to be extremely warped and “tall” to simulate the obscuring behavior of a torus.
1.2 Type 1 Seyferts
1.2.1 Intrinsic Nuclear Polarization
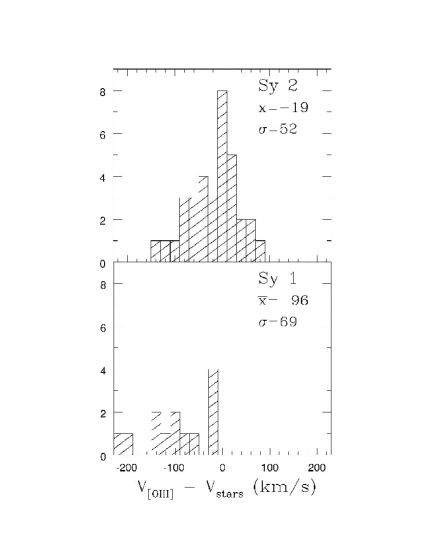
Type 1 Seyfert nuclei generally have low intrinsic polarization (%), so it is often overwhelmed by dichroic or other processes on the kpc scale. This is apparent when the narrow line region (NLR) and continuum polarizations agree, and/or both have PAs parallel to the host major axis in a high-inclination galaxy (Thompson and Martin 1988). If in doubt, a polarization image can help determine whether or not the polarization is associated with the nucleus.
There is fairly good evidence that the nuclear polarization PAs tend to align with the axes of the nuclear radio sources. As with the 2s, considerable uncertainty comes from the curved nature of the latter. Many years ago the available small sample seemed to show the alignment (Antonucci 1983). Since then various people have updated it, and I haven’t always agreed with what was done. Here is my personal update:
The original criteria were:
-
(a)
%
-
(b)
sky position in a good Galactic interstellar polarization zone.
This means it lies within a personal pre-defined sky area with relatively little expected interstellar polarization. I’d chosen these areas using the maps in Mathewson and Ford 1970.
-
(c)
linear radio source.
Updates relative to the 1983 paper:
-
(a)
I’d drop 3C390.3 on the grounds that it’s a radio galaxy; I was young and dumb in 1983 so I was following the classifications in an earlier paper by someone else.
-
(b)
Drop NGC3227 because the [O III] data show that the polarization arises in the host galaxy rather than in the nucleus (Thompson et al. 1980).
-
(c)
Add Mrk509: Polarization PA: %, at 130–150 (true variability) degrees: see references in Singh and Westergaard 1992. The radio PA is (Singh and Westergaard 1992): nearly parallel
-
(d)
Mrk704: Delta PA ! from Martel 1996; also in Goodrich and Miller 1994
-
(e)
Mrk1048 Delta PA ! from Martel 1996; also in Goodrich and Miller 1994
-
(f)
NGC3516 Polarization % at ; Radio 0–10; See Miyaji et al. 1992: parallel.
-
(g)
NGC5548 Delta PA = : Martel 1996
-
(h)
Mrk9 Delta PA = : Martel 1996
-
(i)
Mrk304 Delta PA = : Martel 1996: perpendicular.
-
(j)
Mrk957 at (Goodrich 1989) Radio PA ; see also Ulvestad et al. 1995)
While the data are still marginal, an optimistic and plausible summary is this. Most Seyfert 1 nuclei show optical polarization parallel to the radio axis; the exceptions may favor a perpendicular relationship.
1.2.2 Variety of BLR behavior. Constraints on the nature of the underlying continuum
In all known cases, the BLR line polarization is less than or about equal to that of the continuum, in magnitude. The action within the line profiles depends on the object. Often both the magnitude and the angle vary rapidly across the profile. It is undoubtedly encoded with lots of information on the nature of the BLR, but it’s very difficult to decode. The most heroic and intriguing attempt is Martel’s (1998) analysis of the broad H-alpha line in NGC4151.
There are several c. 1980 papers by the Steward group (R Angel, I Thompson, E Beaver, H Stockman, and probably some others). These authors were the pioneers measuring Seyfert polarization. Later (CCD) data supercede their observations.
NGC4151 was observed by Schmidt and Miller (1980), who found that the integrated broad line polarization was undetectably low with their data quality. There are some quasars that also have undetectably polarized broad lines. This is of great interest because it means that the polarized flux plot looks like a noisy version of the spectrum, but with the broad lines and small blue bump (Fe II plus Ba continuum from the BLR) scraped off as by a razor! See e.g., Antonucci 1988 where I present some data “borrowed” from Miller and Goodrich (pc); and Schmidt and Smith 2000. There are a few others.
Thus we can tell what the underlying continuum is doing…at for example, the Ba edge. The answer is: nothing. (Nothing happens at the Ly edge either.) This is not trivial. Models such as accretion disks which are cool enough to match the optical slopes would at least naïvely show the Ba edge in absorption. In one very important regard the Ba edge is more interpretable than the Ly edge: the relativisitic smoothing effects at the Ly edge are much reduced. If there’s a feature, we should see it!
We were asked to suggest observing projects for young astronomers, and I think the following is quite good if practical. The high-ionization lines in “Narrow Line” Seyfert 1s are often blueshifted and very broad relative to the low ionization lines and the systemic velocities. (As far as I know this important result was first shown by Rodriguez-Pascual et al. (1997), though you wouldn’t get that impression from some more recent papers!) To tempt the reader, I show the spectacular example of I Zw 1 in Fig. 3. (Some of those in Leighly 2000 are even better.) This was given to me by M. Kishimoto. I needed no convincing after seeing that plot, that the high-ionization lines are from a wind, in that object and maybe others. Early proponents such as [Collin-Souffrin et al. (1988)] deserve congratulations. It would be great to measure the polarization behavior of the two types of line. There are at present no space spectropolarimeters, so what’s needed is a bright object with enough redshift to bring a high ionization line like C IV 1549 into the optical — can we find such an object that shows the difference in the line profiles clearly?

Recovering from that digression, I just refer you to these papers on Seyfert 1 polarization: Berriman (1989) interpreted his broadband Seyfert 1 survey data as indicating dust scattering for most objects. More data including spectropolarimetry were presented by Brindle (1990). J. Miller and students obtained some fairly large (thesis-size) data sets (Goodrich and Miller 1994; Martel 1996). These papers show in detail the complex behavior inside the broad emission lines.
1.3 Broad Absorption Line Quasars
This subject has recently been reviewed by Schmidt and Hines 1999, and by Ogle et al. 1999, so here I’ll just present the main points. See also Hutsemekers and Lamy 2000 for more modern-quality data.
1. BAL quasars comprise % of optically selected quasars. The UV absorption from the troughs and possible accompanying dust absorption make them hard to find optically, so their true incidence is thought to be %. For two takes on this, see Goodrich 1997 and Krolik and Voit 1998. Goodrich points out that the significant electron scattering optical depth inferred for some BALs would itself cause the continuum to be emitted anisotropically.
2. These are really “broad scattering quasars”: The troughs really represent resonant scattering of heavy element lines in the UV. With unit covering factor (and no dust, etc!) the photons should all be returned to the beam and appear as emission line flux. However the observed emission lines are much too weak for that to be correct. In fact, the emission line strengths are fairly normal, so much of that emission must be from the usual collisional excitation in the broad emission line region. Thus the BAL covering factor is thought to be much less than unity.
3. Points 1 and 2 require that there are many objects intrinsically the same as BAL quasars which do not manifest as such from our sight line. With this semi-quantitative reasoning, all radio quiet quasars may be intrinsically very similar, appearing as BALs from some directions.
4. Because non-spherically symmetric resonant scattering is involved, the emission lines were predicted to be polarized (Scargle et al. 1970), but this expectation hasn’t generally been realized (Stockman et al. 1981 for the earliest data; Ogle et al. 1999 for the current state of the art). There are in several cases apparent manifestations of some resonant-scattered emission line photons in the polarized flux spectra. But it’s safe to say the polarization behavior of the emission lines is poorly understood.
5. Among radio loud objects, troughs of somewhat lesser widths are sometimes seen (e.g., Antonucci et al. 1993 on OI 287). Recently the “FIRST” radio survey has turned up some “radio-intermediate” BAL quasars, and at least one classical double (Gregg et al. 2000)! I think the incidence of truly broad troughs is still much lower among the powerful radio sources.
Members of the FIRST survey team present details of their radio-loud BALs in Becker et al. 2000. They include objects which don’t satisfy the accepted definition of BALs (Weymann et al. 1991) because their absorption lines are too narrow. It’s probably quite reasonable to discuss these with the BALs, but one must not be misled regarding the incidence of BALs among the radio loud objects. Again many of the objects in that paper are similar to OI287, and thus aren’t new phenomena.
6. BAL quasars show much higher optical polarization than average for radio quiet objects (Schmidt and Hines 1999 and references therein; Hutsemekers and Lamy 2000). This is due at least in part to attenuation of the direct ray, and so higher contrast for any scattered rays. Similar behavior has been seen in far-IR-selected quasars. Continuum polarizations usually rise weakly to the blue, possibly because the direct, unpolarized ray is reddened so the scattered ray has better contrast in the blue. (The original IRAS quasar, 13349+2438, is qualitatively similar: Wills et al. 1992.)
7. The BAL clouds (or wind) generally lie outside the broad emission line region since they partially absorb the emission lines. The emission lines don’t share the continuum polarization. Thus the high polarization must stem from scattering inside the emission line region, or cospatially or slightly outside it. The lack of polarization of a broad emission line of a BAL quasar was first shown for PHL5200, by Stockman et al. 1981.
8. The troughs are almost always weaker in polarized flux than in total flux. Probably some photons scatter around the absorbing clouds. It’s not always true however: take a look at the remarkable behavior of FIRST 0840+3633 (Brotherton et al. 1997). Both objects in that paper show (rare) absorption from excited metastable states in Fe II, and also show low-ionization lines in absorption (“Iron lo-BALs”).***Pat Ogle (pc) says the complex behavior of the data on FIRST 0840+3633 can be explained by wavelength-dependent dilution by unpolarized Fe II emission complexes. In this regard they are similar to only three previously observed AGN (Halpern et al. 1996). It would be fun to consider the radically varying polarization behavior of the various transitions as functions of atomic parameters such as critical density. A similar object has been analyzed by Lamy and Hutsemekers (2000).
9. Taking a cue from the Unified Model, most workers suppose that these are relatively high inclination quasars — and that at slightly higher inclinations they’d be classified as Ultraluminous Infrared Galaxies with hidden quasars (see Sec 3).
Nothing is known about the radio axes of most of these objects (if such exist). The Classical Double BAL has a steep-spectrum core, and optical polarization degrees off from the overall radio axis (Gregg et al. 2000). It would be worthwhile to observe the core at high angular resolution.
Finally, a clue regarding orientation can be gleaned from the radio spectra. Falcke and collaborators (e.g., Falcke et al. 1996) have argued fairly pursuasively that flat spectra in radio quiet quasars indicate a polar orientation, just as it does for radio loud ones. Perhaps the intermediate-inclination idea just mentioned is favored by the mix of BAL radio spectral indices (Barvainis and Lonsdale 1997).
Summary: Many more thought-provoking details are available in the reviews cited and referenced herein. However the big-picture consensus seems to be that the BALs may be at intermediate angles, where the line of sight passes through a fast wind atop a torus.
2 Radio Galaxies
2.1 Unification with quasars
2.1.1 Optical properties
This will be a quick history of the subject as I know it. The usual apologies for omissions [actually, you can still tell me before the printing!]. Relatively complete early references can be found in my 1993 ARAA paper.
Most powerful radio sources have spectra in the same two spectral classes as for the radio quiet ones: Type 2 Radio Galaxies, usually called Narrow Line Radio Galaxies, and often just called radio galaxies if at high redshift; and Type 1, those with strong broad lines in total flux which for historical reasons are called Broad Line Radio Galaxies or radio loud quasars, according to luminosity, basically. I show my original spectropolarimetric data on the first recognized case of a hidden BLR (3C234) in Fig. 4, along with modern Keck data (in a slightly different form) by Tran et al. 1995 in Fig. 5 (see Kishimoto et al. 2001 for the UV). Excellent data and analysis of many more radio galaxies can be found in Cohen et al. 1999.

A great HST picture of a torus is that in 3C270 = NGC 4261, found by [Jaffe et al. (1996)]. Note that spectropolarimetry provides only the crudest information on the torus size. I believe in most cases the inner radius is near the sublimation point ( pc), because the spectral energy distributions show that all Type 1 objects must have a substantial covering factor of hot dust. This HST image and some molecular mapping of various objects both show a (quasi) outer edge at 100–300pc.
Radio loud AGN can also have a contribution (sometimes dominant) from highly variable, highly polarized synchrotron radiation. From the point of view of the radio-optical Spectral Energy Distribution, the optical synchrotron source is seen to be simply the high-frequency tail of the radio core emission (Landau et al. 1986, Impey and Neugebauer 1988). These objects are the blazars (Wolfe 1978). Those with very low equivalent width emission lines are historically called BL Lac Objects. However, this subgroup has no physical meaning, and since the objects vary, they alternate their classification over time with this nomenclature! For example, BL Lac is often not a BL Lac object with this definition ([Vermeulen et al. 1995]). Another problem with this nomenclature is that it mixes low-luminosity nearby cases with FR1-level extended radio emission together with high redshift very high luminosity objects. Currently some people are saying that BL Lacs are specially oriented FR1 radio galaxies. This is sloppy in the extreme since a significant subset of them are known to be inconsistent with it (e.g., [Kollgaard et al. 1992]).
I’ve often argued that a better split for the blazars would be according to whether their extended radio emission is consistent with an FR1 or FR2 power level. I think this has more hope of having physical meaning than setting an arbitrary equivalent width limit on the emissions lines on the discovery spectrum, and it would retain the advantages of the latter for demographics.
Also, some authors have gone to the extreme of calling something a BL Lac object largely because it doesn’t have the strong 4000Å break expected for late-type stars. That seems crazy to me because it includes zillions of faint blue starburst galaxies…like the sources for the blue arc lenses in clusters. It took a long time even to get redshifts for the latter because their spectra are so featureless. High polarization or at least high variability is required when defining “BL Lac.”
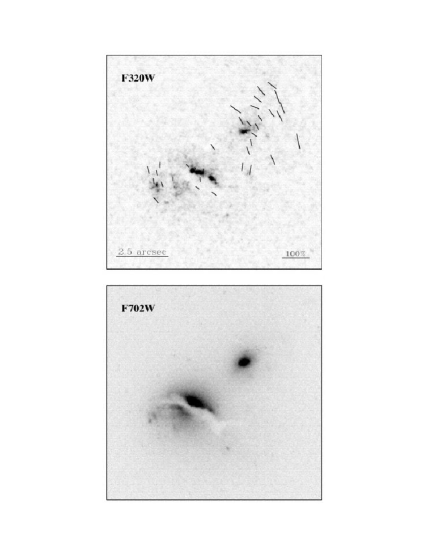
Next, let’s consider some polarized images which resolve the mirrors in Narrow Line Radio Galaxies. Ideally, these are made in the rest-frame near-UV, where dust scattering cross-sections would be large, and where there is reduced confusion with the host galaxy light. Fig. 6 shows our HST image of 3C321 ([Hurt et al. 1999]). The pattern is centro-symmetric within the noise, and P is locally rather large (%). [Young et al. (1996)] report scattered broad lines from the hidden quasar. Their data also show that the polarized flux spectrum is indistinguishable from a total-flux quasar spectrum, and this suggests unreddened electron scattering. It doesn’t prove electron scattering though, and we hope to look for spatially resolved scattered X-rays to make a strong test. It’s very important to establish this with certainty, because of the very remarkable consequences!
Many of the (–2.5) “aligned” radio galaxies (optical extension parallel to radio) have behavior very similar to that at 3C321 (e.g., [Best et al. 1997], and for the polarization, Cohen et al. 1999, Dey et al. 1996, Cimatti et al. 1997, and Vernet et al. 2000). In order to have sufficient optical depth in electron scattering, given the huge physical sizes of the polarized mirrors, the ionized gas masses are huge. Depending on assumptions, they may be or considerably more. Also, in cases where the broad lines are clearly seen in polarized flux, the putative scattering electrons cannot be too hot — at X-ray halo temperatures the scattering process would broaden the lines beyond recognition. They must be K, which means they aren’t typical cooling flows or hot haloes supported hydrostatically. So all that mass would likely be falling in on a dynamical timescale — conceivably forming a central cluster galaxy like M87. A recent discussion can be found in Kishimoto et al. 2001.
Incidentally, at even higher redshifts, the tiny sample observed spectropolarimetrically so far does not show polarization, but instead shows absorption lines probably (at least in part) from stellar photospheres. These objects are necessarily observed at shorter rest wavelengths (Å) so the comparison with the objects isn’t completely clear. It does show, however, that almost everyone’s theory for the optical radio alignment effect is right somewhere ([Dey et al. 1997]).
2.1.2 Radio properties
There are two types of powerful extragalactic radio source, the normal double sources and the core-dominant superluminal sources. (This oversimplifies, of course.) It’s rather well established that this is mostly another orientation effect: the latter are seen in the jet direction, and are greatly boosted in flux because of special-relativistic aberration. Indeed, these core-dominant sources generally show radio “haloes” consistent with lobes seen in projection around the bright core, if mapped with good dynamic range ([Browne et al. 1982]; [Antonucci & Ulvestad 1985]; [Wrobel & Lind 1990], and many others).
Now the double radio sources themselves can be divided into morphological classes, by whether the lobes are edge-darkened or edge brightened. The former (“FR1”) turn out to be basically the low luminosity objects.†††For a very interesting refinement of this statement, see [Owen & Ledlow (1994)]. They have several other correlated differences which gives this separation some physical significance.
I think that the most luminous of the (luminous) FR2 are all just hidden quasars. In many cases the polarized flux spectra already show it. In the 1980s, radio astronomers were making statistical tests of the identification of double radio quasars with core-dominant superluminal sources and statistical problems arose, such as finding “too many” fast superluminals relative to the expected beaming solid angle (e.g., [Laing 1988], [Barthel 1987]). These can all be explained by a dearth of objects with axes nearly in the sky plane. The reason is now obvious: quasars in the sky plane do exist, but are called radio galaxies because the obscuring tori block our view of the nuclei.‡‡‡Also note this interesting pair of papers on the projected linear sizes: [Singal (1993)]; [Gopal-Krishna et al. (1996)]. They discuss whether the lower-luminosity FR2s have unexpectedly small projected linear sizes, relative to beam-model predictions.
These very powerful radio galaxies have strong narrow emission lines like Seyfert 2s, but many of the weaker FR2 types do not, and most of the (low-luminosity) FR1s do not. Let’s consider first the FR2 radio galaxies: are the relatively weak ones hidden quasars? The optical-UV continuum is thought by many people to be thermal radiation from optically thick matter falling into a black hole. If there is instrinsically no hidden quasar (BBB), then according to current theory, there can’t be much of an accretion flow. In that case only the black hole spin energy would be available to produce and sustain the powerful radio jets. These objects can be called nonthermal AGN (if they exist).
“Optically dull” FR2 radio galaxies show very little optical polarized light in general. The reason could be: there’s no hidden quasar; there’s no mirror; the hidden quasar is completely surrounded by dust; relatively low-column kpc-scale foreground dust lanes block our view of the scattered nuclear light as in 3C223.1 (Antonucci & Barvainis 1990). A more robust test for a hidden quasar would be looking for the inevitable “waste heat” in the mid infrared. D. Whysong are I are trying to make this test at Keck, but it’s pretty hard. (A few relevant objects were observed by ISO.)
Now let’s consider the FR1 sources: most of these are optically dull: the narrow line emission is very weak, and of low excitation. This isn’t suggestive of a hidden quasar, but again the inner narrow line region could be occulted, or the nucleus could be completely surrounded by absorbing dust. In a very significant series of papers, Chiaberge et al. (1999, 2000), show that archival HST images have nuclear point sources in most of the optically dull 3C galaxies of both FR types. They reason that an AGN cannot be hidden in most optically dull radio galaxies because we can seemingly see into the center in order to detect the point sources (thought by the authors to be synchrotron emission from the tail of the radio core spectra). This behavior is unlike that of Seyfert 2s and the very powerful narrow line radio galaxies, and ultraluminous infrared galaxies, all of which show no point source in the optical band.§§§At least a couple of optically dull radio galaxies with pointlike nuclei do have strong high IRAS fluxes, arguing for hidden nuclei in those cases.
A good example of a somewhat optically dull FR1 (or FR borderline) radio galaxy is M87 ([Reynolds et al. 1996]). It shows a nuclear point source in the optical, and has no powerful thermal IR source. We find that at 11.7 microns there is only a weak mJy point source, and this could easily be explained as nonthermal emission from the base of the jet. M87 really can’t have a hidden AGN with luminosity remotely comparable to the jet power (Owen et al. 2000).
On the other hand, the nearest FR1 is Centaurus A…which has no optical point source, lots of thermal dust emission, and considerable polarimetric evidence for a hidden “thermal” optical/UV nucleus ([Marconi et al. 2000], [Capetti et al. 2000]). Thus the FR1 family is a heterogeneous one. Also regarding Cen A, it’s well worth taking a look at the beautiful CO 2-1 torus image, Fig. 2 of [Rydbeck et al. 1993]!
The FR1 radio galaxy 3C218 (Hydra A) has (relatively) weak emission lines of low excitation ([Ekers & Simkin 1983]), yet strong evidence for a hidden AGN ([Sambruna et al. 2000]); it shows that nuclei can have hidden AGN even if they are rather “optically dull”.
A related question is whether a quasar or Broad Line Radio Galaxy can have an FR1 radio source. A few are in fact known (e.g., see [Lara et al. 1999]). As those authors put it, this makes their source “a nontrivial object from the point of view of current unification schemes.” Another recent case is from [Sarazin et al. 1999]: 1028+313.
2.1.3 The range of optical slopes for lobe dominant radio quasars
There is one more issue I want to discuss, and it’s actually terribly important. A major study of the Unified Model, based on a well-selected sample, was presented by Baker (1997). That paper finds a weak correlation between radio core dominance (thought to be a crude statistical inclination measure) and optical slope. The sense is that those with weak cores are redder. Furthermore for a subsample, the broad line Ba decrement is steeper at low core dominance. And the loop is closed by the finding that the slope is correlated with the decrement in the consistent sense. Baker concludes from all this that the slopes are mainly influenced by reddening, and that reddening decreases with the “latitude” of the line of sight. The only obvious weakness here is the poor quality of the core-dominance/slope correlation.
This conclusion that the optical slopes are set by various amounts of reddening is a profound one. First it shows that, even among lobe-dominant quasars (thought to be seen from the general polar direction, like Type 1 Seyferts), the great majority of the luminosity is absorbed by dust (Baker’s Fig. 15). Second, it encourages theorists to dismiss the steeper slopes, and just make models that can fit the bluest ones. The latter is crucial for accretion disk models!
Core dominance is only a crude indication of orientation because 1) the core relates to the luminosity averaged over a timescale of years, whereas the lobe emission averages over many millions of years; and 2) the lobe luminosity is quite dependent on the environment on kpc scales. Wills and Brotherton tried normalizing the core fluxes to the optical fluxes instead of those of the lobes. This applies to radio quasars and broad lines radio galaxies only, and is considered undefined for blazars and narrow line radio galaxies. While there’s no a priori reason to expect this to work well, it certainly seems to! That is, several previous correlations of ostensibly orientation-dependent parameters using the old core dominance, look much better with this new version!
D. Whysong (pc 2000) tried Baker’s plot of core dominance vs optical slope with the new parameter — and the plot looks even worse than the original. This made us reconsider the reddening interpretation. We don’t think foreground reddening can make the steep slopes, because there is no exponenetial cutoff in the UV. Quantitatively this is compelling, and just requires that the extinction rise with frequency, as needed also for the reddening explanation. The only obvious way around this is to have the continuum emitter and the dust cospatial and intermixed. That would be quite amazing for the Big Blue Bump.
I suggest that the slopes are actually intrinsic, and that the correlation with Balmer decrement is an ionization-parameter effect. Certainly the steeper ones have a small fraction of the ionizing photons of the flatter ones, for the same strength of the optical emission lines. It doesn’t correlate with orientation at all in this picture. More cogitation is required.
2.2 Observing the ionized intergalactic medium
Radio polarization maps of high-redshift radio galaxies and quasars could supply a key cosmological parameter. We’ve been trying to detect Thompson-scattered radio halos to detect the ionized intergalactic medium. This was originally suggested by Sholomitskii. The expected baryon density based on nucleosynthesis is % of closure, corresponding to IGM optical depths of over the expected halo size ( light years, based on guessing the AGN lifetime). Sensitivity is needed on large scales and it turns out the Australia Telescope Compact Array is the best choice.
Our first attempt at this was published in Geller et al. 2000, providing an upper limit to the IGM density below 100% of closure (you have to start somewhere). We hope to do much better. If we can eventually detect the halos with confidence, we’ll learn the quasar lifetime and beaming pattern, too, in principle.
3 Ultraluminous Infrared Galaxies
3.1 Spectropolarimetry and Type 2 quasars
3.1.1 Quasars of Type 2
Let’s look again at the spectral energy distribution of unobscured AGN (Fig. 8). Obscured AGN are similar except the optical/UV is much lower, and sometimes the X-rays are as well. What is your definition of a “Quasar 2”? I’d expect that a Seyfert 2 with an extremely powerful nucleus would have an extremely powerful infrared bump, absorbing the AGN light, and reradiating it as in relatively isotropic infrared dust emission.
Next I’d expect a Quasar 2 to have powerful high excitation narrow emission lines, since the Narrow Line Region is generally outside the torus, and hence it emits rather isotropically. It would not scale with the infrared, simply because empirically the narrow line equivalent widths decrease with luminosity in the objects seen directly (Seyfert 1s and radio quiet quasars). But it should be much more powerful than those in the Seyfert 2s.
I’d also expect, based on the Seyfert 2s and the unified model, that there would be no optical/UV point source, and that the hidden Type 1 nucleus would appear at good contrast in the polarized flux spectra.
Note that the optical/UV continuum flux would not scale with the AGN luminosity, because that continuum in Seyfert 2s is almost always strongly dominated by the light from the host galaxy. Suppose 90% of the Seyfert 2 continuum derives from light from the underlying old steller population, a fraction not in great dispute. Then a simple scaling of the AGN power by a factor of 10 would lead to an increase in optical/UV flux of only a factor of two. This is oversimplified given differences among the AGN nuclear regions (reddening, young stars), but I think it’s qualitatively correct.
I’ve just described exactly the high-ionization ultraluminous infrared galaxies (e.g., Hines et al. 1999). I still read that there are no Quasar 2s, or that their existence remains to be demonstrated. If you think that this class remains undetected, please tell me your definition of Quasar 2.
On the radio side, I think there would be little argument that the Type 2s are the powerful narrow line radio galaxies — at least for those with the highest radio luminosity.
3.1.2 Properties of Quasars of Type 2
There are a lot of high-ionization ultraluminous infrared galaxies. The estimates I’ve seen indicate that the fraction of all infrared galaxies comprised by those of high excitation rises with infrared luminosity, and reaches half of those more luminous than 1– Lo.
Fig. 8 shows the generic SED shape for unreddened quasars. It is important that the IR bump has about 30% of the integrated flux. The simple and plausible interpretation is that the “tori” cover % of the sky, as seen from the nuclei. This seems at first glance to be consistent with the space density of high ionization ultraluminous galaxies relative to quasars matched in apparent bolometric flux ([Gopal-Krishna & Biermann 1998]). However, the correct thing to do here is to compare ULIRG and quasar space densities as matched by far-IR, since that, not LBOL, is isotropic. We can conclude that the (UV-selected) far PG quasars are well below average in dust coverage, as deduced by many others.
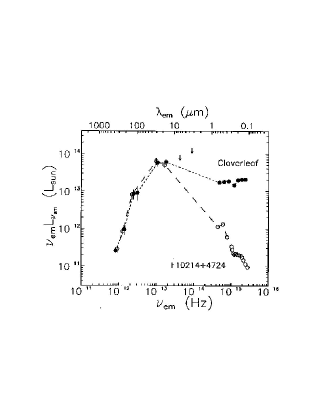
Fig. 9 shows a comparison of the SED between the first “hyperluminous” infrared galaxy (F10214+4724), and the “Cloverleaf” reddened quasar. Both are lensed and the quantitative close agreement in the far-IR is fortuitous. But it makes the point that even a somewhat-reddened quasar has a much higher fraction of the light in optical/UV. The infrared galaxy has no point source visible in those regions, but there is a little scattered light from the hidden quasar which makes it detectable in the optical/UV. I say this with confidence because the hidden quasar appears in the polarized flux plot, just as in nearby Seyfert 2s (Goodrich et al. 1996).
It’s also known that the relatively isotropic CO/far-IR ratios are generally the same in quasars as in ultraluminous infrared galaxies, even for those classified as starbursts (Alloin et al. 1992; Evans et al. 2001).
The IR-warm ultraluminous infrared galaxies start to reveal a pointlike nuclear source in the near-IR (e.g., Surace, Sanders & Evans 2000). These are attributed to penetration of the outer parts of the absorber well enough to see the very warm unresolved nuclear dust. This hot dust can be reached much more easily, apparently, than the nuclei themselves.
Now an extremely important question arises, in terms of understanding the global SEDs. What is the torus column density and the opacity at various wavelengths? Starting with NGC 1068, the lack of a strong variable X-ray source immediately shows that many are “Compton thick,” blocking even the keV photons. At solar abundances this means the column density is cm-2. Recently it’s been possible to measure the column density (or limit) distribution for fairly complete Seyfert 2 samples and the median is almost that high (Maiolino et al. 1998; see also Salvati and Maiolino 1988). It immediately follows that in most cases mid-IR observations reveal the conditions some fraction of the way into the tori unless the dust/gas ratio is extremely low. Apparently, there is star formation in the tori, since the mid-IR observers often see “starburst” spectra. Whatever the dust-gas ratio, the point is that the Type I nucleus is seen in the x-ray but not in the mid-IR.
3.2 Distinguishing hidden AGN from hidden starbursts in ULIRGs
3.2.1 Opacities and Luminosities
There has been a great deal written on this subject which implicitly or explicitly presumes the tori are optically thin in the mid-IR. I can’t put much faith in these papers because we have very strong evidence that this would not be the case in typical Seyferts. Thus the spectra that simply show starburst mid-IR lines are probably just studying conditions inside the tori. I’d be convinced of an important starburst, if some observed spectral features indicated starburst luminosities consistent with the far-IR power. However, even in such cases I reject the claim that an object or certain objects get “most” of their energy from starbursts. That language requires the starburst energy contribution to be % of the total luminosity. But there is no such precise bolometric luminosity that can be inferred from any emission line feature. Similarly, the best predictor of hidden AGN luminosity is the hard X-rays — for objects in which they get through the torus. It’s pretty robust but only works at the factor-of-three level, certainly not sufficient for anyone to say the hidden-AGN luminosity is % of the total. As soon as somone makes a statement about energy sources with this kind of precision I tend to stop reading because I’ve lost faith in my author.
Join my new group: the Militant Agnostics. Our motto is, “I don’t know, and you don’t either!”
3.2.2 What are the LINER ULIRGs?
My guess would be that the ULIRGs with high ionization narrow lines are mostly powered by AGN, and likewise for the starbursts. It’s just a guess. But what about the large minority of ULIRGS which have LINER (Low Ionization Nuclear Emission Region) spectra? Here we can’t even tell if the region producing the lines that we see derives from a hidden AGN or a starburst.
A remarkable paper and those surrounding it illustrate the point about LINER ULIRGs. After extensive studies of the mid-IR spectra of ULIRGs, it was claimed by many that their energy source is usually a hidden starburst. Then some mid-IR experts got together with an optical AGN spectroscopist, in part to see what the mid-IR spectra have to say about the optical LINERs (Lutz, Veilleux and Genzel 1999). They showed in a remarkably clean manner that those with optical starburst spectra also have infrared starburst spectra; same for the AGN; but the interesting part is that the many optical LINERs show starburst infrared spectra! This was interpreted as indicating that the LINERs are simply a slightly different manifestation of a hidden energetically dominant starburst. Only trouble is, I think few if any of these mid-IR spectra came from the actual nuclei, as discussed above. Maybe the observations prove that there is a lot of star formation inside the tori, but not that it contributes % of the luminosity.
A good example is NGC6240, a famous “prototype” (see Table 1 of Lutz et al. 1999). The optical spectral type is listed as LINER, and the mid-IR is listed as starburst. (It is even a “prototype” starburst in Genzel et al. 1998.) The simplest conclusion is that it’s simply a starburst galaxy, with little AGN contribution. Well, the X-ray opacity at keV is a few times smaller than that in the mid-IR, so for a small (but non-negligible) number of cases the X-ray penetrates, though the mid-IR doesn’t. Shortly after (or perhaps contemporaneously with) the Lutz et al. paper, Vignati et al. (1999) published the BeppoSAX spectrum, covering the high energy as well as the low energy X-rays. It clearly shows a column of cm-2, so that there would indeed very probably be high opacity in the mid-IR.
The hard X-rays are strong (direct), penetrating and rapidly variable, and really must come from a hidden AGN. The corresponding bolometric AGN luminosity is to within uncertanties just that observed. Even in that case, given the factor of dispersion in the X-rays/bolometric ratios seen in other AGN, it would be too much to claim the AGN luminosity is % of bolometric. But it sure isn’t negligible either, so the mid-IR spectrum is not convincing evidence for a dominant starburst for this object and thus potentially for any of them.
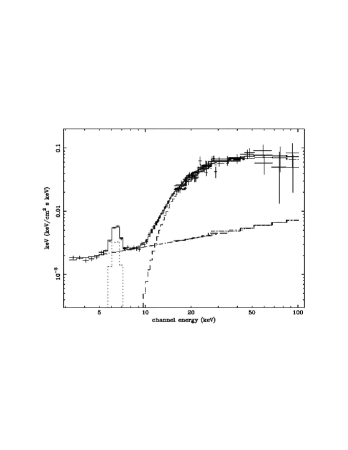
There are many similar cases, but this is getting far afield from polarimetry. I’ll just cite and show the case of NGC 4945. It also is a “template” starburst in Genzel et al. 1998. Yet it has powerful rapidly-variable keV flux, and certainly contains a powerful hidden AGN. The reason I bring this one up is that it has a wonderful wide-band X-ray spectrum, and the soft and midrange absorption indicating the very high column couldn’t be clearer (Fig. 10, from Madejski et al. 2000; see also Eracleus et al. 2001 for another example.).
The mid-IR observers aren’t convinced though. In a “reply” paper they say that “the starburst may well power the entire bolometric luminosity” of NGC4945 with the caveat that they can’t really prove that an AGN doesn’t provide “up to 50% of the power”. Don’t you love science?
The recently-discovered “Scuba”, millimeter-selected galaxies are quite similar. They can be detected easily because of a very favorable “K-correction” for objects at significant redshift. We probably know a tenth as much about these compared with the old ULIRGs. Yet at least one of the discovery papers simply assumes they’re all powered by star formation, and doesn’t even mention the AGN possibility. This unjustified assumption has major consequences for the luminosity density history of the universe (Madau Diagram), for the X-ray background (Almaini et al. 1999), and also for black hole demographics.
4 Emission Mechanism for the Big Blue Bump Spectral Component
4.1 Introduction and Polarization Diagnostics
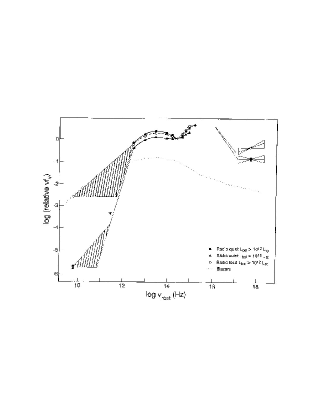
We have some hope of understanding quasars because the spectral energy distributions are quite generic. Aside from an occasional blazar (radio core, synchrotron) component, they seem to comprise an IR bump (thought by almost everyone to be thermal dust emission), a usually energetically dominant “Big Blue Bump” optical/UV continuum component, and an extremely interesting but less powerful X-ray component. Refer again to Fig. 8. Note that the X-ray component does become competitive with the Big Blue Bump (BBB) in some of the lowest-luminosity nuclei.
Since the BBB is generally energetically dominant, and peaks to order of magnitude in the right spectral region, it is often assumed to be thermal emission from optically thick accreting matter. Published models almost all assume the emitter is a standard thin opaque, quasistatic disk converting gravitational potential energy through viscosity into radiation. These are sometimes called “Shakura-Sunyaev” disks. Almost no one would argue that this is qualitatively correct any more. Nevertheless most theorists assume de facto that whatever is going on, you get the same spectrum!
Polarization has played a role in testing the accretion disk model as follows. The tale is a bit convoluted. In an optically-thick disk with a scattering atmosphere and with the heat deposited at large optical depths, the polarization should range from 0 to 11.7%, and always lie along the (projected) disk plane. However, it’s been known since the world began that this doesn’t describe the observations.
The polarization degree might be okay if the edge-on quasars were missing (manifesting as NLRGs or Infrared Galaxies). There are claims that the polarization magnitude distribution actually is consistent with the predicted one, without the high-inclination objects. However, in the case of lobe dominant, steep spectrum radio quasars, the direction is observed to be parallel to the radio jets ([Stockman, Angel, & Miley 1979]). Thus these early papers implicitly assumed that the jets emerged from the sides of the disks. A possible way out is to claim that for these radio-loud objects, the polarization derives from an optical blazar component, but this is observationally untenable because the radio core spectra decline sharply by the millimeter region (e.g., Antonucci et al 1990, Knapp and Patten 1991 and van Bemmel & Bartoldi 2001). Also as noted above, Seyfert 1 galaxies probably show the same effect, and they have very weak radio cores.
In the models of Laor, Netzer and Piran (ca. 1990 vintage), absorption opacity simply dilutes the effects of scattering in terms of magnitudes of polarization, resulting in a strong rise in P with frequency followed by a sharp decline past the Lyman edge. [Antonucci et al. (1996)] and [Koratkar et al. (1998)] tried to test the polarization predictions (low in the optical, higher in the UV longward of the Ly edge). No object seems to have the expected behavior. In fact several showed very high polarization, only below Å in the rest frames ([Koratkar et al. 1995]). Regarding the latter, I’m reminded of an apochryphal Eddington quote: never trust an observation until it’s confirmed by theory.
It was discovered later (actually rediscovered, e.g., Gnedin and Silant’ev 1978 and probably earlier ones; some modern papers are [Matt, Fabian & Ross 1993], Blaes and Agol 1996) that Laor’s seemingly reasonable way of accounting for the effects of true absorption is really not correct in most of parameter space. The current state-of-the-art as far as I know is Blaes and Agol 1996. They can get a slight parallel polarization, at least in models that produce too-few ionizing photons, modulo Comptonization. But the latest wisdom says the disks will be completely Faraday-depolarized (Agol and Blaes 1996; Blandford, this volume). Perhaps the observed “parallel” polarization is impressed downstream (though inside the BLR).
Getting the AGN geometry right at any distance from ground-zero would be valuable, and [Chen & Halpern (1990)] made some very interesting, very specific predictions for the polarization behavior in double-humped broad H- profiles — the latter were argued to arise in a thin disk at a larger radius than the BBB. While these “smoking gun” predictions weren’t confirmed ([Antonucci, Hurt & Agol 1996], [Corbett et al. 1998]) it was later shown that a range of polarization behavior could occur in the disk model, if certain assumptions were relaxed ([Chen, Halpern & Titarchuk 1997]).
4.2 Other Diagnostics
I’ll make brief mention of some other tests of the accretion disk paradigm for completeness. My point of view is spelled out in more detail in [Antonucci 1999].
4.2.1 Lyman edge
Most thermal models predict observable changes in the spectra at the position of the Ly edge. There are certain rather narrow regions of parameter space in which they are not present at a detectable level.
The Shakura-Sunyaev disk generally leads to an edge in absorption, as in stellar atmospheres in which this spectral region is energetically important. Kolykhalov & Sunyaev (1984) considered this in some detail. No such edges are seen, however (Antonucci et al 1989)¶¶¶Small features have been claimed in composites (e.g., Zheng et al. 1998, but see [Tytler & Davis 1993]), but I don’t think credibly in individual objects (see [Appenzeller et al. 1998] for a great observation of 3C273). Since the absorption-line test described above probably wouldn’t work well in composites, it’s not clear that such a feature is due to a disk edge. At least that’s the lesson Kinney and I learned from our follow-up observations of disk edge candidates.. The key test to determine whether or not a candidate edge really comes from a relativistic disk rather than foreground material is a lack of an accompanying set of sharp absorption lines: A. Kinney and I once thought we had some candidate disk edges but they all failed this test. Often people attribute an observed edge to an accretion disk without bothering with or even mentioning this basic test.
Later authors pointed out that Kolykhalov and Sunyaev were unable to consider surface gravities below that expected for supergiant stars, and that lower gravities and so densities were quite reasonable and result in smaller edges. It’s amusing that a surface gravity and so density much higher than previously contemplated might also do the trick: (Rozanska et al. 1989, but see also Czerny & Pojmanski 1990 and Czerny & Zbyszewska 1991). Also the range of gravitational redshift of the emitting elements and (for high-inclination disks) the range of Doppler shifts would tend to smear the edges out. For certain parameters they would be very hard to detect. Invoking too much inclination would require reconsideration of the polarization distribution, and of consistency with the Unified Models.
It is very interesting to consider now the flux and polarization behavior at the Ba edge. In some quasars the BBB polarization is %, and wavelength-independent. More importantly, it arises inside the BLR because neither the broad emission lines nor the “Small Blue Bump” atomic emission in the 2500–3500Å region are polarized. Thus the polarized flux plot is a wonderful way to scrape off the atomic emission and see what the BBB is doing in this region, as mentioned in Sec. 1. So far it looks like there is no Ba feature in the BBB ([Antonucci 1988]; [Schmidt & Smith 2000]). Explanations of the lack of any Ly edge feature which depend upon relativistic effects, or other effects occuring in the hot innermost annuli, would not work here. In some cases as noted below, the disk continuum in the optical region must match rather red observed spectra (spectral index ). (The negative slope isn’t a results of foreground reddening since we see no downturn in the UV.) Models must achieve this without producing a Ba edge feature.
Much stricter constraints on, or detections of, a Ba edge feature would be a very worthwhile spectropolarimetric project. (I haven’t been able to get telescope time to do it!)
4.2.2 Spectral energy distribution
Early accretion disk models predicted positive spectral indices, well longward of an exponential cutoff, whereas almost all quasars and AGN have negative spectral indices (two good studies of the latter are [Neugebauer et al. 1987] and [Francis 1996]). The observations weren’t fitted to the model optical/UV directly, but only after subtraction of an “infrared power law,” extrapolated under the optical (e.g., Malkan 1983). Indeed, [Laor (1990)] states that such a power law is required. Only trouble is, everyone is now convinced that the IR is dust emission, which must drop like a stone at and cannot legitimately be extrapolated under the optical (e.g., [Barvainis 1992] and references therein). It isn’t yet clear whether pure disk models can fit the optical observations (including the lack of Ba edge).
Although the dependence of disk maximum temperature on luminosity (for a given ) is only to the 1/4 power in the standard disk, that’s enough to predict dramatic differences between the turnover frequencies of high luminosity quasars compared with low luminosity Seyferts. No such difference is found (e.g., [Walter & Fink 1993]; also Mineo et al. 2000 show that quasars have a steep rise below 500eV just like Seyferts, naïvely at least suggesting a similar temperature). In fact in the optical range people have typically found that the more luminous AGN are flatter (hotter): see e.g., Fig. 5 from [Mushotzky & Wandel 1989].
A more robust prediction is that for a given object, the fitted temperature should vary as the brightness changes. This is seen qualitatively in the UV for most objects. In fact they all behave this way, except the ones that don’t (e.g., Antonucci 1999).
In a particular case, the extremely luminous quasar HS 1700+6416, the spectrum extends to far too high a frequency for the “standard” model ([Reimers et al. 1989]), though hard photons could always come from Comptonization (Siemiginowska & Dobrzycki 1990). I’ve noticed also lately that it’s become socially acceptable to assume that the inner edge of the optically thick disk can be anywhere needed to help fit a model. Previously, attempts were made to fit disks which extend into the last stable circular orbit. This may be reasonable physically, but it conforms to the pattern that a new parameter is adopted for each new observational fact. Certainly the disk model has shown no predictive power.
Finally there is the interesting issue of microlensing variations. Rauch & Blandford (1991) showed that for the Einstein cross any optically thick thermal model which can produce the optical-region SED must have a thermodynamic emissivity much greater than 1! Others have disagreed e.g., [Czerny, Jaroszynski & Czerny (1994)], on the grounds that 1) everyone knows a plain disk doesn’t fit the optical slope anyway, so we can invoke another component there from outside the microlensed region, and 2) the observed “caustic crossing” may have been a rare event. I like the Rauch and Blandford color-temperature constraint because a disk could, in fact, produce the observed SEDs given a certain heating of the outer annuli by the inner ones, but on the other hand, recent data suggest that the variation analyzed was, in fact, unusual and is legitimately modeled as a 2– event.
4.2.3 Variability
As far as I know, [Alloin et al. (1985)] should get the most credit for pointing out explicitly that AGN variations are much, much too fast and too phase-coherent with respect to wavelength for any quasistatic model. Almost equally important in this context is the fine quasar spectral variability study by [Cutri et al. (1985)]. Somehow these papers didn’t sink in for a decade or so, with claims being made that the problem was first discovered by a much later monitoring campaign on NGC 5548! The latter did provide the best limits on any lag between the long- and short-wavelength variations which was so tight as to require communication between the two relevant annuli at of order light speed ([Krolik et al. 1991])! This is a profound fact that shouldn’t be ignored. In the disk models, this is much shorter than the sound crossing time as well as the viscous time — for disk models it really requires something tapping into the basic energy source with speeds of order the speed of light! This broadband variability, and the zero spectral index of the variable part of the spectra, are more consistent in principle with hot but optically thin emission ([Barvainis 1993]).
Excellent recent data on variability can be found in [Giveon et al. 1999]. The rates of flux variations may surprise you.
The rapid in-phase variability has led to the speculation that the energy is actually dissipated in a “corona,” thought also to produce the X-rays in the keV region. Then photons from the corona could heat the disk, rather than internal dissipation. This is a real “non-starter” since it’s energetically untenable for all objects except a few at the lowest luminosities. Remember that the rapid in-phase variability is a generic problem, known at least since 1985 to be applicable to luminous quasars as well as Seyferts. See Fig. 8 for a clear picture of these SEDs.
Although the energetics is totally damning for heating by the observed X-ray source, I’ll also mention that the 5-keV X-ray and optical continua do not vary together as expected in any object, though “second-order” predictions (or postdictions) are somewhat as expected in at least one object, according to Nandra et al. (1998, 2000). There sure doesn’t seem to be any near-IR vs. X-ray relationship ([Done et al. 1990]). Also a prediction of an unseen Ly edge in emission might be a problem with external illumination of a disk ([Sincell & Krolik 1997]).
The X-ray Fe K- profiles look like they could come from Kerr disks and I thought showed at least that there are passive disks present in AGN. However, the line (and “Compton hump”) variability is virtually inexplicable in that or any other picture; see [Weaver 2000] for a brief review.
I can’t think of any accretion-disk predictions that have come true, as far as producing the BBB is concerned. I don’t even think the passive-disk predictions for the K- line count for much until its variability properties can be reconciled with the disk picture. As Vince Lombardi might have said, in science prediction isn’t everything. It’s the only thing.
5 Conclusions
Polarization is a basic property of photons, just like frequency. It is often almost as densely coded with information! Radio astronomers generally make polarization observations automatically. If optical astronomers did the same, we might have some great discoveries. Many years ago the polarimetry optics absorbed a lot of photons, but now the total-flux spectrum accumulates almost as fast with the polarimeter as without it. Perhaps polarimetry should be the default in the optical for some programs. In particular, I don’t see why anyone would take total-flux spectra or images of distant AGN or ULIRGs or Scuba sources when they can get the polarization almost for free.
Acknowledgements.
Thanks are due M. Kishimoto, P. Ogle, D. Sanders, J. Ulvestad, D. Whysong, and B. Wills for comments on an earlier version of this paper. I thank Todd Hurt for use of his unpublished figure, and Makoto Kishimoto and David Whysong for many significant contributions to the paper.References
- Agol & Blaes (1996) Agol, E. & Blaes, O. 1996 Polarization from magnetized accretion discs in active galactic nuclei. MNRAS 282, 965.
- Alloin et al. (1985) Alloin, D., Pelat, D., Phillips, M. & Whittle, M. 1985 Recent spectral variations in the active nucleus of NGC 1566. ApJ. 288, 205.
- Alloin, Barvainis, Gordon & Antonucci (1992) Alloin, D., Barvainis, R., Gordon, M. A. & Antonucci, R. R. J. 1992 CO emission from radio quiet quasars - New detections support a thermal origin for the FIR emission. AAP 265, 429.
- Almaini, Lawrence & Boyle (1999) Almaini, O., Lawrence, A. & Boyle, B. J. 1999 The AGN contribution to deep submillimetre surveys and the far-infrared background. MNRAS 305, L59.
- Antonucci (1982) Antonucci, R. R. J. 1982(a) Optical polarization position angle versus radio source axis in radio galaxies. Natur. 299, 605.
- Antonucci (1982) Antonucci, R. R. J. 1982(b) Optical flux and polarization spectra compared with radio maps of radio galaxies. Ph.D. thesis, 1.
- Antonucci (1983) Antonucci, R. R. J. 1983 Optical polarization position angle versus radio structure axis in Seyfert galaxies. Natur. 303, 158.
- Antonucci & Ulvestad 1985 Antonucci, R. R. J. & Ulvestad, J. S. 1985 Extended radio emission and the nature of blazars. ApJ. 294, 158.
- Antonucci 1988 Antonucci, R. 1988, Polarization of active galactic nuclei and quasars. Supermassive Black Holes, 26.
- Antonucci, Kinney & Ford (1989) Antonucci, R. R. J., Kinney, A. L. & Ford, H. C. 1989 The Lyman edge test of the quasar emission mechanism. ApJ. 342, 64.
- Antonucci & Barvainis (1990) Antonucci, R. & Barvainis, R. 1990 Narrow-line radio galaxies as quasars in the sky plane. ApJ. Lett. 363, L17.
- Antonucci, Barvainis & Alloin (1990) Antonucci, R., Barvainis, R. & Alloin, D. 1990 The empirical difference between radio-loud and radio-quiet quasars. ApJ. 353, 416.
- Antonucci (1993) Antonucci, R. 1993 Unified models for active galactic nuclei and quasars. ARA&A 31, 473.
- Antonucci, Kinney, & Hurt(1993) Antonucci, R., Kinney, A. L., & Hurt, T. 1993, ApJ 414, 506.
- Antonucci, Hurt & Miller 1994 Antonucci, R., Hurt, T. & Miller, J. 1994 HST ultraviolet spectropolarimetry of NGC 1068. ApJ. 430, 210.
- Antonucci et al. (1996) Antonucci, R., Geller, R., Goodrich, R. W. & Miller, J. S. 1996, The Spectropolarimetric Test of the Quasar Emission Mechanism. ApJ. 472, 502.
- Antonucci, Hurt & Agol 1996 Antonucci, R., Hurt, T. & Agol, E. 1996 Spectropolarimetric Test of the Relativistic Disk Model for the Broad H alpha Line of ARP 102B. ApJ. Lett. 456, L25.
- Antonucci 1999 Antonucci, R. 1999 Constraints on Disks Models of The Big Blue Bump from UV/Optical/IR Observations. ASP Conf. Ser. 161: High Energy Processes in Accreting Black Holes, 193.
- Appenzeller et al. 1998 Appenzeller, I. et al. 1998 ORFEUS II Far-ultraviolet Observations of 3C 273: The Instrinsic Spectrum. ApJ. Lett. 500, L9.
- Baker 1997 Baker, J. 1997 MNRAS 286, 23
- Barthel 1987 Barthel, P. D. 1987 Feeling uncomfortable. Superluminal Radio Sources, 148.
- Barvainis 1992 Barvainis, R. 1992 Do accretion disks exist? IR through radio observations. Testing the AGN Paradigm, 129.
- Barvainis 1993 Barvainis, R. 1993 Free-free emission and the big blue bump in active galactic nuclei. ApJ. 412, 513.
- Barvainis & Lonsdale(1997) Barvainis, R. & Lonsdale, C. 1997, AJ 113, 144.
- Becker et al.(2000) Becker, R. H., White, R. L., Gregg, M. D., Brotherton, M. S., Laurent-Muehleisen, S. A., & Arav, N. 2000, ApJ 538, 72.
- Berriman (1989) Berriman, G. 1989 The origin of the optical polarizations of Seyfert 1 galaxies. ApJ. 345, 713.
- Best et al. 1997 Best, P. N., Longair, M. S. & Roettgering, J. H. A. 1997 HST, radio and infrared observations of 28 3CR radio galaxies at redshift Z of about 1. MNRAS 292, 758.
- Blaes & Agol (1996) Blaes, O. & Agol, E. 1996 Polarization near the Lyman Edge in Accretion Disk Atmophere Models of Quasars. ApJ. Lett. 469, L41.
- Brindle et al. (1990) Brindle, C., Hough, J. H., Bailey, J. A., Axon, D. J., Ward, M. J., Sparks, W. B. & McLean, I. S. 1990 An Optical and Near Infrared Polarization Survey of Seyfert and Broadline Radio Galaxies - Part Two - the Wavelength Dependence of Polarization. MNRAS 244, 604.
- Brotherton et al.(1997) Brotherton, M. S., Tran, H. D., van Breugel, W., Dey, A., & Antonucci, R. 1997, ApJ. Lett. 487, L113.
- Browne et al. 1982 Browne, I. W. A., Clark, R. R., Moore, P. K., Muxlow, T. W. B., Wilkinson, P. N., Cohen, M. H. & Porcas, R. W. 1982 MERLIN observations of superluminal radio sources. Natur. 299, 788.
- Capetti et al. (1995a) Capetti, A., Axon, D. J., Macchetto, F., Sparks, W. B. & Boksenberg, A. 1995 HST Imaging Polarimetry of NGC 1068. ApJ. 446, 155.
- Capetti et al. (1995b) Capetti, A., Macchetto, F., Axon, D. J., Sparks, W. B. & Boksenberg, A. 1995 Hubble Space Telescope Imaging Polarimetry of the Inner Nuclear Region of NGC 1068. ApJ. Lett. 452, L87.
- Capetti et al. 2000 Capetti, A. et al. 2000 Hubble Space Telescope Infrared Imaging Polarimetry of Centaurus A: Implications for the Unified Scheme and the Existence of a Misdirected BL Lacertae Nucleus. ApJ. 544, 269.
- Chen & Halpern (1990) Chen, K. & Halpern, J. P. 1990 Spectropolarimetric test of the relativistic disk model for the broad emission lines of active galactic nuclei. ApJ. Lett. 354, L1.
- Chen, Halpern & Titarchuk 1997 Chen, K., Halpern, J. P. & Titarchuk, L. G. 1997 Polarization of Line Emission from an Accretion Disk and Application to ARP 102B. ApJ. 483, 194.
- Chiaberge et al. 1999 Chiaberge, M., Capetti, A. & Celotti, A. 1999 The HST view of FR I radio galaxies: evidence for non-thermal nuclear sources. AAP 349, 77.
- Chiaberge et al. (2000) Chiaberge, M., Capetti, A. & Celotti, A. 2000 The HST view of the FR I / FR II dichotomy. AAP 355, 873.
- Cimatti et al. (1996) Cimatti, A., Dey, A., van Breugel, W., Antonucci, R., and Spinrod, H. 1996 ApJ 465, 145.
- Cohen et al. (1999) Cohen, M. H., Ogle, P. M., Tran, H. D., Goodrich, R. W. & Miller, J. S. 1999 Polarimetry and Unification of Low-Redshift Radio Galaxies. A.J. 118, 1963.
- Collin-Souffrin et al. (1988) Collin-Souffrin, S., Dyson, J. E., McDowell, J. C. & Perry, J. J. 1988 The environment of active galactic nuclei. I - A two-component broad emission line model. MNRAS 232, 539.
- Corbett et al. 1998 Corbett, E. A., Robinson, A., Axon, D. J., Young, S. & Hough, J. H. 1998 The profiles of polarized broad Halpha lines in radio galaxies. MNRAS 296, 721.
- Cutri et al. (1985) Cutri, R. M., Wisniewski, W. Z., Rieke, G. H. & Lebofsky, M. J. 1985 Variability and the nature of QSO optical-infrared continua. ApJ. 296, 423.
- Czerny & Pojmanski 1990 Czerny, B. & Pojmanski, G. 1990 Lyman edges in AGN accretion discs. MNRAS 245, 1P.
- Czerny & Zbyszewska 1991 Czerny, B. & Zbyszewska, M. 1991 Comptonization of the Lyman edge in active galactic nuclei. MNRAS 249, 634.
- Czerny, Jaroszynski & Czerny (1994) Czerny, B., Jaroszynski, M. & Czerny, M. 1994 Constraints on the Size of the Emitting Region in an Active Galactic Nucleus. MNRAS 268, 135.
- Dey et al. 1996 Dey, A., Cimatti, A., van Breugel, W., Antonucci, R. and Spinrod, H. 1996 ApJ 465, 157.
- Dey et al. 1997 Dey, A., van Breugel, W., Vacca, W. D. & Antonucci, R. 1997 Triggered Star Formation in a Massive Galaxy at Z = 3.8: 4C 41.17. ApJ. 490, 698.
- Done et al. 1990 Done, C., Ward, M. J., Fabian, A. C., Kunieda, H., Tsuruta, S., Lawrence, A., Smith, M. G. & Wamsteker, W. 1990 Simultaneous multifrequency observations of the Seyfert 1 galaxy NGC 4051 - Constant optical-infrared emission observed during large-amplitude X-ray variability. MNRAS 243, 713.
- Ekers & Simkin 1983 Ekers, R. D. & Simkin, S. M. 1983 Radio structure and optical kinematics of the cD galaxy Hydra A /3C 218/. ApJ. 265, 85.
- Elvius (1978) Elvius, A. 1978 Polarization of light in the Seyfert galaxy NGC 1068. AAP 65, 233.
- Eracleus and Halpern (2001) Eracleus, M. and Halpern, J. 2001 A certified LINER with broad variable emission lines. Ap. J. (in press); also astro-ph/0101050.
- Evans et al. (2001) Evans, A. S., Frayer, Surace, J. A., Sanders, D. B. 2001 Molecular Gas in Infrared-Excess, Optically-Selected QSOs and the Connection with Infrared Luminous Galaxies. AJ, in press - also astro-ph 0101308.
- Falcke, Sherwood, & Patnaik(1996) Falcke, H., Sherwood, W., & Patnaik, A. R. 1996, ApJ 471, 106.
- Francis 1996 Francis, P. J. 1996 The continuum slopes of optically selected QSOs. Publications of the Astronomical Society of Australia 13, 212.
- Geller et al. (2000) Geller, R. M., Sault, R. J., Antonucci, R., Killeen, N. E. B., Ekers, R., Desai, K. & Whysong, D. 2000 Cosmological Halos: A Search for the Ionized Intergalactic Medium. ApJ. 539, 73.
- Genzel et al. (1998) Genzel, R. et al. 1998 What Powers Ultraluminous IRAS Galaxies? ApJ. 498, 579.
- Giveon et al. 1999 Giveon, U., Maoz, D., Kaspi, S., Netzer, H. & Smith, P. S. 1999 Long-term optical variability properties of the Palomar-Green quasars. MNRAS 306, 637.
- Gnedin & Silantev (1978) Gnedin, I. N. & Silantev, N. A. 1978 Polarization effects in the emission of a disk of accreting matter. Soviet Astronomy 22, 325.
- González Delgado et al. (1998) González Delgado, R. M., Heckman, T., Leitherer, C., Meurer, G., Krolik, J., Wilson, A. S., Kinney, A. & Koratkar, A. 1998 Ultraviolet-Optical Observations of the Seyfert 2 Galaxies NGC 7130, NGC 5135, and IC 3639: Implications for the Starburst-Active Galactic Nucleus Connection. ApJ. 505, 174.
- Goodrich (1989) Goodrich, Robert W. 1989 Spectropolarimetry of ‘narrow-line’ Seyfert 1 galaxies. ApJ. 342, 224.
- Goodrich & Miller (1994) Goodrich, R. W. & Miller, J. S. 1994 Spectropolarimetry of high-polarization Seyfert 1 galaxies: Geometry and kinematics of the scattering regions. ApJ. 434, 82.
- Goodrich et al. (1996) Goodrich, R. W., Miller, J. S., Martel, A., Cohen, M. H., Tran, H. D., Ogle, P. M. & Vermeulen, R. C. 1996 FSC 10214+4724: A Gravitationally Lensed, Hidden QSO. ApJ. Lett. 456, L9.
- Goodrich(1997) Goodrich, R. W. 1997, ApJ. 474, 606.
- Gopal-Krishna et al. (1996) Gopal-Krishna, Kulkarni, V. K. & Wiita, P. J. 1996 The Linear Sizes of Quasars and Radio Galaxies in the Unified Scheme. ApJ. Lett. 463, L1.
- Gopal-Krishna & Biermann 1998 Gopal-Krishna & Biermann, P. L. 1998 Are ultra-luminous infrared galaxies the dominant extragalactic population at high luminosities? AAP 330, L37.
- Gregg et al.(2000) Gregg, M. D., Becker, R. H., Brotherton, M. S., Laurent-Muehleisen, S. A., Lacy, M., & White, R. L. 2000, ApJ 544, 142.
- Halpern, Eracleous, Filippenko, & Chen(1996) Halpern, J. P., Eracleous, M., Filippenko, A. V., & Chen, K. 1996, ApJ 464, 704.
- Heckman et al. (1995) Heckman, T. et al. 1995 The Nature of the Ultraviolet Continuum in Type 2 Seyfert Galaxies. ApJ. 452, 549.
- Heisler, Lumsden & Bailey (1997) Heisler, C. A., Lumsden, S. L. & Bailey, J. A. 1997 Visibility of scattered broad-line emission in Seyfert 2 galaxies. Natur. 385, 700.
- Hines et al. (1999) Hines, D. C., Schmidt, G. D., Wills, B. J., Smith, P. S., and Sowindki, L. G. 1999 ApJ 512, 145.
- Hurt et al. 1999 Hurt, T., Antonucci, R., Cohen, R., Kinney, A. & Krolik, J. 1999 Ultraviolet Imaging Polarimetry of Narrow-Line Radio Galaxies. ApJ. 514, 579.
- Hutsemékers & Lamy(2000) Hutsemékers, D. & Lamy, H. 2000, AAP 358,
- Impey & Neugebauer (1988) Impey, C. D. & Neugebauer, G. 1988 Energy distributions of blazars. A.J. 95, 307.
- Jaffe et al. (1996) Jaffe, W., Ford, H., Ferrarese, L., van den Bosch, F. & O’Connell, R. W. 1996 The Nuclear Disk of NGC 4261: Hubble Space Telescope Images and Ground-based Spectra. ApJ. 460, 214.
- Kay (1994) Kay, L. E. 1994 Blue spectropolarimetry of Seyfert 2 galaxies. 1: Analysis and basic results. ApJ. 430, 196.
- Kishimoto (1999) Kishimoto, M. 1999 The Location of the Nucleus of NGC 1068 and the Three-dimensional Structure of Its Nuclear Region. ApJ. 518, 676.
- Kishimoto et al. (2000) Kishimoto, M., Antonucci. R., Cimatti, A., Hurt, T., Dey, A., van Breugel, W., Spinrad, H. 2000 UV Spectropolarimetry of Narrow-line Radio Galaxies.
- Knapp & Patten (1991) Knapp, G. R. & Patten, B. M. 1991 Millimeter and submillimeter observations of nearby radio galaxies. A.J. 101, 1609.
- Kollgaard et al. 1992 Kollgaard, R. I., Wardle, J. F. C., Roberts, D. H., Gabuzda, D. C. 1992 Radio constraints on the nature of BL Lacertae objects and their parent population. Astronomical Journal vol. 104, p. 1687.
- Kolykhalov & Sunyaev (1984) Kolykhalov, P. I. & Sunyaev, R. A. 1984 Radiation of accretion disks in quasars and galactic nuclei. Advances in Space Research 3, 249.
- Koratkar et al. 1995 Koratkar, A., Antonucci, R. R. J., Goodrich, R. W., Bushouse, H. & Kinney, A. L. 1995 Quasar Lyman Edge Regions in Polarized Light. ApJ. 450, 501.
- Koratkar et al. (1998) Koratkar, A., Antonucci, R., Goodrich, R. & Storrs, A. 1998 Below the Lyman Edge: Ultraviolet Polarimetry of Quasars. ApJ. 503, 599.
- Koratkar & Blaes (1999) Koratkar, A. & Blaes, O. 1999 The Ultraviolet and Optical Continuum Emission in Active Galactic Nuclei: The Status of Accretion Disks. PASP 111, 1.
- Krolik & Begelman (1986) Krolik, J. H. & Begelman, M. C. 1986 An X-ray heated wind in NGC 1068. ApJ. Lett. 308, L55.
- Krolik & Begelman (1988) Krolik, J. H. & Begelman, M. C. 1988 Molecular tori in Seyfert galaxies - Feeding the monster and hiding it. ApJ. 329, 702.
- Krolik et al. 1991 Krolik, J. H., Horne, K., Kallman, T. R., Malkan, M. A., Edelson, R. A. & Kriss, G. A. 1991 Ultraviolet variability of NGC 5548 - Dynamics of the continuum production region and geometry of the broad-line region. ApJ. 371, 541.
- Krolik & Voit(1998) Krolik, J. H. & Voit, G. M. 1998, ApJ. Lett. 497, L5.
- Laing 1988 Laing, R. A. 1988 The sidedness of jets and depolarization in powerful extragalactic radio sources. Natur. 331, 149.
- Lamy & Hutsemékers(2000) Lamy, H. & Hutsemékers, D. 2000, AAP 356, L9.
- Landau et al. (1986) Landau, R. et al. 1986 Active extragalactic sources — Nearly simultaneous observations from 20 centimeters to 1400Å. ApJ. 308, 78.
- Laor (1990) Laor, A. 1990 AGN Accretion Discs — Part Three — Comparison with the Observations. MNRAS 246, 369.
- Laor, Jannuzi, Green & Boroson (1997) Laor, A., Jannuzi, B. T., Green, R. F. & Boroson, T. A. 1997 The Ultraviolet Properties of the Narrow-Line Quasar I ZW 1. ApJ. 489, 656.
- Lara et al. 1999 Lara, L., Márquez, I., Cotton, W. D., Feretti, L., Giovannini, G., Marcaide, J. M. & Venturi, T. 1999 The broad-line radio galaxy J2114+820. New Astronomy Review 43, 643.
- Leighly 2000 Leighly, K. M. 2000 STIS Ultraviolet Spectral Evidence for Outflows in Extreme Narrow-Line Seyfert 1 Galaxies. astro-ph/0012173
- Lutz, Veilleux & Genzel (1999) Lutz, D., Veilleux, S. & Genzel, R. 1999 Mid-Infrared and Optical Spectroscopy of Ultraluminous Infrared Galaxies: A Comparison. ApJ. Lett., 517, L13.
- Madejski et al. (2000 Madejski, G. M., Życki, P., Done, C., Valinia, A., Blanco, P., Rothschild, R. & Turek, B. 2000 Structure of the Circumnuclear Region of Seyfert 2 Galaxies Revealed by Rossi X-Ray Timing Explorer Hard X-Ray Observations of NGC 4945. ApJ. Lett. 535, 87.
- Maiolino et al. (1998) Maiolino, R., Salvati, M., Bassani, L., Dadina, M., della Ceca, R., Matt, G., Risaliti, G. & Zamorani, G. 1998. Heavy obscuration in X-ray weak AGNs. AAP 338, 781.
- Malkan (1983) Malkan, M. A. 1983 The ultraviolet excess of luminous quasars. II - Evidence for massive accretion disks. ApJ. 268, 582.
- Marconi et al. 2000 Marconi, A., Schreier, E. J., Koekemoer, A., Capetti, A., Axon, D., Macchetto, D. & Caon, N. 2000 Unveiling the Active Nucleus of Centaurus A. ApJ. 528, 276.
- Martel (1996) Martel, A. R. 1996 Spectropolarimetry of high-polarization Seyfert 1 galaxies. Ph.D. Thesis, 80.
- Martel (1998) Martel, A. 1998 New H Spectropolarimetry of NGC 4151: The Broad-Line Region-Host Connection. ApJ. 508, 657.
- Martin et al. (1983) Martin, P. G., Thompson, I. B., Maza, J., & Angel, J. R. P. 1983 The polarization of Seyfert galaxies. ApJ. 266, 470.
- Mathewson & Ford (1970) Mathewson, D. S. & Ford, V. L. 1970 Polarization observations of 1800 stars. MEMRAS 74, 139.
- Matt, Fabian & Ross 1993 Matt, G., Fabian, A. C. & Ross, R. R. 1993 X-Ray Photoionized Accretion Discs - Ultraviolet and X-Ray Continuum Spectra and Polarization. MNRAS 264, 839.
- McLean et al. 1983 McLean, I. S., Aspin, C., Heathcote, S. R. & McCaughrean, M. J. 1983 Is the polarization of NGC1068 evidence for a non-thermal source? Natur. 304, 609.
- Miller & Antonucci 1983 Miller, J. S. & Antonucci, R. R. J. 1983 Evidence for a highly polarized continuum in the nucleus of NGC 1068. ApJ. Lett. 271, 7.
- Miller & Goodrich (1990) Miller, J. S. & Goodrich, R. W. 1990 Spectropolarimetry of high-polarization Seyfert 2 galaxies and unified Seyfert theories ApJ. 355, 456.
- Miller, Goodrich & Mathews (1991) Miller, J. S., Goodrich, R. W. & Mathews, W. G. 1991 Multidirectional views of the active nucleus of NGC 1068. ApJ. 378, 47.
- Mineo et al. (2000) Mineo, T. et al. 2000 BeppoSAX broad-band observations of low-redshift quasars: spectral curvature and iron Kalpha lines. AAP 359, 471.
- Miyaji, Wilson & Perez-Fournon (1992) Miyaji, T., Wilson, A. S. & Perez-Fournon, I. 1992 The radio source and bipolar nebulosity in the Seyfert galaxy NGC 3516. ApJ. 385, 137.
- Mushotzky & Wandel 1989 Mushotzky, R. F. & Wandel, A. 1989 On the ratio of the infrared-to-ultraviolet continuum to the X-rays in quasars and active galaxies. ApJ. 339, 674.
- Nandra et al. (1998) Nandra, K., Clavel, J., Edelson, R. A., George, I. M., Malkan, M. A., Mushotzky, R. F., Peterson, B. M. & Turner, T. J. 1998 New Constraints on the Continuum Emission Mechanism of Active Galactic Nuclei: Intensive Monitoring of NGC 7469 in the X-Ray and Ultraviolet. ApJ. 505, 594.
- Nandra et al. (2000) Nandra, K., Le, T., George, I. M., Edelson, R. A., Mushotzky, R. F., Peterson, B. M. & Turner, T. J. 2000 Origin of the X-Ray and Ultraviolet Emission in NGC 7469. ApJ. 544, 734.
- Neugebauer et al. 1987 Neugebauer, G., Green, R. F., Matthews, K., Schmidt, M., Soifer, B. T. & Bennett, J. 1987 Continuum energy distributions of quasars in the Palomar-Green Survey. ApJ. Supp. 63, 615.
- Ogle et al.(1999) Ogle, P. M., Cohen, M. H., Miller, J. S., Tran, H. D., Goodrich, R. W., & Martel, A. R. 1999, ApJ. Supp 125, 1.
- Owen & Ledlow (1994) Owen, F. N. & Ledlow, M. J. 1994 The First Stromlo Symposium: The Physics of Active Galaxies. ASP Conference Series, Vol. 54, 1994, G.V. Bicknell, M.A. Dopita, and P.J. Quinn, Eds., p. 319.
- Owen, Eilek & Kassim (2000) Owen, F. N., Eilek, J. A. & Kassim, N. E. 2000 M87 at 90 Centimeters: A Different Picture. ApJ. 543, 611.
- Pier & Krolik (1993) Pier, E. A. & Krolik, J. H. 1993 Infrared Spectra of Obscuring Dust Tori around Active Galactic Nuclei. II. Comparison with Observations. ApJ. 418, 673.
- Rauch & Blandford (1991) Rauch, K. P. & Blandford, R. D. 1991 Microlensing and the structure of active galactic nucleus accretion disks. ApJ. Lett. 381, L39.
- Reimers et al. 1989 Reimers, D., Clavel, J., Groote, D., Engels, D., Hagen, H. J., Naylor, T., Wamsteker, W. & Hopp, U. 1989 The luminous quasar HS1700+6416 and the shape of the ‘big bump’ below 500 A. AAP 218, 71.
- Reynolds et al. 1996 Reynolds, C. S., di Matteo, T., Fabian, A. C., Hwang, U. & Canizares, C. R. 1996 The ‘quiescent’ black hole in M87. MNRAS 283, L111.
- Rodriguez-Pascual, Mas-Hesse & Santos-Lleo (1997) Rodriguez-Pascual, P. M., Mas-Hesse, J. M. & Santos-Lleo, M. 1997 The broad line region of narrow-line Seyfert 1 galaxies. AAP 327, 72.
- Rydbeck et al. 1993 Rydbeck, G., Wiklind, T., Cameron, M., Wild, W., Eckart, A., Genzel, R. & Rothermel, H. 1993 High resolution (C-12)O(2-1) observations of the molecular gas in Centaurus A. AAP 270, L13.
- Salvati & Maiolino (2000) Salvati, M. & Maiolino, R. 2000 Where are the Type 2 AGNs? Large Scale Structure in the X-ray Universe, Proceedings of the 20–22 September 1999 Workshop, Santorini, Greece, eds. Plionis, M. & Georgantopoulos, I., Atlantisciences, Paris, France, p. 277
- Sambruna et al. 2000 Sambruna, R. M., Chartas, G., Eracleous, M., Mushotzky, R. F. & Nousek, J. A. 2000 Chandra Uncovers a Hidden Low-Luminosity Active Galactic Nucleus in the Radio Galaxy Hydra A (3C 218). ApJ Lett. 532, L91.
- Sanders et al. (1989) Sanders, D. B., Phinney, E. S., Neugebauer, G., Soifer, B. T. & Matthews, K. 1989 Continuum Energy Distributions of Quasars: Shapes and Origins. ApJ. 347, 29.
- Sarazin et al. 1999 Sarazin, C. L., Koekemoer, A. M., Baum, S. A., O’Dea, C. P., Owen, F. N. & Wise, M. W. 1999 X-Ray Properties of B2 1028+313: A Quasar at the Center of the Abell Cluster A1030. ApJ. 510, 90.
- Scargle, Caroff, & Noerdlinger(1970) Scargle, J. D., Caroff, L. J., & Noerdlinger, P. D. 1970, ApJ. Lett. 161, L115.
- Schmidt & Miller (1980) Schmidt, G. D. & Miller, J. S. 1980 The spectrum and polarization of the nucleus of NGC 4151. ApJ., 240, 759.
- Schmidt & Hines(1999) Schmidt, G. D. & Hines, D. C. 1999, ApJ 512, 125.
- Schmidt & Smith 2000 Schmidt, Gary D. & Smith, Paul S. 2000 Evidence for Polarized Synchrotron Components in Radio-Optical Aligned Quasars. ApJ. in press, or astro-ph0008168.
- Siemiginowska & Dobrzycki 1990 Siemiginowska, A. & Dobrzycki, A. 1990 Accretion disk in the high-redshift quasar HS 1700 + 6416. AAP 231, L1.
- Sincell & Krolik 1997 Sincell, M. W. & Krolik, J. H. 1997, The Vertical Structure and Ultraviolet Spectrum of X-Ray–irradiated Accretion Disks in Active Galactic Nuclei. ApJ. 476, 605.
- Singal (1993) Singal, A. K. 1993 Evidence against the unified scheme for powerful radio galaxies and quasars. MNRAS 262, L27.
- Singh & Westergaard (1992) Singh, K. P. & Westergaard, N. J. 1992 Radio structure of the Seyfert galaxy Markarian 509. AAP 264, 489.
- Stockman, Angel, & Miley 1979 Stockman, H. S., Angel, J. R. P., & Miley, G. K. 1979 Alignment of the optical polarization with the radio structure of QSOs. ApJ. Lett. 227, 55.
- Stockman, Hier, & Angel(1981) Stockman, H. S., Hier, R. G., & Angel, J. R. P. 1981, ApJ 243, 404.
- Surace, Sanders & Evans (2000) Surace, J. A., Sanders, D. B. & Evans, A. S. 2000 High-Resolution Optical/Near-Infrared Imaging of Cool Ultraluminous Infrared Galaxies. ApJ. 529, 170.
- Thompson & Martin (1988) Thompson, I. B. & Martin, P. G. 1988 Optical polarization of Seyfert galaxies. ApJ. 330, 121.
- Tran, Miller & Kay (1992) Tran, H. D., Miller, J. S. & Kay, L. E. 1992 Detection of obscured broad-line regions in four Seyfert 2 galaxies. ApJ. 397, 452.
- Tran (1995a) Tran, H. D. 1995(a) The Nature of Seyfert 2 Galaxies with Obscured Broad-Line Regions. II. Individual Objects. ApJ. 440, 578.
- Tran (1995b) Tran, H. D. 1995(b) The Nature of Seyfert 2 Galaxies with Obscured Broad-Line Regions. III. Interpretation. ApJ. 440, 597.
- Tran, Cohen & Goodrich (1995) Tran, H. D., Cohen, M. H. & Goodrich, R. W. 1995 Keck Spectropolarimetry of the Radio Galaxy 3C 234. A.J. 110, 2597.
- Tytler & Davis 1993 Tytler, D. & Davis, C. 1993 On the Lack of Emission or Absorption in the Lyman Continua of Qsos: what is the Source of the Lyman Continuum Radiation, and where are the Broad Line Clouds? American Astronomical Society Meeting 183, 9106.
- Ulvestad, Antonucci & Goodrich (1995) Ulvestad, J. S., Antonucci, R. R. J. & Goodrich, R. W. 1995 Radio properties of narrow-lined Seyfert 1 galaxies. A.J. 109, 81.
- van Bemmel & Bertoldi 2001 van Bemmel, I. and Bertoldi, F. preprint 2001 Millimeter observations of radio-loud active galaxies. astro-ph 0101137
- Vermeulen et al. 1995 Vermeulen, R. C., Ogle, P. M., Tran, H. D., Browne, I. W. A., Cohen, M. H., Readhead, A. C. S., Taylor, G. B. & Goodrich, R. W. 1995 When Is BL Lac Not a BL Lac? ApJ. Lett. 452, L5.
- Vernet et al. 2001 Vernet, J., Fosbury, R. A. E., Villar-Martin, M., Cohen, M. H., Cimatti, A., di Serego Alighieri, S., and Goodrich, R. W. 2001 Astron. Astrophys. 366, 7.
- Vignati et al. (1999) Vignati, P. et al. 1999 BeppoSAX unveils the nuclear component in NGC 6240. AAP 349, L57.
- Walter & Fink 1993 Walter, R. & Fink, H. H. 1993 The Ultraviolet to Soft X-Ray Bump of SEYFERT-1 Type Active Galactic Nuclei. AAP 274, 105.
- Weaver 2000 Weaver, K. A. 2000 Probing Dense Matter in the cores of AGN: Observations with RXTE and ASCA To appear in “Proceedings of X-ray Astronomy ’99 - Stellar Endpoints, AGN and the Diffuse Background,” 2000. G. Malaguti, G. Palumbo & N. White (eds), Gordon & Breach (Singapore)
- Weymann, Morris, Foltz, & Hewett(1991) Weymann, R. J., Morris, S. L., Foltz, C. B., & Hewett, P. C. 1991, ApJ 373, 23.
- Wills et al.(1992) Wills, B. J., Wills, D., Evans, N. J., Natta, A., Thompson, K. L., Breger, M., & Sitko, M. L. 1992, ApJ 400, 96.
- Wills and Brotherton (1995) Wills, B. J. and Brotherton, M. S. 1995 An Improved Measure of Quasar Orientation ApJ 448 L81.
- Wolfe (1978) Wolfe, A. M. 1978 Pittsburgh Conference on BL Lac Objects, Pittsburgh, Pa., University of Pittsburgh, 1978. 439 p.
- Wrobel & Lind 1990 Wrobel, J. M. & Lind, K. R. 1990 The double-lobed blazar 3C 371. ApJ. 348, 135.
- Young et al. (1996) Young, S., Hough, J. H., Efstathiou, A., Wills, B. J., Axon, D. J., Bailey, J. A. & Ward, M. J. 1996 Scattered broad optical lines in the polarized flux spectrum of the FR II galaxy 3C 321. MNRAS 279, L72.
- Zheng et al. (1998) Zheng, W., Kriss, G. A., Telfer, R. C., Grimes, J. P. & Davidsen, A. F. 1998 A Composite HST Spectrum of Quasars. ApJ. 492, 855.