X-ray spectra of accretion discs with dynamic coronae
Abstract
We compute the X-ray spectra produced by non-static coronae atop accretion discs around black holes and neutron stars. The hot corona is radiatively coupled to the underlying disc (the reflector) and generates an X-ray spectrum which is sensitive to the bulk velocity of the coronal plasma, . We show that an outflowing corona reproduces the hard-state spectrum of Cyg X-1 and similar objects. The dynamic model predicts a correlation between the observed amplitude of reflection and the X-ray spectrum slope since both strongly depend on . A similar correlation was observed and its shape is well fitted by the dynamic model. The scattering of soft radiation in an outflowing corona can also account for the observed optical-UV polarization pattern in active galactic nuclei.
keywords:
accretion, accretion discs – radiative transfer – gamma-rays: theory – galaxies: Seyfert – X-rays: general – stars: individual: Cyg X-11 Introduction
The hard X-ray spectra of galactic black holes (GBHs) and active galactic nuclei (AGN) indicate the presence of hot plasmas with temperature keV and scattering optical depth in the vicinity of accreting black holes (see reviews by Zdziarski et al. 1997; Poutanen 1998). The plasma can be identified with a corona of a black hole accretion disc (e.g. Bisnovatyi-Kogan & Blinnikov 1977; Liang 1979; Galeev, Rosner & Vaiana 1979; see Beloborodov 1999a for a recent review, hereafter B99a). The corona is likely to form as a result of magnetorotational instabilities in the disc and the buoyancy of the generated magnetic field (Tout & Pringle 1992; Miller & Stone 2000). The corona is probably heated in flare-like events of magnetic dissipation producing the variable X-ray emission.
The dominant cooling mechanism of the flaring plasma is Compton cooling. The observed hard X-rays are generated by the Comptonization process, i.e. by multiple upscattering of seed soft photons by the hot electrons in the corona. The Comptonization generally produces power-law X-ray spectra. In addition to the direct power-law radiation from the corona, one also observes the X-rays reflected by the underlying (relatively cold) accretion disc (e.g. George & Fabian 1991). The arising reflection features in the spectrum, in particular, the Compton bump and the fluorescent iron line provide diagnostics for accretion models.
The cold accretion disc partly reemits the incident X-rays in the form of soft thermal radiation. This radiation cools the corona, providing the feedback loop which regulates the temperature of the corona (Haardt & Maraschi 1993, hereafter HM93). The geometry of the corona can hardly be derived from first principles. It might be a large cloud covering the whole inner region of the disc. It may also be a number of small-scale blobs with short life-times, with the energy release concentrated in space and time. The resulting X-ray spectrum is however not sensitive to the exact shape of the cloud, its density distribution, and other details. The only important parameter is the effective feedback factor (HM93; Stern et al. 1995b; PS96; Svensson 1996) that is the fraction of the X-ray luminosity which reenters the source after reprocessing.
Previous computations of the disc-corona models all assumed that the corona is static (e.g. HM93; Stern et al. 1995b; Poutanen & Svensson 1996, hereafter PS96; see Svensson 1996, Poutanen 1998 for a review). The model was successfully applied to Seyfert 1 AGN, however, it was found to disagree with observations of some black-hole sources in the hard state, for instance, Cyg X-1 (see e.g. Gierliński et al. 1997 and Section 3). Three alternatives have been suggested: (i) the cold disc is disrupted in the inner region (e.g. Poutanen, Krolik & Ryde 1997; Esin et al. 1998), (ii) the disc is highly ionised (Ross, Fabian & Young 1999; Nayakshin, Kazanas & Kallman 2000), and (iii) the coronal plasma is moving away from the disc and emits beamed X-rays (Beloborodov 1999b, hereafter B99b). We here study the third scenario.
B99b showed that the static model is not self-consistent for -dominated flares and argued that the hot plasma should be ejected with a mildly relativistic bulk velocity . The bulk acceleration is also efficient in flares dominated by normal plasma if the compactness parameter of the flare exceeds (B99a). The likely pattern of ejection resembles that of solar flares (scaled to higher velocities because of higher compactness). The ejection velocity may be directed away or towards the disc (and it may change) with the preferential direction away from the disc.
Mildly relativistic bulk motion causes aberration of the X-ray emission and strongly affects both the amplitude of reflection and the spectrum slope . Using a simple analytical model, B99b estimated the dependence of and on and found that the low amplitude of reflection and the spectrum hardness observed in the hard state of Cyg X-1 can be explained with . The model also explains the observed correlation between and (B99a; Zdziarski, Lubiński & Smith 1999; Gilfanov, Churazov & Revnivtsev 2000).
In the present paper, we perform exact computations of the X-ray spectra produced by dynamic coronae. We use a non-linear Monte-Carlo code (Malzac & Jourdain 2000) which is based on the large-particle method (Stern 1985; Stern et al. 1995a). The formulation of the problem and details of simulations are described in Section 2. In Section 3, we compute the spectra in the static case which was well studied previously and illuminate the problem of static models. In Section 4, we present spectra from dynamic coronae. The results are compared with observations in Section 5.
2 Setup
2.1 A heated cylinder
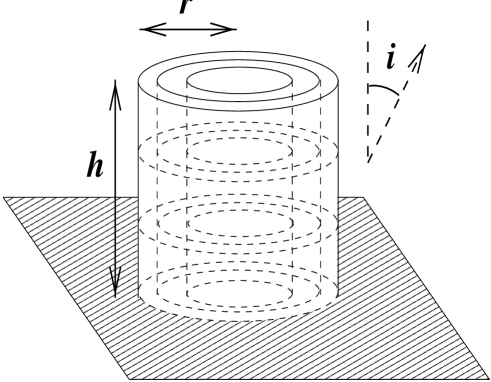
Consider a cylinder of radius and height located atop the accretion disc (Fig. 1). The cylinder may be associated with a hot outflow covering the disc or a heated magnetic tube in a compact flare. In the limit we get a slab geometry of the corona, which has the largest feedback. In the opposite case, , the feedback tends to zero (most of the reprocessed radiation goes away from the cylinder). We study the sequence of geometries parametrized with the ratio . The plasma in the cylinder is assumed to have a constant density and it is heated homogeneously with a constant rate.
The plasma moves through the cylinder with a velocity directed normally to the disc. We assume that the heated cylindrical volume is static with respect to the disc. The plasma motion then implies a flux of particles through the cylinder. If then the particle flux is absorbed by the disc at the bottom. If then the particles escape through the top of the cylinder. Outside the heated region, the particles are immediately (on a time-scale ) cooled down to the Compton temperature of the radiation field, keV. In our simulations, we do not take into account the scattering on the escaped cold particles. Their density is likely to be reduced if the plasma flows out along diverging magnetic lines.
In this paper, we restrict our consideration to thermal coronae and assume that the heated electrons have a Maxwellian distribution with a temperature in the plasma rest frame. The cylinder is divided into nine cells of equal volumes (see Fig. 1) and the temperature is calculated from the local heating=cooling balance in each of the cells separately. Note that the resulting equilibrium temperature is not homogeneous.
2.2 Feedback
The X-rays from the corona strike the underlying disc and get reprocessed. We assume that reprocessed radiation is the main cooler of the coronal plasma and neglect soft radiation generated viscously inside the accretion disc. This should be a good approximation if the corona releases energy in the form of strong concentrated flares; then, locally, the soft flux from inside the disc is much smaller than the reprocessed flux111Yet, the total surface-integrated intrinsic luminosity of the cold disc does not need to be much smaller than the coronal luminosity since the covering factor of the corona may be small (Haardt, Maraschi & Ghisellini 1994).. We also neglect additional photon sources such as bremsstrahlung and cyclo-synchrotron emission in the corona (see e.g. Wardziński & Zdziarski 2000). An independent argument in favour of the reprocessed radiation as the main cooler comes from the observed correlation (Zdziarski et al. 1999; Gilfanov, Churazov & Revnivtsev 1999; see Section 5).
We assume that the reflecting material of the disc is sufficiently dense so that the ionisation parameter and the ionisation effects are weak (e.g. Życki et al. 1994). Then the albedo is small, , and most of the X-rays impinging the disc are reprocessed. We assume that the reprocessed flux has a quasi-blackbody spectrum (possibly diluted) with a constant temperature . In the simulations, we consider two cases: eV and eV, representing the typical blackbody temperatures in GBHs and AGN, respectively.
The feedback factor is defined as the ratio of the soft blackbody luminosity entering the cylinder, , to the total luminosity outgoing from the cylinder, . The Comptonization time-scale is quite short, , and we assume the heating rate to be steady on time-scales . Then the X-rays are generated in a quasi-stationary regime and the feedback factor determines the Compton amplification factor of the hot plasma through the relation
| (1) |
The amplification factor in its turn is the main magnitude controlling the spectral slope of the Comptonized radiation (see B99a and Section 4.3).
2.3 Radiative transfer and energy balance
We compute the plasma temperature simultaneously with the radiative transfer. Our code is based on the non-linear Large Particle Monte-Carlo method (Stern 1985; Stern et al. 1995a). In contrast to the standard Monte-Carlo technique, this method allows one to follow the path and successive interactions of photons and particles in parallel. The code is described and tested in Malzac & Jourdain (2000).
We start a simulation from an initial (non-equilibrium) state and follow the evolution of the system plasma plus radiation until a steady state is achieved. The time step is about . We compute the evolution of the temperature distribution in the cylinder from the local energy balance. The plasma gains energy owing to constant heating and loses energy via Compton cooling. The difference between heating and cooling determines the change of the temperature during each time step.
The radiative transfer (photon tracking) is dealt in the lab frame in the same way as for static coronae (Malzac & Jourdain 2000). The only difference is that the velocity of the scattering electron is generated from an isotropic Maxwellian distribution in the plasma rest frame and then it is Lorentz transformed to the lab frame.
In all simulations in this paper, we assume a constant density throughout the cylinder and parametrize our models by Thomson optical depth rather than a dissipation rate or compactness . Strictly speaking, the model is self-consistent for low temperatures or low compactnesses, when pair production is not important. In pair dominated blobs, the density cannot be assumed homogeneous: the density distribution is then determined by the local pair balance. Yet, models with pair production give similar results if they have same .
The model has four parameters: (i) Thomson optical depth (defined along the height of the cylinder), (ii) height to radius ratio of the cylinder , (iii) bulk velocity , and (iv) blackbody temperature . Given these parameters the code computes the emitted spectrum as a function of the inclination angle (the angle between the disc normal and the line of sight). We consider 10 angular bins of equal width . The spectra are averaged within each bin.
2.4 The intrinsic and reflected components
For each inclination we compute two components of the observed emission:
-
1.
The ‘intrinsic’ Comptonised X-rays, i.e. the photons coming to the observer directly after the upscattering in the hot blob. The slope of the intrinsic X-ray spectrum (the photon index ) is evaluated from a least-square fit in the 2 – 10 keV range.
-
2.
The reflected/reprocessed radiation from the underlying disc. We count only those reflected photons that are not scattered in the blob, thus accounting for the attenuation of reflection by the blob.
We model the reflector as an infinite slab and compute the reflection component assuming neutral reflecting material with standard abundances (Anders & Ebihara 1982). The amplitude of reflection is defined as the ratio of an observed reflected component to that expected from an isotropic point source illuminating the slab,
| (2) |
The simulations yield the intrinsic Comptonized spectrum emitted at an inclination and the reflected luminosity . We then compute the reflected luminosity for an isotropic point source with the same intrinsic spectrum and find from equation (2). We fitted some of our simulated spectra with the pexrav model (Magdziarz & Zdziarski 1995) under XSPEC. The best fit values we found for are very close to those derived using equation (2).
3 Static coronae
We have computed a set of static models () with different , , and , and determined and in the calculated spectra. The results are shown in Fig. 2. For simplicity, the presented amplitude of reflection is averaged over inclinations, .

3.1 Feedback, amplification, and the spectral index
In the static case, the feedback factor is determined mainly by the geometry of the cloud, i.e. by in our parametrization. We express the feedback factor as
| (3) |
where is the energy-integrated albedo of the disc. This equation defines the effective geometrical parameter for a static cloud (B99a,b). The difference is the fraction of reprocessed radiation that returns to the hot cloud. To the first approximation, can be associated with , where corresponds to the angular size of the cylinder base measured from its centre. Numerically, we find (see Fig. 3b).


As one can see from Fig. 3, the effective is not fully determined by but also depends on . The strongest dependence on is observed for flat geometries (): and substantially decrease as increases. This effect can be understood analytically. Consider a slab corona and denote the radiation fluxes outgoing from the slab at the bottom and the top as and , respectively. The reprocessed flux entering the slab from below is . The amplification factor is, by definition,
| (4) |
One can estimate the ratio by solving the radiative transfer equation in the Eddington approximation (see Rybicki & Lightman 1979, ch. 1) and assuming isotropic scattering. Taking into account that the energy sources are homogeneously distributed in the slab, we get
| (5) |
These expressions are in good agreement with the results of simulations (see Fig. 3, ). If is large, the radiation is trapped at the bottom, near the reflector. In the limiting case , one has , and . Then almost all the X-rays are reprocessed because the source emits most of them towards the reflector. The bottom layers of the slab are cold and emit a soft spectrum for which the disc albedo is close to zero (see Fig. 4b) and . Such a small results in the high (see Fig. 2c).
At small , the emitted spectrum hardens (Fig. 2c). This is caused by the fact that the number of photons scattered in an optically thin blob is small. When the Comptonized spectrum is made of fewer photons, the same luminosity can be emitted only if the average photon energy is high. This leads to a hard spectrum (Fig. 2c) with a break at high energies. The optically thin models have high temperatures (Fig. 2a): at fixed geometry and the product stays approximately constant (HM93; Stern et al. 1995b; Svensson 1996; see also Fig. 10) and hence an optically thin blob must be hotter.
Blobs with high (‘elongated cylinders’) have low feedback and the resulting spectrum is hard (Fig. 2c). This behaviour is known from previous simulations (see Svensson 1996 for a review; the previously computed spectra of detached spheres are similar to those of elongated cylinders). The product increases with ; for fixed it implies a growth of the plasma temperature with (Fig. 2a).
The emitted spectrum depends on . For this reason, we perform computations for GBHs ( eV) and AGN ( eV) separately. For the same and , we get a harder spectrum for GBHs than for AGN (despite the fact that the feedback factor and are not sensitive to ). The hardening is caused by two reasons: (i) The energy range in which the Comptonized luminosity is liberated is narrower in GBHs. Therefore, in order to radiate a given amount of luminosity, the spectrum has to harden and cut off at higher energy. (ii) Low- models are hot and have an anisotropy break in the spectrum (Stern et al. 1995b). In GBHs, this break is in the 2-10 keV band and affects the measured .

3.2 The amplitude of reflection
The reflection component produced beneath the blob is partly scattered and attenuated when passing through the blob. To the first approximation, the attenuation effect can be described analytically,
| (6) |
Here it is assumed that the fraction of the reflected luminosity goes directly to the observer. The remaining fraction, , is reflected at the base of the cylinder and attenuated when transmitted through the hot plasma. The cylinder optical depth seen by soft photons emitted at the base depends on and ; it equals for and vanishes at . We interpolate between the two extremes as and put this effective optical depth into the exponential in equation (6).
The attenuation formula (6) assumes that the scattered reflection component is completely destroyed. Indeed, the ‘Comptonised reflection’ component has a power-law spectrum where the reflection features (the Fe lines and the edge) disappear.
Equation (6) is in good agreement with the simulation results (see Fig. 2b). The attenuation effect is strong if is small (so that a large fraction of the reflected radiation has to pass through the cylinder) and if is large. In the optically thick regime, , almost all reflected photons reentering the cloud are Compton scattered and the attenuation effect saturates: further increase in does not reduce .
For elongated cylinders, the attenuation affects only a small fraction of the reflected luminosity and approaches unity at high . The reflection amplitude is higher in GBHs, especially in the high-temperature models (with small and large ) where substantially exceeds unity (see Fig. 2b). The explanation is as follows. The radiation scattered once is strongly anisotropic and collimated towards the reflector (HM93). In GBHs, because of relatively large temperature of seed soft photons, the first scattering order peaks above 1 keV and contributes significantly to the reflected flux. As a result, increases. By contrast, in AGN, the Comptonized emission above 1 keV is made of multiply scattered photons and the anisotropy effects are small.
3.3 anticorrelation
Models with small have soft spectra because of large feedback. These models also have lower reflection amplitudes because of stronger attenuation (see Section 3.2). Therefore, variations in produce an anticorrelation between and (Fig. 2d). The anticorrelation disagrees with the data (see Section 5). A static model with a neutral reflector never predicts a small simultaneously with a hard spectrum. In particular, the parameters and observed in Cyg X-1 and similar hard-state objects cannot be reproduced.
4 Dynamic coronae
4.1 Example spectra
In the dynamic case, , the corona spectrum is strongly affected by the bulk motion of the hot plasma. This is illustrated in Fig. 5 where we compare the cases and with the static case. The spectra are computed for the same optical depth, , and geometry, .
In the case of (plasma moves away from the disc), the observed Comptonized luminosity is enhanced as a result of relativistic aberration. The X-rays are beamed away from the disc, and the reprocessed and reflected luminosities are reduced. The low feedback leads to a hard intrinsic spectrum.
In the case of (plasma moves towards the disc), the Comptonized luminosity is beamed towards the disc and the reprocessed and reflected components are enhanced. The high feedback leads to a soft intrinsic spectrum.

Since is fixed in Fig. 5, a high (low) feedback leads to a low (high) coronal temperature. This causes the shift of the spectral break to lower energies with decreasing .
The moderate changes in the amplitude and direction of the bulk velocity thus induce crucial changes in the emitted spectra. Note that in most of our simulations, the bulk velocity is smaller than the thermal electron velocity (e.g. for keV).

4.2 The amplification factor
The low feedback at implies a high Compton amplification factor of the X-ray source (eq. 1). The main effect can be estimated analytically assuming that the source is isotropic in the plasma rest frame (see eq. 7 in B99b),
| (7) |
Here, and is the effective geometrical parameter which we take from the static model (see eq. 3 and Fig. 3b); a more exact definition of is given in B99b. at and monotonically increases with ; at equation (7) gives .
In Fig. 6 we compare the results of simulations with the analytical estimate (7). In the optically thin models (), we observe the reduction in for large positive compared to equation (7). This is caused by the anisotropy of scattering in the plasma rest frame (optically thin models have very high temperature, see Fig. 8a, and scatter preferentially downwards). At , is small and the agreement is good.
In the optically thick models (), we see that the actual value of at is smaller than that given by equation (7). This is caused by the trapping of radiation and its advection downwards by the moving plasma. The advection enhances the anisotropy of the blob radiation compared to the optically thin case. In the limiting case of large optical depths, the velocity of photon diffusion is smaller than the advection velocity, , so that almost no radiation can escape through the upper boundary. When viewed from the plasma rest frame, the effect can be understood by noting that both the bottom and top boundaries of the cylinder move upwards; as a result, the escape probability is larger for photons emitted towards the bottom boundary.
For the similar reason, equation (7) underestimates for high- models at . In this case, the radiation is advected towards the upper boundary, and it is strongly beamed away from the disc, more than in the optically thin case.
4.3 The spectral index
A simple functional shape suggested in B99a fits the results of the simulations,
| (8) |
The fitting parameters are , for GBHs ( eV) and , for AGN ( eV). These parameters are not far from those found by B99a in the case of a spherical blob: for both GBHs and AGN and and for GBHs and AGN, respectively. Equation (8) is a good approximation for models with in the range between 50 keV and 300 keV (Fig. 7).
Equation (8) combined with equation (7) yields the analytical dependence which we find to be in good agreement with the results of simulations (see Fig. 8c). Only for GBHs models with very high electron temperatures ( keV) the deviations exceed 0.1. The reasons of these deviations are the same as in the static case discussed in the end of Section 3.1.


4.4 The amplitude of reflection
Following the analysis of B99a,b, but accounting for the attenuation effect (see Section 3.2), we get an analytical formula for the reflection amplitude,
where, , and is the disc inclination. Here, the reflected luminosity is represented as a sum of two parts: the first one is reflected outside the cylinder base and does not experience any attenuation and the second one is reflected from the base and it is partially attenuated, depending on . When approaches unity (or ), the attenuation is not important and equation (4.4) becomes equation (3) in B99b:
| (10) |
Equation (4.4) is in good agreement with the simulations (see Fig. 8b). Substantial differences appear only in the case of low- GBH models. The differences are caused mainly by the anisotropy of scattering in the rest frame of the hot plasma. The similar effect was observed in the static GBH models (Fig. 2b) and discussed in Section 3.2.
4.5 correlation
Fig. 8d shows versus . Again we see that the analytical formulae are in quite good agreement with the results of simulations. The correlation is steeper in AGN than in GBHs. This is caused by the fact that is a flat function at small (see Section 4.3; the index in eq. 8 is smaller for AGN than that for GBHs).
The shape of the correlation also depends on the disc inclination: the reflection amplitude is very sensitive to at small inclinations and the correlation gets stretched in the vertical direction (see Fig. 9b).
4.6 Pair dominated coronae
A compact and energetic blob emitting hard X-rays may be mainly composed of pairs produced in reactions. In this case, the blob optical depth and temperature are determined by the compactness parameter , where is the power dissipated in the blob (see e.g. Stern et al. 1995a,b). The equilibrium is controlled by the balance between pair production and annihilation and is controlled by the energy balance.
We have calculated a set of pair-dominated dynamic models with the geometry. For simplification, we compute a global pair balance assuming a uniform pair distribution in the cylinder. The results are shown in Fig. 10.

At fixed , the model follows an equilibrium curve. We emphasize that the relation for plasma is the same as for normal plasma, since it is determined by the energy balance only (see HM93; Stern et al. 1995b; PS96) and the annihilation radiation does not contribute much to the total energy budget.
With increasing , the curve moves to the right. An increase in at fixed leads to an increase in the optical depth while the temperature does not change much. This is the ‘thermostat’ effect of pairs discussed previously in the static models (see Figs 2 and 3 in Svensson 1996). The typical values keV and inferred from observations (Zdziarski et al. 1997; Poutanen 1998) are obtained for large but possible values of the dissipation compactness, .
We now briefly discuss the correlation expected at fixed and varying . The correlation will be steeper compared to the case shown in Fig. 8d. At large , the equilibrium is large and here the track is close to that with . At , drops and the track approaches the curve.
5 Comparison to Observations
5.1 Broad-band spectra of individual sources
Fig. 11 shows the spectra of one GBH source, Cyg X-1, and one bright Seyfert 1 galaxy, IC 4329A, together with model spectra. We did not use a real fitting procedure (since each simulation takes a few hours on a modern workstation), instead, we used unfolded spectra and searched for similar spectra in our sample of models. We find that the spectrum of Cyg X-1 is well reproduced by the model with a bulk velocity , an optical depth , and . The inclination that gives the best agreement with the data, , is compatible with the current estimates (see Gierliński et al. 1999 and references therein).
For IC 4329A, we find , , and . The inclination, , is consistent with the Seyfert unification scheme stating that Seyfert 1s should be seen rather face-on (Antonucci 1993). Note that is smaller in the case of Cyg X-1.

5.2 correlation

Fig. 12 gives the observed correlation for Seyferts and GBHs (Zdziarski et al. 1999; Gilfanov et al. 1999). The correlation exists in individual objects observed at different periods as well as in a sample of sources. Such a correlation supports the hypothesis that it is the reprocessed/reflected radiation that cools the X-ray source via Comptonization.
The correlation expected in the dynamic corona model is similar in shape to the observed one, and we now try to fit the data with the model. As we showed in Section 4, the analytical model is a sufficiently good approximation to the results of exact simulations and it is reasonable to use this simple model in a fitting procedure instead of the exact transfer model (especially taking into account the uncertainties in the validity of assumptions such as homogeneous density and uniform heating of the blob).
The analytical model yields explicit expressions for (eq. 4.4) and (eqs. 7 and 8) for given parameters , , , and . For simplicity, we assume and fix the albedo at a reasonable value . The fit to correlation is shown in Fig. 12 for AGN and GBHs.
It is interesting to note that the correlations for AGN and GBHs cannot be fitted with the same value of . We find being lower for GBHs ( or equivalently ) than for AGN ( or ). This might indicate different geometries of emission regions in GBHs and AGN.
5.3 The beaming effects
The observed flux of the hard X-rays beamed away from the disc can dominate over the blackbody component when the disc is observed at small inclinations. The hard X-rays can dominate even if only a modest fraction of the accretion energy is dissipated in the corona. In the case of a patchy corona, the model predicts
| (11) |
Here is the ratio of the Comptonized luminosities emitted towards and away from the disc,
| (12) |
For example, in the case of Cyg X-1, taking and , one gets for or for , in agreement with the data (e.g. Di Salvo et al. 2000).
The beaming of the coronal X-rays may be tested in a sample of hard-state objects with known inclinations: should increase with . Also, the shape of correlation varies with (Fig. 9), which may be checked in the data on GBHs. Unfortunately, in the case of AGN, the high inclination objects are obscured by the large-scale molecular torus which dominates the reflection component.
The ejection model with predicts very soft spectra and large ratios . This situation might take place in some soft objects, e.g. Narrow Line Seyfert 1 galaxies (see Brandt 1999 for a review).
6 Discussion
6.1 Variability
The coronal emission should be variable, with a temporal pattern governed by the complicated processes of the magnetic field buoyancy and its dissipation in the corona. The ejection velocity can vary from flare to flare and the fit parameters of the observed spectrum should be taken with caution since they give only effective/average values.
The main X-ray emitting region probably extends through a decade in radius, and is likely to be different at different radii. Recent temporal studies (e.g. Gilfanov et al. 2000; Revnivtsev et al. 2000) suggest that harder spectra with lower reflection come from the inner radii. In the context of the dynamic corona model it would correspond to an increase of in the innermost region. The analysis of Cyg X-1 and GX 339-4 at different periods of the hard state showed that the typical variability time-scales grow when the spectrum hardens. This behaviour may indicate that the accretion is slower in the hardest periods (Beloborodov 2001).
6.2 Pair envelopes in quasars
In this paper, we neglected scattering on the particles escaped or created in collisions outside the heated region. In the brightest sources, with luminosities comparable to the Eddington limit, the hard X-rays from the flares will interact with each other and create an optically thick outflow covering the whole inner region of the accretion disc (Beloborodov 1999c). Such an outflow is relatively cold (at the Compton temperature, keV) and it has an equilibrium bulk velocity such that the radiative pressure from the disc is balanced by the Compton drag. The velocity is mildly relativistic ( increases from 0.3 at the base to 0.7 at the photosphere of the outflow) and the scattering of the disc/corona radiation in the outflow strongly affects the angular distribution of the observed luminosity. The reflection amplitude will then be suppressed whatever dynamics takes place in the compact flares hidden in the outflow.
6.3 Optical and UV polarization of Seyferts and quasars
The scattering of soft radiation in a dynamic corona is accompanied by a strong effect that can be tested in optical/UV observations: the polarization of scattered radiation is sensitive to . The polarization is perpendicular to the disc if and parallel otherwise (Beloborodov 1998). The observed optical polarization in non-blazar AGN is parallel to the radio jet that is presumably perpendicular to the accretion disc (Stockman, Moore & Angel 1984); it is consistent with the scattering in a mildly relativistic outflow.
In three of ten quasars with measured UV polarization, a steep rise in polarization was observed blueward of the Lyman limit (see Koratkar & Blaes 1999 for a review). The outflowing corona model may provide a natural explanation for this mysterious rise (Beloborodov & Poutanen 1999).
7 Conclusions
We performed detailed Monte-Carlo simulations of X-ray production by hot coronae atop accretion discs, and tested the model against the data. The main results are as follows.
-
1.
A static corona atop a neutral reflector is not able to produce the observed hard spectra with low reflection. Furthermore, changes in the coronal geometry produce an anticorrelation between the hard X-ray spectral slope and the amplitude of reflection . This anticorrelation is opposite to what is observed.
-
2.
The disc-corona model becomes consistent with the data if the hot plasma is dynamic, i.e. moves with a mildly relativistic bulk velocity, , with respect to the accretion disc. In particular, the spectrum of Cyg X-1 is reproduced by the model with , confirming the estimate of B99b.
-
3.
The observed correlation is well explained by varying . It suggests that may be the main parameter controlling the X-ray spectrum.
-
4.
The results of the simulations are in good agreement with the analytical description of B99a,b. We improved the analytical model by accounting for the attenuation of the reflection component by the hot plasma atop the disc (eq. 4.4).
-
5.
The optical and UV polarization properties of AGN are sensitive to the dynamics of the corona. The polarization data provide an independent indication for the mildly relativistic bulk motion.
ACKNOWLEDGMENTS
This work was supported by the Italian MURST grant COFIN98-02-15-41 (JM), the Swedish Natural Science Research Council (AMB, JP), the Anna-Greta and Holger Crafoord Fund (JP), and RFBR grant 00-02-16135 (AMB). We thank Andrzej Zdziarski and Marat Gilfanov for providing the correlation data, and Andrei F. Illarionov for comments on the manuscript.
References
- [] Anders E., Ebihara M., 1982, Geochim. Cosmochim. Acta, 46, 2363
- [] Antonucci R., 1993, ARA&A, 31, 473
- [ ] Beloborodov A. M., 1998, ApJ, 496, L105
- [ ] Beloborodov A. M., 1999a, in Poutanen J., Svensson R., eds, ASP Conf. Series Vol. 161, High Energy Processes in Accreting Black Holes. Astron. Soc. Pac., San Francisco, p. 295 (B99a)
- [ ] Beloborodov A. M., 1999b, ApJ, 510, L123 (B99b)
- [ ] Beloborodov A. M., 1999c, MNRAS, 305, 181
- [ ] Beloborodov A. M., 2001, Adv. Space Res., in press
- [ ] Beloborodov A. M., Poutanen J., 1999, ApJ, 517, L77
- [ ] Bisnovatyi-Kogan G. S., Blinnikov S. I., 1977, A&A, 59, 111
- [ ] Brandt W. N., 1999, in Poutanen J., Svensson R., eds, ASP Conf. Series Vol. 161, High Energy Processes in Accreting Black Holes. Astron. Soc. Pac., San Francisco, p. 166
- [ ] Di Salvo T., Done C., Życki P. T., Burderi L., Robba N. R., 2000, ApJ, in press (astro-ph/0010062)
- [ ] Esin A. A., Narayan R., Cui W., Grove J. E., Zhang S.-N., 1998, ApJ, 505, 854
- [ ] Galeev A. A., Rosner R., Vaiana G. S., 1979, ApJ, 229, 318
- [ ] George I. M., Fabian A. C., 1991, MNRAS, 249, 352
- [ ] Gierliński M., Zdziarski A. A., Done C., Johnson W. N., Ebisawa K., Ueda Y., Haardt F., Phlips B. F., 1997, MNRAS, 288, 958
- [ ] Gierliński M., Zdziarski A. A., Poutanen J., Coppi P. S., Ebisawa K., Johnson W. N., 1999, MNRAS, 309, 496
- [ ] Gilfanov M., Churazov E., Revnivtsev M., 1999, A&A, 352, 182
- [ ] Gilfanov M., Churazov E., Revnivtsev M., 2000, in Proc. 5th CAS/MPG Workshop on High Energy Astrophysics, in press (astro-ph/0002415)
- [ ] Haardt F., Maraschi L., 1993, ApJ, 413, 507 (HM93)
- [ ] Haardt F., Maraschi L., Ghisellini G., 1994, ApJ, 432, L95
- [ ] Koratkar A., Blaes O., 1999, PASP, 111, 1
- [ ] Liang E. P. T., 1979, ApJ, 231, L111
- [ ] Madejski G. M. et al., 1995, ApJ, 438, 672
- [ ] Magdziarz P., Zdziarski A. A., 1995, MNRAS, 273, 837
- [ ] Malzac J., Jourdain E., 2000, A&A, 359, 843
- [ ] Miller K. A., Stone J. M., 2000, ApJ, 534, 398
- [ ] Nayakshin S., Kazanas D., Kallman T. R., 2000, ApJ, 537, 833
- [ ] Poutanen J., 1998, in Abramowicz M. A., Björnsson G., Pringle J., eds, Theory of Black Hole Accretion Disks. Cambridge Univ. Press, Cambridge, p. 100
- [ ] Poutanen J., Svensson R., 1996, ApJ, 470, 249 (PS96)
- [ ] Poutanen J., Krolik J. H., Ryde F., 1997, MNRAS, 292, L21
- [ ] Revnivtsev M., Gilfanov M., Churazov E., 1999, A&A, 347, L23
- [ ] Revnivtsev M., Gilfanov M., Churazov E., 2000, A&A, submitted (astro-ph/9910423)
- [ ] Ross R. R., Fabian A. C., Young A. J., 1999, MNRAS, 306, 461
- [ ] Rybicki G. B., Lightman A. P., 1979, Radiative Processes in Astrophysics. Wiley, New York
- [ ] Stern B. E., 1985, SvA, 29, 306
- [ ] Stern B. E., Begelman M. C., Sikora M., Svensson R., 1995a, MNRAS, 272, 291
- [ ] Stern B. E., Poutanen J., Svensson R., Sikora M., Begelman M. C., 1995b, ApJ, 449, L13
- [ ] Stockman H. S., Moore R. L., Angel J. R. P., 1984, ApJ, 279, 485
- [ ] Svensson R., 1996, A&AS, 120, 475
- [ ] Tout C. A., Pringle J. E., 1992, MNRAS, 259, 604
- [ ] Wardziński G., Zdziarski A. A., 2000, MNRAS, 314, 183
- [ ] Zdziarski A. A., Johnson W. N., Poutanen J., Magdziarz P., Gierliński M., 1997, in Winkler C., Courvoisier T. J.-L., Durouchoux Ph., eds, Proc. 2nd INTEGRAL Workshop, The Transparent Universe, ESA SP-382. ESA, Noordwijk. p. 373
- [ ] Zdziarski A. A., Lubiński P., Smith D. A., 1999, MNRAS, 303, L11
- [ ] Życki P. T., Krolik J. H., Zdziarski A. A., Kallman T. R., 1994, ApJ, 437, 597