Evolution of spiral shocks in U Gem during outburst
Abstract
Time resolved spectroscopic observations of U Gem during its March 2000 outburst show strong spiral shocks in the accretion disk. During the plateau at maximum brightness the spiral shocks contribute 14% to the total He II flux. The two arms of the spiral show a distinctly different evolution during the outburst and decline, which indicates an asymmetric evolution in the disk.
1 Introduction
One of the major problems in accretion disk physics is the transport of angular momentum outwards through the disk. Known sources of viscosity fail by many orders of magnitude, signifying the presence of one or more additional mechanisms that should be very efficient in carrying off the angular momentum of disk material. One of these possible mechanisms is transport of angular momentum through tidally induced spiral arms. Although they had been predicted many times theoretically, first by Sawada, Matsuda and Hachisu in 1986, spiral shocks have only recently been detected observationally in accretion disks in Cataclysmic Variables (CVs). They were first detected in IP Peg in outburst (Steeghs, Harlaftis and Horne, 1997) and have now been confirmed in the same source (Harlaftis et al., 1999) and in EX Dra (Joergens, Spruit and Rutten, 2000). IP Peg, as well as EX Dra, belongs to the dwarf nova class of CVs. These are characterized by 2-5 magnitude outbursts that occur on irregular timescales (ranging from weeks to decades; see Warner, 1995, for an overview of CVs). It is during these outbursts that the spiral arms have been detected.
As shown by Steeghs and Stehle (1999; hereafter S&S99) the low Mach numbers (which is the ratio of the local gas velocity, often assumed Keplerian, and the speed of sound in the disk) and the large size of these disks make the expected spiral pattern an open two-armed spiral (e.g. Sawada et al., 1986, Różycka and Spruit 1993; Heemskerk 1994). This also causes them to be detected quite readily in spectroscopic observations. If spiral arms persist in accretion disks in quiescence they are expected to be more tightly wound due to the higher Mach numbers and the smaller size of the disk. This makes them much harder to be detected in spectroscopic observations (S&S99). Due to the very limited sample of systems with detected spiral arms (only two), and the limited number of observations during their outbursts, much of the origin, dynamics and evolution of spiral arms in accretion disks remains a mystery. Their dependence on outburst phase, orbital period, mass-ratio’s etc. is still largely unknown. Clearly a larger sample is needed. In this Letter I report on observations taken of U Gem, before and during its outburst in March 2000.
U Gem is the prototypical and first discovered CV (Hind, 1855). It is a dwarf nova system with a relatively long orbital period of 4h17m. It has been studied extensively photometrically (see e.g. Smak, 1993, and references therein) and shows grazing eclipses: the accretion disk is partially eclipsed, but the white dwarf remains visible during mid-eclipse. From photometry the system parameters have been deduced by many authors, but I will use the orbital period and ephemeris as determined by Marsh et al. (1990) and the values of Friend et al. (1990) for the mass of the white dwarf primary, (1.24 M⊙), the mass ratio, (=/=0.46) and the inclination (69.7∘). These give the projected velocity amplitudes and that are needed for the Doppler mapping procedure.
U Gem is known to undergo outbursts on timescales between 30 and 250 days (Warner 1995). The outburst in the spring of 2000 started on March 1, and lasted through March 21. In Figure 1 I show the photometric light curve of this outburst, compiled from observations of the American Association of Variable Star Observers (AAVSO; Mattei, 2000).
2 Observations and Data reduction
Spectroscopic data was obtained by Mike Calkins and Perry Berlind on eight different nights, using the 1.5m Tillinghast Telescope at the Fred Lawrence Whipple Observatory on Mt. Hopkins, AZ. The high throughput FAST spectrograph (Fabricant et al., 1998) was equipped with a Loral 512x2688 pixel CCD. We used a 1200 line grating, centered on 5050 Å, to cover 1000 Å at a resolution of 1.1Å. For the wavelength calibration arc spectra were taken every 30 minutes. An overview of the observations is given in Table 1.
The data was reduced using the ESO-MIDAS package with additionally written software. All spectra were optimally extracted and wavelength calibrated after standard de-biasing and flatfielding.
Although the spectrum covers multiple lines, I will in further concentrate on the spectral evolution of He ii 4686 Å, since this line most clearly shows the spiral arms during outburst. A full discussion of the spectral evolution of U Gem during the outburst will be given elsewhere.
3 Spectral evolution of He ii 4686Å.
Based on the outburst light curve of U Gem shown in Fig. 1, the observations are divided into four episodes (see Table 1): the observations from JD 2451551 until JD 245602 when the system was in quiescence form Episode I, the outburst observations at JD 2451614 constitute Episode II, at JD 2451615 constitute Episode III and at JD 2451617 constitute Episode IV.
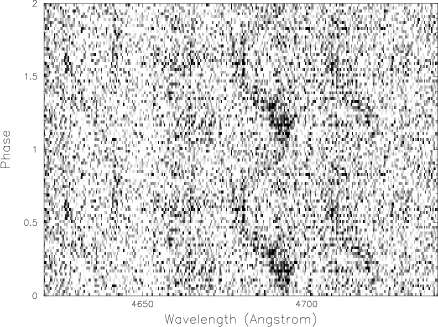
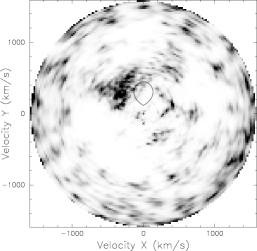
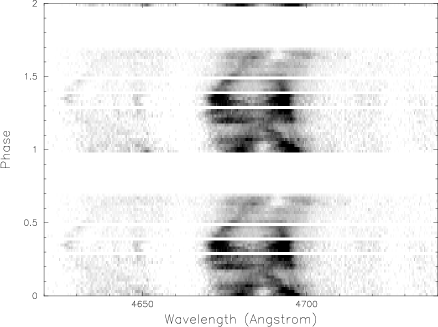
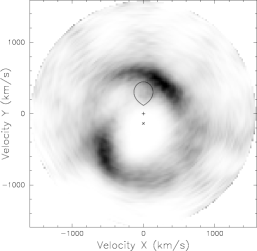
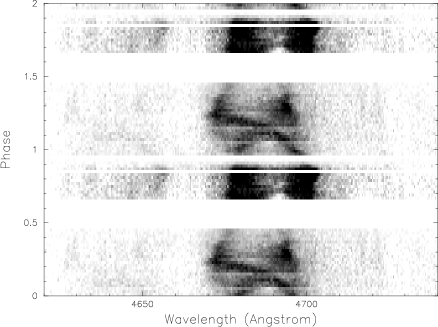
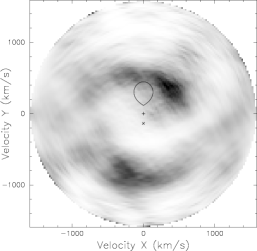
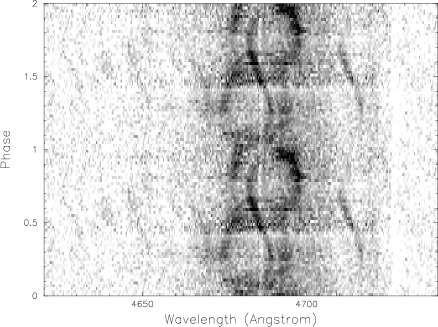
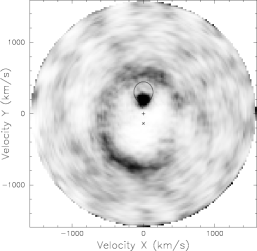
Figure 2 shows the trailed spectra of He ii 4686 (and during quiescence He i 4713 and during outburst the Bowen blend of C iii/N iii at 4650) in the left panel for the four different episodes. In the middle panel of Fig. 2 I show the Doppler maps (Marsh and Horne, 1988) of the trailed spectra on the left. Doppler tomography gives a time-averaged (over one or more orbits) remapping of the velocity information in the trailed spectra into velocity space. In the process of the Doppler mapping the azimuthal structure of the system is preserved, but the radial structure is inverted in a non-linear way. Since the (partial) eclipse violates the Doppler mapping assumption of equal visibility at all phases, the phases between 0.88 and 0.12 have not been included in the Doppler mapping.
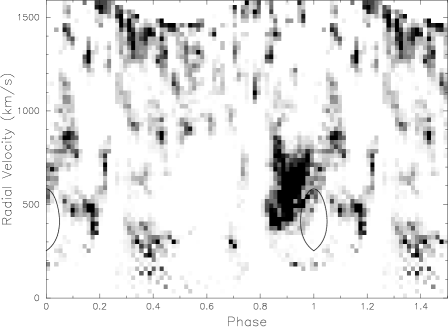
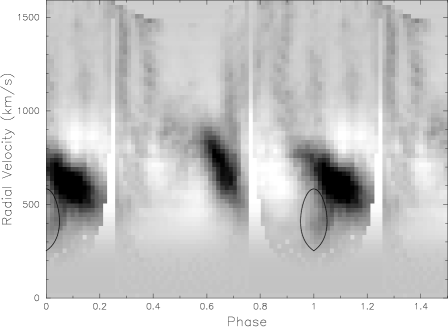
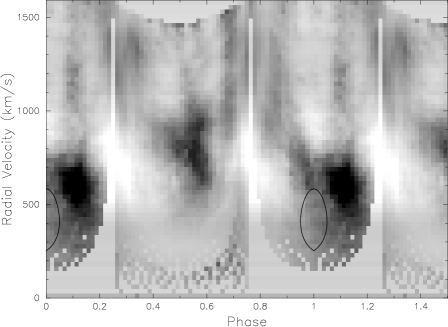
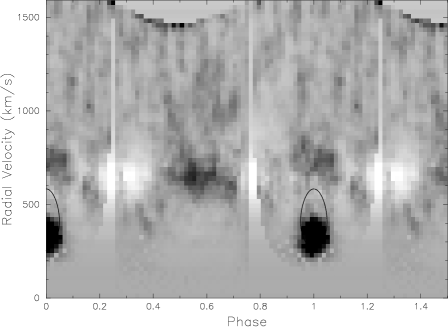
The right panel of Fig. 2 shows a transformation of the Doppler maps, the -plot, in which radial velocity from the white dwarf is shown as a function of the orbital phase. Here I retained the normal photometric phase. In this definition the secondary is located at phase zero. This representation is basically the two dimensional version of Fig. 4 in Harlaftis et al., (1999). The -plots shown here have the symmetric part of the disk emission subtracted. This symmetric part is determined by taking the median over all phases at each radial velocity. In this way we can estimate the fraction of flux coming from the spiral arms, although this will be a slight underestimate since the spiral arms are included in the determination of the median. The advantage of this projection is that the spiral arms map into linear features, whose relative positions and slopes can be determined more accurately than in a conventional Doppler map.
3.1 Pre-outburst
During Episode I the trailed spectrum shows a clear single S-wave. Doppler tomography identifies the hot-spot to be the origin of this He ii emission. The velocities lie in between the accretion stream trajectory and the Kepler velocity trail. This is a normal situation for hot-spot emission, where material in the disk and in the accretion stream mixes. From the position of the He ii emission we derive that the outer edge of the hot-spot is located at a position of 0.55 R and is located at an angle 20∘ away from the line joining the centers of the two stars, very similar to the results obtained by Marsh et al. (1990). The hot spot emission accounts for 46% of the total He ii flux at this episode.
3.2 Outburst: Accretion disk and secondary star emission
During the outburst episodes II, III and IV, clear spiral shocks are present in the disk in U Gem. As we can see from Fig. 1, Episode II and III were taken at the end of the maximum brightness plateau and Episode IV is taken during the decline of the outburst. During the outburst the non-symmetric part of the emission produced 14% (Episode II), 5.5% (Episode III) and 9.5% (Episode IV) of the total He ii flux. In Episode IV the majority of the 9.5% (7.8%) is on account of emission from the secondary. This secondary star emission is completely absent in Episodes II and III, showing that at this stage of the outburst the secondary, but not the spiral shock, is completely blocked from irradiation by the high energy radiation from the inner disk.
3.3 Outburst: Spiral arm evolution
Comparing the position and strength of the spiral arms between Episodes II, III and IV, we see not only a clear evolution of the spiral arms, but also a clear difference between the two arms. Let us label the two spiral arms as S0.6 for the one that is located around phase 0.6 and S0.1 for the one that is visible at phase 0.1 (the ‘lower’ and ‘upper’ arm, respectively, in the Doppler maps in Fig. 2). We can see in the right hand panel of Fig. 2 that S0.1 is stronger than S0.6 in Episode II and III, but not in Episode IV. However, the more remarkable differences are in the slopes of the spiral arms and the changes in these slopes. In Episode II the slope of S0.6 is –2600700 (estimated 3) km s-1 orbit-1 and for S0.1 this is –1300200 km s-1 orbit-1. In Episode III these numbers are –1740400 km s-1 orbit-1 for S0.6 and –1100200 km s-1 orbit-1 for S0.1 and in Episode IV –250140 km s-1 orbit-1 for S0.6 and –900170 km s-1 orbit-1 for S0.1. We see that, although for both arms the slopes decrease, for S0.6 this decrease is much more rapid and pronounced than for S0.1.
Judging the extent of the spiral arms is much more difficult and highly subjective. From the plots I estimate the phase extent of S0.6 to be 0.5-0.8 (Episode II), 0.4-0.6 (Episode III) and 0.4-0.7 (Episode IV) and for S0.1: 0.9-0.3 (Episode II), 0.9-0.2 (Episode III) and 0.9-0.4 (Episode IV), although the upper limit on the last number is arguable, and could also be 0.2, depending on what one believes is still genuine spiral arm emission.
4 Comparison with IP Peg, EX Dra and simulations
Spiral shocks have been convincingly detected in the outburst spectra of IP Peg (Steeghs et al., 1997 and Harlaftis et al., 1999) and EX Dra (Joergens et al., 1999). Especially the comparison with IP Peg is of relevance since this source has been observed during rise and maximum of an outburst, complementing the end of maximum and decline data shown here.
Comparing our Episode II data with the outburst maximum maps shown in Harlaftis et al. (1999) shows that there are similarities and clear differences. The fraction of He ii flux in the spiral arms (15%) is the same in both systems, but in U Gem there is no secondary star emission at all at the maximum of the outburst, whereas this is clearly seen in IP Peg. Also the spiral arms in U Gem seem to be rotated in phase towards later phases. The outburst maximum tomogram in IP Peg more closely resembles our Episode IV tomogram, which was taken during the decline of the outburst. The same comparison holds true for the spirals found in EX Dra, also taken at outburst maximum.
Comparison with simulations, most notably those of S&S99, shows a striking resemblance between the Episode II tomogram of U Gem presented here, and the low Mach number simulations shown there (e.g. their Figure 8). This is in contrast with the IP Peg, EX Dra and U Gem Episode IV tomograms, which all appear to have their maximum emissivity rotated anti-clock wise with respect to the simulations of S&S99.
5 Discussion
A possible evolutionary scenario for the spiral shocks one can derive from the comparison of these three systems is that the shocks appear immediately when the outburst starts (IP Peg; Steeghs et al., 1997), but not just prior to outburst (our Episode I), grow in strength when the outburst reaches its maximum magnitude (Harlaftis et al., 1999 and Joergens et al., 2000), and continue to gain in strength, or at least remain constant, during the plateau phase characteristic of many DN outbursts (our Episodes II and III), and then fade during outburst decline (our Episode IV).
This interpretation, however, neglects any differences in system parameters between U Gem, EX Dra and IP Peg. For instance, of these systems U Gem has the lowest inclination (69∘ vs. 80∘ for IP Peg and 84∘ for EX Dra), the most massive white dwarf (1.24M⊙, vs. 1.0 M⊙ for IP Peg and 0.75 M⊙ for EX Dra) and the most extreme mass ratio, ==0.46, vs. 0.64 for IP Peg and 0.74 for EX Dra (system parameters of IP Peg from Friend et al., 1990 and for EX Dra from Fiedler et al., 1997). All of these factors may be of (unknown relative) importance for the visibility and strength of the spiral shocks during outburst.
One of the main questions in spiral shock research is the question whether the shocks persist through quiescence and could serve as a funnel to transport the angular momentum outwards. So far, no spiral arms have been detected in quiescent dwarf novae. The data presented here show that the shocks certainly fade during the decline of the outburst. However, it is not clear if they also wrap up at the same time. S&S99 have shown that the spiral arms in quiescence should be tightly wrapped and will be difficult to observe. The rapid decrease in spiral shock slope (especially of the S0.6 arm) in the diagram could be taken as an indication of a ’wrapping’ up of the spiral arms, which would, to the observer, show up as a ’circulization’, i.e. a flattening of the slope, of the spiral shocks. The data presented here is, however, too scarce to draw a strong conclusion on this.
To the best of my knowledge, no theoretical investigation or modelling has shown a difference in the evolution of the spiral shock between the two arms, which is clearly seen in U Gem.
To disentangle the effect of spiral shock evolution and differences in system parameters, outbursting dwarf novae (at least IP Peg, EX Dra and U Gem) should be followed spectroscopically during a complete outburst. Certainly for U Gem, which reaches V9 during outburst maximum, this should not be a difficult task.
Acknowledgments I wish to thank Mike Calkins and Perry Berlind for obtaining the observations and Henk Spruit for the use of his dopmap programs. In this research, I have used, and acknowledge with thanks, data from the AAVSO International Database, based on observations submitted to the AAVSO by variable star observers worldwide. I thank the referee for her/his comments which improved the paper. PJG is supported by a Harvard-Smithsonian CfA fellowship.
References
- (1) Fabricant, D., Cheimets, P., Caldwell, N, and Geary, J., 1998, PASP 110, 79
- (2) Fiedler, H., Barwig, H. and Mantel, K.H., 1997, A&A 327, 173
- (3) Friend, M.T., Martin, J.S., Smith, R.C., Jones, D.H.P.,1990, MNRAS 246, 637
- (4) Groot, P.J., 2001, in preparation
- (5) Harlaftis, E.T., Steeghs, D., Horne, K., Martín, E., and Magazzu, A., 1999, MNRAS, 306, 348
- (6) Heemskerk, M., 1994, A&A 288, 807
- (7) Hind, J.R., 1855, MNRAS 16, 56
- (8) Joergens, V., Spruit, H.C. and Rutten, R.G.M., 2000, A&A 356, L33
- (9) Marsh, T.R and Horne, K., 1988, MNRAS 235, 269
- (10) Marsh, T.R., Horne, K., Schlegel, E.M., Honeycutt, R.K., Kaitchuck, R.H. 1990, ApJ 364, 637
- (11) Mattei, J., 2000, private communications
- (12) Różycka, M. and Spruit, H.C., 1993, Apj 417, 667
- (13) Sawada, K., Matsuda, T. and Hachisu, I., 1986, MNRAS 219, 75
- (14) Smak, J., 1993, AA 43, 121
- (15) Steeghs, D., Harlaftis, E.T. and Horne, K., 1997, MNRAS 290, L28
- (16) Steeghs, D., and Stehle, R., 1999, MNRAS 307, 99
- (17) Warner, B., 1995, Cataclysmic Variable Stars, Cambridge Astrophysics Series 28, Cambridge Univ. Press, Cambridge, UK.
- (18)
| Date | HJD Start–2450000 | Phase coverage | No. Obs. | Episode |
| 07/01/2000 | 1551.72567 | 78645.65 - 78647.50 | 95 | I |
| 27/01/2000 | 1571.78126 | 78759.01 - 78760.07 | 54 | I |
| 03/02/2000 | 1578.61545 | 78798.71 - 78799.75 | 108 | I |
| 13/02/2000 | 1588.74123 | 78854.88 - 78856.06 | 60 | I |
| 27/02/2000 | 1602.65477 | 78933.53 - 78934.58 | 54 | I |
| 10/03/2000 | 1614.61133 | 79001.98 - 79002.68 | 75 | II |
| 11/03/2000 | 1615.76881 | 79007.66 - 79008.44 | 40 | III |
| 13/03/2000 | 1617.65608 | 79018.33 - 79019.38 | 54 | IV |
|
|