The ages and colours of cool helium-core white dwarf stars
Abstract
The purpose of this work is to explore the evolution of helium-core white dwarf stars in a self-consistent way with the predictions of detailed non-gray model atmospheres and element diffusion. To this end, we consider helium-core white dwarf models with stellar masses of 0.406, 0.360, 0.327, 0.292, 0.242, 0.196 and 0.169 M⊙and follow their evolution from the end of mass loss episodes during their pre-white dwarf evolution down to very low surface luminosities.
We find that when the effective temperature decreases below 4000K, the emergent spectrum of these stars becomes bluer within time-scales of astrophysical interest. In particular, we analyse the evolution of our models in the colour-colour and colour-magnitude diagrams and we find that helium-core white dwarfs with masses ranging from 0.18 to 0.3 M⊙ can reach the turn-off in their colours and become blue again within cooling times much less than 15 Gyr and then remain brighter than 16.5. In view of these results, many low-mass helium white dwarfs could have had time enough to evolve to the domain of collision-induced absorption from molecular hydrogen, showing blue colours.
keywords:
stars: evolution - stars: interiors - stars: white dwarfs - stars: atmospheres - stars: fundamental parameters1 Introduction
The theoretical and observational study of white dwarf (WD) stars with helium cores (hereafter He WD) is a subject that has received increased attention particularly during the last few years. It is well known for instance that close binary evolution and mass loss episodes are required to form low-mass He WDs within the age of the Galaxy (see Iben & Livio 1993 for a review). These He WDs populate the tail of low-mass ( 0.4 M⊙) in the WD mass distribution (Bergeron, Saffer & Liebert 1992; Bragaglia, Renzini & Bergeron 1995 and Saffer, Livio & Yungelson 1998). The binary nature of these objects was first placed on a firm observational basis by Marsh (1995) and Marsh, Dhillon & Duck (1995). Since then, He WDs have been detected in numerous binary configurations involving either another WD or a neutron star (see, e.g., Lundgren et al. 1996; Moran, Marsh & Bragaglia 1997; Orosz et al. 1999; Maxted et al. 2000). Several He WDs have also been found in open and globular clusters (Landsman et al. 1997; Cool et al. 1998 and Edmonds et al. 1999). Evolutionary models appropriate for the study of He WDs have recently been presented by Althaus & Benvenuto (1997), Benvenuto & Althaus (1998), Hansen & Phinney (1998a) and Driebe et al. (1998).
The determination of ages for low-mass He WDs is a longstanding problem in the study of the evolution of these stars. As a matter of fact, cooling ages for He WD are intimately related to the mass of the hydrogen envelope left before entering the final cooling track. Early investigations carried out by Webbink (1975) indicated that, as a result of massive hydrogen envelopes, hydrogen burning via the pp cycle remains the main important source of energy over most of the computed evolution, thus implying very long evolutionary time-scales. In agreement with this prediction, Alberts et al. (1996) and Sarna, Antipova & Ergma (1999) found that, on the basis of a detailed treatment of the binary evolution leading to the formation of these objects, the hydrogen-rich envelope surviving flash episodes is massive enough for residual hydrogen burning to be dominant even at low luminosities, thus resulting in very long cooling times. Massive hydrogen envelopes for He WDs have also been derived by Driebe et al. (1998), who have simulated the binary evolution by forcing a 1 M⊙model at the red giant branch to a large mass loss rate. Obviously, very large cooling ages as derived from these evolutionary models constrain the existence of He WDs with very low effective temperature ( ) values. For example, the Driebe et al. model of 0.195 M⊙needs about 17 Gyr to evolve down to = 5000K, which exceeds any age range of interest. The possibility that the hydrogen envelope is considerably reduced by additional mass loss episodes was considered by Iben & Tutukov (1986). These authors found that the last flash episode undergone by their 0.3 M⊙He WD model becomes strong enough so as to force the model to reach again giant dimensions, causing Roche-lobe overflow. They found that the resulting mass transfer reduces the hydrogen envelope to such an extent that it is unable to support any further nuclear burning, thereby implying short cooling ages at late stages of evolution. Finally, Benvenuto & Althaus (1998) and Hansen & Phinney (1998a) presented a detailed grid of He WD models based on the assumption that He WDs are formed with a relatively thin hydrogen envelope and thus hydrogen burning does not appreciably contribute to the luminosity budget of the star.
In the context of the foregoing discussion, binary systems composed by a millisecond pulsar and a low-mass He WD are particularly interesting, as they may place tight constraints on the evolution of He WDs. Indeed, the spin-down age of the pulsar provides an estimation of the age of the He WD companion, which can be compared with the predictions of evolutionary calculations for the WD. In this regard, the best-studied system belonging to this class is PSR J1012+5307, for which Lorimer et al. (1995) determined a spin-down age for the pulsar () of 7 Gyr. In addition, atmospheric parameters of the He WD component have been derived by van Kerkwijk, Bergeron & Kulkarni (1996) and Callanan, Garnavich & Koester (1998) ( 8500K and log g 6.3-6.7). Evolutionary models for He WDs that predict thick hydrogen envelopes (Driebe et al. 1998) lead for this low-mass WD ( 0.15-0.19 M⊙) to an age which is consistent with the spin-down age of the pulsar. However, large evolutionary time-scales as predicted by these models are in disagreement with new observational data. In fact, a recent breakthrough has been the optical detection of the low-mass WD companion to the millisecond pulsar PSR B1855+09 by van Kerkwijk et al. (2000), who derived for the WD companion a value of 4800 800K. The mass of the WD in this binary system is accurately known thanks to the Shapiro delay of the pulsar signal (0.258 M⊙; see Kaspi, Taylor & Ryba 1994). According to the Driebe et al.’ models, this low value corresponds to a WD cooling age of 10 Gyr, which is at odds with the characteristic age of the pulsar, 5 Gyr. In addition, ages well above 10 Gyr are inferred from the models of Driebe et al. (1998) for the very cool WD companions to PSR J0034-0534 and PSR J1713+0747 (Hansen & Phinney 1998b), which may be an indication that such evolutionary models indeed overestimate the WD cooling ages, as discussed by van Kerkwijk et al. (2000). Finally, a recent population study of close double WDs in the Galaxy carried out by Yungelson et al. (2000) suggests that low mass He WDs have to cool much faster than suggested by evolutinary models of Driebe et al. (1998).
Very recently, Althaus, Serenelli & Benvenuto (2000a,b) have presented new evolutionary calculations for He WDs aimed at exploring the role played by element diffusion in the ocurrence of hydrogen shell flashes and, more importantly, to assess whether or not the mass of the hydrogen envelope can be considerably reduced by enhanced hydrogen burning during diffusion-induced, flash episodes. In particular, He WD models in the mass range 0.17-0.41 M⊙were evolved down to very low surface luminosities starting from physically sound initial models generated by abstracting mass from a 1 M⊙model at appropriate stages of its red giant branch evolution. Most importantly, gravitational settling, chemical and thermal diffusion have been considered in these new calculations and model evolution was computed in a self-consistent way with the evolution of element abundances as predicted by diffusion processes. Althaus et al. (2000a) find that element diffusion strongly affects the structure and evolution of He WDs, giving rise to a different cooling history depending on the stellar mass of the models. In particular, diffusion induces the occurrence of hydrogen shell flashes in He WDs with masses ranging from 0.18 to 0.41 M⊙, which is in sharp contrast from the situation when diffusion is neglected. In connection with the further evolution, these diffusion-induced flashes lead to hydrogen envelopes thin enough so as to prevent stable nuclear burning from being an important energy source at advanced cooling stages.111 Since Althaus et al. (2000a,b) did not invoke additional mass transfer when models return to the red giant region as a result of thermonuclear flashes, the surviving hydrogen envelope masses after flash episodes are upper limits. This implies much shorter cooling ages than in the case when diffusion is neglected (Driebe et al. 1998). On the contrary, for masses lower than 0.18 M⊙(as it is the case for the WD companion to PSR J1012+5307), nuclear burning is dominant even in the presence of diffusion and cooling ages resemble those derived from models without diffusion.
The evolutionary calculations mentioned in the preceding paragraph have important implications when attempt is made in comparing theoretical predictions on the WD evolution with expectations from millisecond pulsars, such as those mentioned earlier. As a matter of fact, these evolutionary models predict that as a result of element diffusion, evolution is accelerated to such an extent that the age discrepancy between the PSR B1855+09 components vanishes completely. More specifically, these models lead to an age of 4 2 Gyr for the WD component in good agreement with the spin-down age of the pulsar. As mentioned, there also exists other millisecond pulsars with WD companions for which cooling and spin-down ages appear to be discrepant when the WD age is assessed from evolutionary models in which diffusion is not considered. This is the case for the systems involving PSR J0034-053 and J1713+0747 (Hansen & Phinney 1998b) which most likely have very cool He WD companions. On the contrary, evolutionary calculations including element diffusion give ages in good agreement with the ages of such pulsars (Althaus et al. 2000a). Thus, age discrepancies between the predictions of standard evolutionary models and recent observational data of millisecond pulsar systems appear to be the result of ignoring element diffusion in such evolutionary calculations.
According to the Althaus et al. (2000a) evolutionary calculations, He WDs with stellar masses greater than 0.18 M⊙could reach very low stages well within the age of the universe. In this connection, the WD LSH 3250 is particularly noteworthy. With a surface luminosity of = -4.57 0.04 (Harris et al. 1999), this places it amongst the lowest luminosity known for any WD. It is highly likely that this WD is characterized by a helium core and a very low value (Harris et al. 1999) such that its emergent spectrum would be dominated by collision-induced absorption (CIA) from molecular hydrogen. Such a strong molecular absorption causes cool WDs to become bluer as they age (Hansen 1998; Saumon & Jacobson 1999 and Rohrmann 2000; see also Saumon et al. 1994 in the context of low mass stars). WD evolutionary sequences based on detailed radiative transfer calculations appropriate for very old carbon-oxygen WDs have recently been presented by Hansen (1998, 1999) and Salaris et al. (2000).
If cool low-mass He WDs are actually characterized by short cooling ages, as claimed by Althaus et al., then many of them could present blue colours as a result of strong CIA from molecular hydrogen. In light of these concerns, we judge it to be worthwhile to re-examine the ages of cool He WDs and at the same time to provide colours and magnitudes for these stars in a self-consistent way with the predictions of stellar evolution and element diffusion. This is the main aim of the present work, and to our knowledge such kind of calculations have never been performed. The present calculations improve over those presented in Althaus et al (2000a) in the fact that here appropriate outer boundary conditions for the cooling models are derived on the basis of detailed non-gray model atmospheres (Rohrmann 2000). As far as cool WD ages are concerned, this is a very important point because WD cooling is very sensitive to the treatment of the outer boundary conditions. Another motivation for the present work is the determination of a theoretical luminosity function for He WDs from our new cooling curves. Details about our evolutionary code, initial models and diffusion treatment are briefly described in Section 2. In that section, we also detail the main characteristic of our model atmospheres. Results are presented in Section 3; in particular the evolution of our models in colour-magnitude diagrams is analysed. Finally, Section 4 is devoted to making some concluding remarks.
2 Computational details
As stated in the introduction, one of the aim of this work is to provide a grid of ages, colours and magnitudes for WD cooling models appropriate for the study of old He WDs. This set of models covers an wide range of stellar masses as expected for such objects. In particular, the evolution of models with stellar masses of 0.406, 0.360, 0.327, 0.292, 0.242, 0.196 and 0.169 M⊙has been followed from the end of mass loss episodes during the pre-WD evolution down to very low surface luminosities. WD evolution is computed in a self-consistent way with the expectations from element diffusion, as done in Althaus et al. (2000a,b); but in contrast to the gray-atmosphere approximation assumed in that work, we consider here a detailed treatment of the atmosphere which enable us to obtain accurate outer boundary conditions for our cooling models and colour indices as well.
Attention is focused mainly on the low regime, where WD evolution is markedly dependent on the treatment of the very outer layers. When models reach such stages of evolution, element diffusion have caused the bulk of hydrogen to float and helium and heavier elements to sink from outer layers (see Althaus et al. 2000a for details). This implies almost pure hydrogen atmospheres and justifies our use of atmosphere models for zero metallicity (see below).
In what follows, we briefly comment on the initial models, our atmospheric treatment and the input physics included in our evolutionary code.
2.1 Initial models
Reliable initial models have been obtained by simply abstracting mass from a 1 M⊙ model at appropriate stages of the red giant branch evolution (see also Iben & Tutukov 1986 and Driebe et al. 1998). In this way, we were able to generate initial He WD models with stellar masses of 0.406, 0.360, 0.327, 0.292, 0.242, 0.196 and 0.169 M⊙. It is worth mentioning that the resulting envelopes and hydrogen surface abundance of these initial models are in good agreement with those quoted by Driebe et al (1998). We follow the further evolution of such initial configurations consistently with the predictions of element diffusion. As the stars enter the cooling branch, diffusion processes begin to play an important role. First, they cause hydrogen to float and other elements to sink, giving rise to pure hydrogen outer layers. Simultaneously, chemical diffusion makes some hydrogen move inwards to hotter layers, favouring the occurrence of a thermonuclear flash. Short after the flash begins, the star suddenly increases its radius and developes an outer convection zone which gets deep enough and reaches helium-rich layers, thus modifying the composition of the outer layers. Over a time-scale of the order of a few hundred years the star evolves back to the red giant region and then finally to the cooling branch. At this stage, evolutionary time-scale gets longer and diffusion begins to be important again with the result that the outer layers become made up of only hydrogen. This in sharp contrast with the case in which diffusion is neglected. In that case, apart from convection, no other physical agent is able to drive hydrogen to the surface and therefore the final outer layer chemical composition is fixed by the last episode of convective mixing (made up by hydrogen and helium in comparable proportions). Should the hydrogen envelope left after the flash episode is thick enough, another thermonuclear flash will be triggered by chemical diffusion. This sequence of events will finish once the remaining hydrogen envelope is thin enough for hydrogen burning to be negligible. Thus the amount of hydrogen remaining after hydrogen flashes have ceased results markedly lower when diffusion is allowed to operate. This will produce not only a different cooling history as mentioned in the introduction but also noticeable changes in the structure of the star. In this regard, surfaces gravities result very different if diffusion is considered. For models with 0.18 M⊙for instance, the surface gravity is reduced by almost 80 per cent as a result of element diffusion (see Althaus et al. 2000a for details).
After flash episodes have ceased and when models reach the final cooling branch, we compute the subsequent evolution by considering a detailed treatment of the atmosphere (see below). Here, evolution becomes slow enough for the purity of the outer layers to be established by diffusion processes.222However, we should note that, as a result of the long diffusion time-scales at the base of the outer convection zone, metals accreted from interstellar medium could be mantained in the outer layers of very cool He WDs for a long time (see Althaus & Benvenuto 2000)
2.2 Model Atmosphere
For a proper treatment of the cooling behaviour of He WDs we have calculated the evolution of our He WD models in a self-consistent way with the predictions of detailed non-gray model atmospheres, which are described at length in Rohrmann (2000). Recently, the atmospheric code described in Rohrmann (2000) has been adapted for treating mixtures of hydrogen and helium. Here we restrict ourselves to a few brief comments and we refer the reader to that work for details and comparisons of such models with other relevant atmospheric calculations in the literature.
To begin with, our non-gray model atmospheres are constructed under the assumption of constant gravity, local thermodynamic equilibrium and plane-parallel geometry and include hydrogen and helium species (zero metallicity). Energy transfer by radiation and convection are taken into account and the resulting equations are solved by means of a standard linearization technique. More specifically, the equation of radiative transfer (formulated in terms of the variable Eddington factors, see Auer & Mihalas 1970) and constant flux condition (radiative and convective contributions) are solved by means of an iterative procedure over linearized equations for a set of optical depth points and a frequency mesh. In the interests of minimising computing times, we consider a partial linearization procedure in terms of the temperature alone (Gustafsson 1971 and Gustafsson & Nissen 1972). Only the Planck function and the convective flux are linearized and temperature corrections at each depth point are obtained by means of the Rybicki procedure in which the resulting system of linear equations are ordered not in depth blocks but in frequency blocks (see Gustaffson & Nissen 1972).
Constitutive physics of our model atmospheres is based on an ideal equation of state333Non-ideal effects become important in hydrogen model atmospheres for 2500K; see Saumon & Jacobson (1999). and the following species have been considered: H, H2, e-, H-, H+, H2+, H3+, He, He+ and He++. Although the abundances of species such as H2+ and H3+ are usually negligible, their presence affects significantly the absorption and emission of radiation (see Saumon et al. 1994). Partition functions of H and H2; H2+ and H3+ are from Irwin (1981), Sauval & Tatum (1984) and Neale & Tennyson (1995), respectively. All relevant bound-free, free-free and scattering processes contributing to opacity have been included in our calculations. At low values, CIA by molecular hydrogen due to collisions with H2 and He represents a major source of opacity in the infrared and dominates the shape of the emergent spectrum at low . Here, we have included calculations of H2-H2 and H2-He CIA cross sections by Borysow, Jorgensen & Zheng (1997). Convection is treated within the formalism of the mixing length (ML2 version) and it has been included self-consistently in the equation of energy conservation and in the linearization procedure. It is worth mentioning that for values below 8000K, the temperature profile becomes insensitive to the adopted parametrization of the mixing-length theory (Bergeron, Wesemael & Fontaine 1992). Broadband colour indices have been calculated using the optical and infrared passbands of Bessell (1990) and Bessell & Brett (1988), respectively, with callibration constants from Bergeron, Ruiz & Leggett (1997).
We note that, as reported by Saumon et al. (1994) and Bergeron, Saumon & Wesemael (1995), numerical instabilities resulting from the competition between CIA by H2 and H- opacity develop in the regime from 3500-5000K depending on the surface gravity. Such instabilities were overcome by the procedure suggested by these authors. Finally, starting pressure and temperature values needed to integrate the envelope equations are given at an optical depth of 25. At this point the diffusion approximation for the radiative transfer can be assumed to be valid and the equations of stellar structure in the envelope, at the bottom of which we specify the outer boundary conditions to the evolutive models, can be integrated using Rosseland mean opacities.
2.3 Evolutionary code and diffusion treatment
The evolutionary calculations presented in this work were performed using the evolutionary code described in our previous works on WD evolution (see, e.g, Althaus & Benvenuto 1997, 2000 and Benvenuto & Althaus 1998). Shortly, our code includes a detailed and updated physical description such as OPAL radiative opacities (Iglesias & Rogers 1996) and molecular opacities (Alexander & Ferguson 1994); the equation of state for the low density regime is an updated version of that of Magni & Mazzitelli (1979), whilst for the high density regime we consider ionic contributions, Coulomb interactions, partially degenerate electrons, and electron exchange and Thomas-Fermi contributions at finite temperature. Conductive opacities and the various mechanisms of neutrinos emission are taken from the formulation of Itoh and collaborators. Hydrogen burning is considered via a complete network of thermonuclear reaction rates corresponding to the proton-proton chain and the CNO bi-cycle. The chemical evolution resulting from element diffusion has also been considered. The diffusion calculations are based on the multicomponent treatment of the gas developed by Burgers (1969) and gravitational settling, chemical and thermal diffusion have been taken into account. We mention that the WD evolution is calculated in a self-consistent way with the predictions of element diffusion. In addition, radiative opacities are calculated for metallicities as given by the varying abundances (more details are given in Althaus et al. 2000a and Althaus & Benvenuto 2000).
3 Results
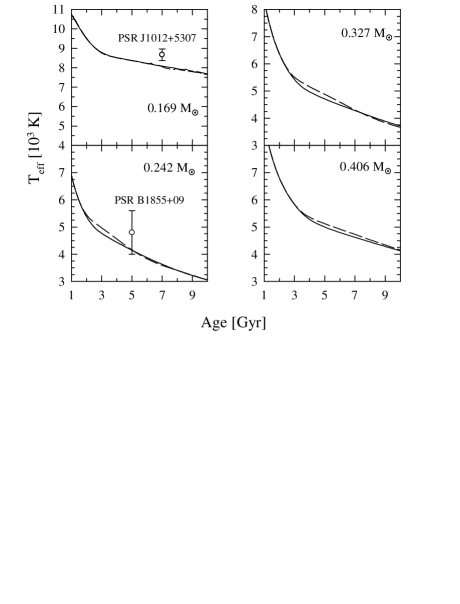
We begin by examining the evolutionary ages for some selected stellar masses. They are illustrated in Fig. 1 in which the versus age relation is depicted together with the observational data for the WD companions to the millisecond pulsars PSR J1012+5307 and B1855+09 (Callanan et al. 1998 and van Kerkwijk et al. 2000, respectively). Only the evolution corresponding to the final cooling branch is depicted in the figure. For stellar masses greater than 0.18 M⊙, models experience diffusion-induced hydrogen flashes and they are left with small hydrogen mass and little nuclear burning with the consequent result that cooling ages become substantially smaller as compared with the situation for less massive models, which do not suffer from flash episodes (see Althaus et al. 2000a). Note the good agreement with the observational predictions for both of the pulsars. In particular, for the PSR B1855+09 companion, models with diffusion predict an age of 4 2 Gyr in good agreement with the pulsar age. It is clear that element diffusion is an important ingredient in the evolution of He WDs that must be taken into account when attempt is made in comparing theoretical predictions with observational data.
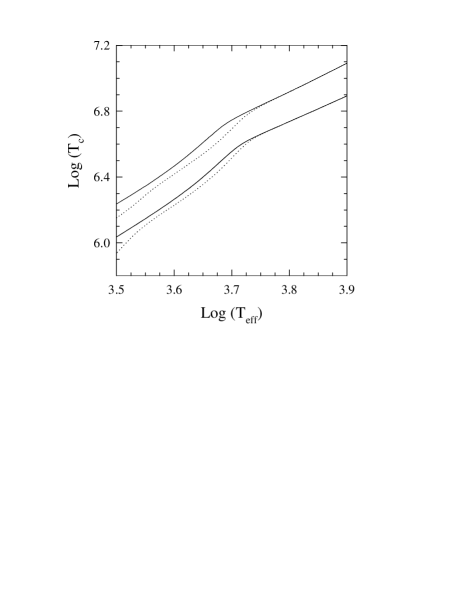
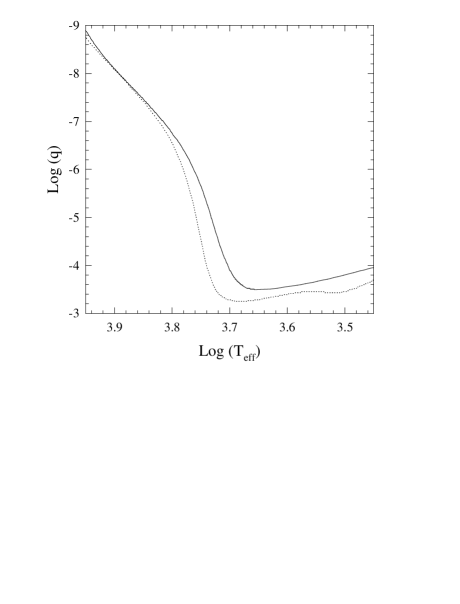
Note that differences in the cooling of He WDs arise from the employment of detailed model atmospheres. Specifically, the inclusion of proper outer boundary conditions may decrease the cooling ages up to 1 Gyr in the range 4000K 5500K. At such stages of evolution, the central temperature becomes strongly tied to the temperature stratification of the outer layers. In fact, when convection reaches the domain of degeneracy, the central temperature drops substantially and the star has initially an excess of internal energy to be radiated, thus giving rise to a lengthening of the evolutionary times during that epoch of evolution, as it is borne out by the change of slope in the cooling curves shown in Fig. 1. At advanced stages of evolution, the thermal stratification of the envelope is affected by the use of non-gray atmospheres in such a way that the location of the maximum depth reached by the base of the outer convection zone is markedly shallower as compared with the prediction of the standard gray treatment for the atmosphere (see also Bergeron et al. 1997). This can be appreciated in Fig. 2 in which we show the evolution of the base of the outer convection zone in terms of for the 0.242 M⊙model. Clearly, when is decreased below 7000K, the non-gray treatment predicts a shallower outer convection zone (this behaviour is essentially the same irrespective of the stellar mass of the model). As a result, convection reaches the degenerate core at lower values in such models and accordingly the drop in the central temperature takes place later than for the gray models, as shown in Fig. 3. This behaviour explains the trend of the cooling curves in both set of calculations.
Another interesting issue of our evolutionary calculations also related to the extent of the outer convection zone is the following. As noted by Althaus et al. (2000a), the hydrogen envelope left after diffusion-induced flash episodes may be thin enough that convection is able to mix it with the underlying helium layers at advanced stages of evolution. In fact, these authors find that over a time interval of 2 Gyr, models with masses of 0.2 M⊙are characterized by outer layers made up by hydrogen and helium by the time they have cooled down to 5000K. As mentioned (see Fig. 2) , the use of detailed model atmospheres to derive outer boundary conditions for evolving WDs gives rise to shallower outer convection zones as compared with the gray treatment considered in Althaus et al. (2000a). As a result, no mixing episodes occur at all and the envelope of our He WD models remains as pure hydrogen down to the end of the cooling sequence.
From the cooling curves, we can estimate the predicted number density of He WDs as a function of luminosity. To this end we have translated the cooling curves for our set of models into a total luminosity function according to the relation given by
| (1) |
with
| (2) |
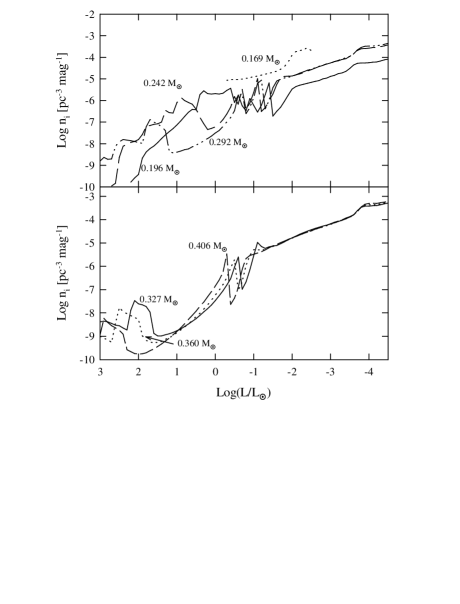
Here, is the birthrate of He WDs of a given stellar mass, the summation of which is normalized to the birthrate at which He WDs are produced (0.14 ; see Iben, Tutukov & Yungelson 1997). is the number density of He WDs (single luminosity function) of a given mass in the magnitude interval M to M, is the time interval the model requires to evolve from M to M magnitude and is the volume of the Galactic disk (). On the basis of these assumptions, the resulting single luminosity functions for our models are displayed in Fig. 4. A striking feature shown by this figure are the spikes at intermediate luminosities, which correspond to the evolutionary phases prior to the onset of flash episodes where evolution slows down. At high luminosities, each He WD theoretical distribution exhibits a bump. These bumps are a consequence of the slow rate of evolution before the models enter their cooling branch. To understand the behaviour of at high luminosities, it should be kept in mind that as a result of thermonuclear flashes, models reach the high surface luminosity phase more than once. Less massive models experiences many flash episodes, thus their resulting luminosity functions show more extended bumps.
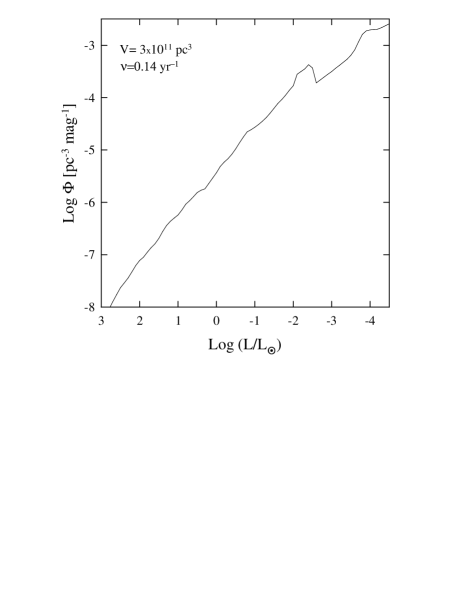
The total luminosity function, , results from the superposition of the single number density of He WDs and it is illustrated by Fig.5. Note that over most of the given surface luminosity range, the total luminosity function exhibits a rather monotonously increasing trend down to - 2.5. Little of the behaviour of the individual luminosity function remains. This is expected because flash episodes occur at different surface luminosities depending on the stellar mass with the result that spikes cancel amongst them out. At - 2.5, the luminosity function shows a local maximum as a result of the contribution of models which do not experience hydrogen shell flashes. Indeed, as mentioned earlier, such models are characterized by stable nuclear burning even at low values, with the consequent result that their evolution is considerably slowed down. More specifically, at such a luminosity, the 0.169 M⊙model is characterized by an age of 14 Gyr; so it is expected not to contribute to the number density of He WDs at lower luminosities within the age of the universe. At - 4, the luminosity function shows a small bump. As explained earlier, when convection reaches the degenerate core, there is initially an excess of energy to get rid of and the cooling process is slowed down, thus leading to the small bump in the luminosity function at low stellar luminosities. Finally, we should note that we have considered single He WDs, that is we have neglected possible merger of those He WDs formed in binary systems with small separation for gravitational wave radiation to lead to a merger of the components on time scales shorter than the Hubble time. Accordingly, care should be taken at comparing our theoretical luminosity functions at low luminosities with observations.
| (Gyr) | B-V | V-R | V-K | R-I | J-H | H-K | BC | MV | |||
|---|---|---|---|---|---|---|---|---|---|---|---|
| 0.169 | 10000 | 6.0621 | 1.56 | -0.01 | 0.04 | 0.03 | 0.06 | 0.02 | -0.06 | -0.34 | 8.70 |
| ” | 9500 | 6.1624 | 1.99 | 0.04 | 0.07 | 0.15 | 0.08 | 0.04 | -0.06 | -0.29 | 9.11 |
| ” | 9000 | 6.2555 | 2.60 | 0.10 | 0.11 | 0.30 | 0.11 | 0.07 | -0.05 | -0.25 | 9.55 |
| ” | 8500 | 6.3499 | 4.11 | 0.16 | 0.14 | 0.46 | 0.14 | 0.10 | -0.04 | -0.23 | 10.01 |
| ” | 8000 | 6.4256 | 7.63 | 0.22 | 0.18 | 0.64 | 0.18 | 0.14 | -0.02 | -0.21 | 10.44 |
| ” | 7500 | 6.4796 | 11.45 | 0.28 | 0.22 | 0.82 | 0.22 | 0.18 | -0.01 | -0.19 | 10.84 |
| ” | 7050 | 6.5265 | 16.52 | 0.34 | 0.25 | 1.00 | 0.25 | 0.21 | 0.00 | -0.17 | 11.21 |
| 0.242 | 10000 | 6.9458 | 0.32 | 0.03 | 0.07 | 0.08 | 0.07 | 0.03 | -0.06 | -0.37 | 10.54 |
| ” | 9500 | 6.9616 | 0.37 | 0.08 | 0.09 | 0.20 | 0.09 | 0.05 | -0.05 | -0.32 | 10.76 |
| ” | 9000 | 6.9780 | 0.44 | 0.13 | 0.12 | 0.34 | 0.12 | 0.08 | -0.04 | -0.28 | 11.00 |
| ” | 8500 | 6.9945 | 0.53 | 0.18 | 0.15 | 0.49 | 0.15 | 0.11 | -0.03 | -0.25 | 11.26 |
| ” | 8000 | 7.0119 | 0.64 | 0.23 | 0.19 | 0.65 | 0.18 | 0.14 | -0.02 | -0.22 | 11.53 |
| ” | 7500 | 7.0291 | 0.78 | 0.29 | 0.22 | 0.83 | 0.22 | 0.18 | -0.01 | -0.20 | 11.83 |
| ” | 7000 | 7.0464 | 0.96 | 0.35 | 0.26 | 1.02 | 0.26 | 0.22 | 0.01 | -0.18 | 12.15 |
| ” | 6500 | 7.0637 | 1.19 | 0.43 | 0.30 | 1.23 | 0.30 | 0.26 | 0.03 | -0.16 | 12.50 |
| ” | 6000 | 7.0818 | 1.48 | 0.52 | 0.35 | 1.48 | 0.36 | 0.30 | 0.06 | -0.17 | 12.90 |
| ” | 5500 | 7.1044 | 1.88 | 0.64 | 0.42 | 1.76 | 0.42 | 0.34 | 0.09 | -0.21 | 13.38 |
| ” | 5000 | 7.1423 | 2.50 | 0.77 | 0.50 | 2.11 | 0.50 | 0.39 | 0.13 | -0.31 | 13.99 |
| ” | 4500 | 7.1779 | 3.80 | 0.91 | 0.59 | 2.36 | 0.59 | 0.38 | 0.09 | -0.45 | 14.68 |
| ” | 4000 | 7.1974 | 5.54 | 1.04 | 0.67 | 2.15 | 0.67 | 0.10 | -0.01 | -0.51 | 15.29 |
| ” | 3500 | 7.2082 | 7.57 | 1.15 | 0.73 | 1.42 | 0.70 | -0.18 | -0.19 | -0.37 | 15.76 |
| ” | 3000 | 7.2149 | 10.38 | 1.25 | 0.74 | 0.39 | 0.56 | -0.30 | -0.32 | -0.07 | 16.14 |
| ” | 2500 | 7.2207 | 15.20 | 1.36 | 0.65 | -0.79 | 0.00 | -0.21 | -0.48 | 0.34 | 16.54 |
| 0.327 | 10000 | 7.3138 | 0.57 | 0.05 | 0.07 | 0.10 | 0.07 | 0.03 | -0.06 | -0.38 | 11.15 |
| ” | 9500 | 7.3240 | 0.68 | 0.09 | 0.10 | 0.22 | 0.09 | 0.05 | -0.05 | -0.34 | 11.35 |
| ” | 9000 | 7.3339 | 0.80 | 0.14 | 0.13 | 0.36 | 0.12 | 0.08 | -0.04 | -0.30 | 11.57 |
| ” | 8500 | 7.3433 | 0.94 | 0.19 | 0.16 | 0.50 | 0.15 | 0.11 | -0.03 | -0.26 | 11.81 |
| ” | 8000 | 7.3524 | 1.12 | 0.24 | 0.19 | 0.66 | 0.18 | 0.14 | -0.02 | -0.23 | 12.07 |
| ” | 7500 | 7.3613 | 1.33 | 0.29 | 0.22 | 0.83 | 0.22 | 0.18 | -0.01 | -0.20 | 12.34 |
| ” | 7000 | 7.3702 | 1.58 | 0.36 | 0.26 | 1.02 | 0.26 | 0.22 | 0.01 | -0.18 | 12.63 |
| ” | 6500 | 7.3794 | 1.90 | 0.43 | 0.30 | 1.23 | 0.30 | 0.26 | 0.03 | -0.16 | 12.96 |
| ” | 6000 | 7.3899 | 2.31 | 0.53 | 0.36 | 1.47 | 0.36 | 0.29 | 0.06 | -0.16 | 13.34 |
| ” | 5500 | 7.4041 | 2.89 | 0.65 | 0.42 | 1.76 | 0.43 | 0.33 | 0.10 | -0.21 | 13.80 |
| ” | 5000 | 7.4258 | 3.91 | 0.77 | 0.50 | 2.10 | 0.50 | 0.39 | 0.12 | -0.31 | 14.37 |
| ” | 4500 | 7.4451 | 5.95 | 0.91 | 0.59 | 2.30 | 0.59 | 0.35 | 0.07 | -0.44 | 15.00 |
| ” | 4000 | 7.4559 | 8.41 | 1.03 | 0.67 | 2.02 | 0.66 | 0.04 | -0.03 | -0.47 | 15.57 |
| ” | 3500 | 7.4622 | 11.39 | 1.13 | 0.72 | 1.27 | 0.68 | -0.21 | -0.20 | -0.32 | 16.02 |
| ” | 3000 | 7.4665 | 15.67 | 1.23 | 0.72 | 0.26 | 0.51 | -0.30 | -0.32 | -0.01 | 16.39 |
| ” | 2500 | 7.4701 | 23.95 | 1.33 | 0.61 | -0.96 | -0.10 | -0.20 | -0.51 | 0.39 | 16.79 |
| 0.406 | 10000 | 7.5664 | 0.71 | 0.06 | 0.08 | 0.12 | 0.07 | 0.03 | -0.06 | -0.39 | 11.55 |
| ” | 9500 | 7.5722 | 0.82 | 0.10 | 0.11 | 0.24 | 0.10 | 0.05 | -0.05 | -0.35 | 11.75 |
| ” | 9000 | 7.5783 | 0.95 | 0.14 | 0.13 | 0.37 | 0.12 | 0.08 | -0.04 | -0.31 | 11.96 |
| ” | 8500 | 7.5838 | 1.11 | 0.19 | 0.16 | 0.51 | 0.15 | 0.11 | -0.03 | -0.27 | 12.18 |
| ” | 8000 | 7.5897 | 1.30 | 0.24 | 0.19 | 0.67 | 0.18 | 0.14 | -0.02 | -0.24 | 12.43 |
| ” | 7500 | 7.5952 | 1.55 | 0.29 | 0.22 | 0.84 | 0.22 | 0.18 | -0.01 | -0.21 | 12.69 |
| ” | 7000 | 7.6010 | 1.85 | 0.36 | 0.26 | 1.02 | 0.26 | 0.22 | 0.01 | -0.18 | 12.98 |
| ” | 6500 | 7.6072 | 2.25 | 0.44 | 0.30 | 1.23 | 0.30 | 0.25 | 0.03 | -0.16 | 13.29 |
| ” | 6000 | 7.6139 | 2.77 | 0.53 | 0.36 | 1.47 | 0.36 | 0.29 | 0.06 | -0.16 | 13.66 |
| ” | 5500 | 7.6238 | 3.52 | 0.65 | 0.42 | 1.75 | 0.42 | 0.33 | 0.10 | -0.21 | 14.11 |
| ” | 5000 | 7.6374 | 5.00 | 0.77 | 0.50 | 2.09 | 0.50 | 0.38 | 0.12 | -0.31 | 14.66 |
| ” | 4500 | 7.6482 | 7.71 | 0.91 | 0.59 | 2.25 | 0.59 | 0.33 | 0.06 | -0.43 | 15.27 |
| ” | 4000 | 7.6543 | 10.83 | 1.02 | 0.66 | 1.92 | 0.66 | 0.01 | -0.06 | -0.44 | 15.80 |
| ” | 3500 | 7.6580 | 14.68 | 1.12 | 0.71 | 1.15 | 0.67 | -0.22 | -0.22 | -0.28 | 16.23 |
| ” | 3000 | 7.6607 | 20.37 | 1.21 | 0.71 | 0.16 | 0.47 | -0.30 | -0.33 | 0.02 | 16.60 |
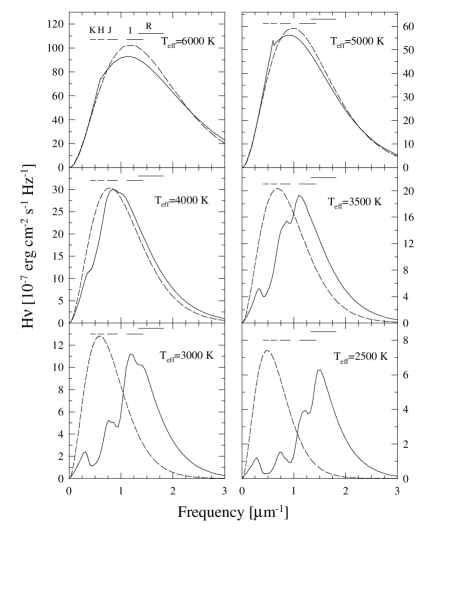
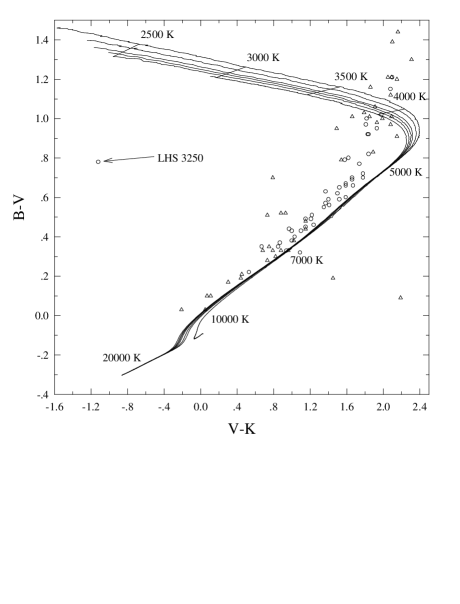
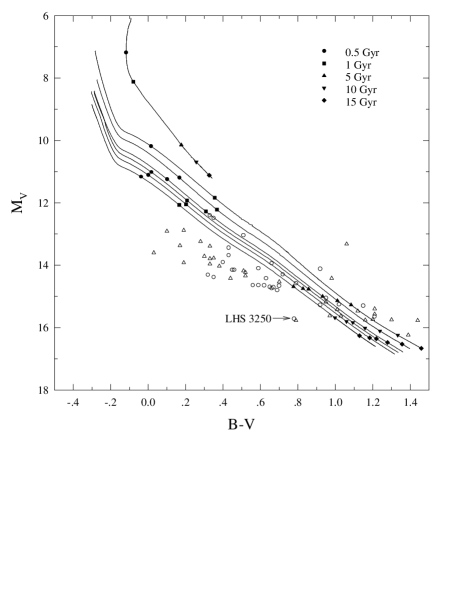
The evolution of the emergent flux distribution for the 0.292 M⊙ He WD model at some selected values can be seen in Fig. 6. The results of the non-gray atmosphere (solid lines) are compared with the blackbody predictions (dashed lines) at the same value. We want to stress again that by the time models have reached the range considered in Fig.6, element diffusion have caused heavier elements than hydrogen to sink below the outer layers. So, our evolving He WD models at such advanced stages of evolution are characterized by pure hydrogen outer layers. At high temperatures, the opacity is dominant. Since this opacity is almost independent of frequency, the emergent flux resembles that of the blackbody spectrum. The main observation we can make from this figure is that when is lowered below 4000K, the emergent spectrum becomes bluer. This effect, reported also by Saumon et al. (1994) and more recently by Saumon & Jacobson (1999), Hansen (1998,1999), Rohrmann (2000) and Salaris et al. (2000) (particularly in the context of carbon-oxygen WDs), is due to the strong CIA opacity by molecular hydrogen that reduces the infrared flux and force radiation to emerge at larger frequencies. As a result, cool low-mass He WDs become bluer as they age. Needless to say, this effect also affects the colour-colour and colour-magnitude diagrams. Indeed, most colour indices show a pronounced turn-off at low values and they become bluer after reaching a maximum. This is nicely illustrated by Fig. 7 in which the (, ) two-colour diagram is shown for all of our He WD models together with the observational data for DA and non-DA WDs according to Bergeron, Leggett & Ruiz (2000). The peculiar WD LHS 3250 analysed by Harris et al. (1999) is also included in the figure. Note also that for below 5000K, colours become markedly bluer in this diagram.
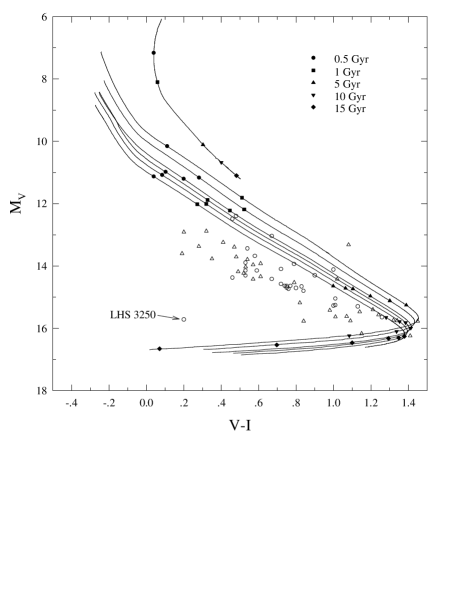
Now we analyse the evolution of our He WD models in the colour-magnitude diagram. In particular we show in Figs. 8 and 9 the behaviour of the absolute visual magnitude for our models as a function of the color indices and , respectively. The observational sample for cool DA (open circles) and non-DA (open triangles) WDs of Bergeron et al. (2000) are also included in the figure as well as the location of the WD LHS 3250 according to Harris et al. (1999). For the 0.169 M⊙model, only the phase of low values is depicted because such a model would require exceedingly high ages to evolve to lower luminosities. By contrast, more massive models can reach high magnitudes within a Hubble time. Indeed, as can be seen from the figure, He WD models in the mass range from 0.18 to 0.3 M⊙ can reach the turn-off point and become blue again within cooling times less than 15 Gyr. Specifically, such models have cooling ages of 6 - 9 Gyr at the turn-off, which occurs at 16. Note that with further evolution, they remain brighter than 16.5. The results presented here raise the possibility that many low-mass He WDs could have had time enough to evolve beyond the turn-off point and present blue colours. The cool WD LHS 3250 analysed by Harris et al. (1999) could be an example of such WDs. More massive He WDs present a similar trend in their colour-magnitude evolution but the ages involved are considerably larger. For instance, the 0.406 M⊙model needs about 13 Gyr to reach the turn-off in the colour index. We would like to stress again the fact that the short cooling ages characterizing such models are due to the role played by element diffusion during the evolutionary phases prior to those computed here. In fact, element diffusion leads to hydrogen shell flashes during which the mass of the hydrogen envelope is reduced to such an extent that nuclear burning becomes negligible on the final cooling track, thus implying much shorter cooling ages from the situation when diffusion is neglected (such as in Driebe et al. 1998). The colour-magnitude diagram for the colour index is shown in Fig. 9. Note that the colour index does not show a turn-off at low . We should mention that for values above 8000K, our predictions for the show discrepancies with those of Bergeron et al. (1995) because in our calculations we have not considered the effects of line broadening opacities.
Finally, we list in Table 1 the colour indices for our 0.169, 0.242, 0.327 and 0.406 M⊙He WD models at some selected low values. In addition, for each stellar mass and value, we provide the surface gravity (), the age (in Gyr), the absolute visual magnitude () and the bolometric correction (). The latter is calculated according to (see Bergeron, Wesemael & Beauchamp 1995)
| (3) |
where and are the monocromatic emergent flux at temperature and the transmission function of the filter, respectively.
4 Conclusions
The present study was aimed at exploring the evolution of white dwarf (WD) stars with helium cores (He WD) on the basis of very detailed non-gray model atmospheres (Rohrmann 2000) to derive accurate boundary conditions for the evolving models. The emphasis has been placed on the advanced stages of the evolution of these objects where WD evolution is markedly dependent on the treatment of the atmosphere. The evolutionary phases leading to the formation of cool He WDs have been explored in detail by Althaus et al. (2000a), who found that the inclusion of element diffusion in evolutionary calculations for He WDs leads to hydrogen envelopes thin enough for stable nuclear burning to play a minor role at late stages of evolution. Here we improved the above-mentioned calculations by following the evolution of He WD models in a self-consistent way with the predictions of non-gray model atmospheres. Another motivation for the present work has been to construct a theoretical luminosity function for He WDs and to provide colour indices and magnitudes for these WDs self-consistently with stellar evolution and element diffusion.
In particular, we have considered He WD models with stellar masses of 0.406, 0.360, 0.327, 0.292, 0.242, 0.196 and 0.169 M⊙, the evolution of which has been followed from the end of mass loss episodes during the pre-WD evolution down to very low surface luminosities.
We find that when decreases below 4000K, the emergent spectrum of He WDs becomes bluer and not redder, as reported by other investigators. We also analyse the evolution of our He WD models in the colour-magnitude diagrams and we find that He WDs with masses ranging from 0.18 to 0.3 M⊙ can reach the turn-off in their colours and become blue again within cooling times much less than 15 Gyr and then remain brighter than 16.5. This is an interesting result because it raises the possibility that many low-mass He WDs could have had time enough to evolve beyond the turn-off point and present blue colours. Cooling times this short have also been derived by Althaus et al (2000a,b) on the basis of detailed evolutionary models that consider the pre-WD evolution and the effects of element diffusion. As shown by these authors, these new models solve the discrepancy between the predictions of standard evolutionary calculations (which do not consider element diffusion, such as Driebe et al. 1998) for He WDs and the age of some millisecond pulsar companions. The detection of blue, low-mass He WDs at very low would place the theoretical predictions of our models on a firm observational basis.
Complete tables containing the results of the present calculations are available at http://www.fcaglp.unlp.edu.ar/althaus/ or upon request to the authors at their e-mail addresses.
We thank our anonymous referee whose comments and suggestions greatly improved the original version of this paper.
References
- [1] Alberts F., Savonije G. J., van den Heuvel E. P. J., Pols O. R., 1996, Nature, 380, 676
- [2] Alexander D. R., Ferguson J. W., 1994, ApJ, 437, 879
- [3] Althaus L. G., Benvenuto O. G., 1997, ApJ, 477, 313
- [4] Althaus L. G., Benvenuto O. G., 2000, MNRAS, 317, 952
- [5] Althaus L. G., Serenelli A. M., Benvenuto O. G., 2000a, MNRAS, to be published (astro-ph/0012545)
- [6] Althaus L. G., Serenelli A. M., Benvenuto O. G., 2000b, ApJ, accepted for publication
- [7] Auer L. H., Mihalas D., 1970, MNRAS, 149, 65
- [8] Benvenuto O. G., Althaus L. G., 1998, MNRAS, 293, 177
- [9] Bergeron P., Leggett S. K., Ruiz M. T., 2000, ApJ to be published
- [10] Bergeron P., Ruiz M. T., Leggett S. K., 1997, ApJS, 108, 339
- [11] Bergeron P., Saffer R. A., Liebert J., 1992, ApJ, 394, 228
- [12] Bergeron P., Saumon D., Wesemael F., 1995, ApJ, 443, 764
- [13] Bergeron P., Wesemael F., Beauchamp A., 1995, PASP, 107, 1047
- [14] Bergeron P., Wesemael F., Fontaine G., 1992, ApJ, 387, 288
- [15] Bessell M. S., 1990, PASP, 102, 1181
- [16] Bessell M. S., Brett J. M., 1988, PASP, 100, 1134
- [17] Borysow A., Jorgensen U. G., Zheng C., 1997, A&A, 324, 185
- [18] Bragaglia A., Renzini A., Bergeron P., 1995, ApJ, 443, 735
- [19] Burgers J.M., 1969, Flow Equations for Composite Gases (New York: Academic)
- [20] Callanan P. J., Garnavich P. M., Koester D., 1998, MNRAS, 298, 211
- [21] Cool A. M., Grindlay J. E., Cohn H. N., Lugger P. M., Bailyn C. D., 1998, ApJ, 508, L75
- [22] Driebe T., Schönberner D., Blöcker T., Herwig F., 1998, A&A, 339, 123
- [23] Edmonds P. D., Grindlay J. E, Cool A. M., Cohn H. N., Lugger P. M., Bailyn C. D., 1999, ApJ, 516, 250
- [24] Gustaffson B., 1971, A&A, 10, 187
- [25] Gustaffson B., Nissen P. E., 1972, A&A, 19, 261
- [26] Hansen B. M. S., 1998, Nature, 394, 860
- [27] Hansen B. M. S., 1999, ApJ, 520, 680
- [28] Hansen B. M. S., Phinney E. S. 1998a, MNRAS, 294, 557
- [29] Hansen B. M. S., Phinney E. S. 1998b, MNRAS, 294, 569
- [30] Harris H. C., Dahn C. C., Vrba F. J., Henden A. A., Liebert J., Schmidt G. D., Reid I. N., 1999, ApJ, 524, 1000
- [31] Iben I. Jr., Livio M., 1993, PASP, 105, 1373
- [32] Iben I. Jr., Tutukov A. V., 1986, ApJ, 311, 742
- [33] Iben I. Jr., Tutukov A. V., Yungelson L., 1997, ApJ, 475, 291
- [34] Iglesias C. A., Rogers F. J., 1996, ApJ, 464, 943
- [35] Irwin A. W., 1981, ApJS, 45, 261
- [36] Kaspi V. M., Taylor J. H., Ryba M. F., 1994, ApJ, 428, 713
- [37] Landsman W., Aparicio J., Bergeron P., Di Stefano R., Stecher T.P., 1997, ApJ, 1997, 481, L93
- [38] Lorimer D. R., Festin L., Lyne A. G., Nicastro L., 1995, Nature, 376, 393
- [39] Lundgren S. C., Cordes J. M., Foster R. S., Wolszczan A., Camilo F., 1996, ApJ, 458, L33
- [40] Magni G., Mazzitelli I., 1979, A&A, 72, 134
- [41] Marsh T. R., 1995, MNRAS, 275, L1
- [42] Marsh T. R., Dhillon V. S., Duck S. R., 1995, MNRAS, 275, 828
- [43] Maxted P. F. L., Marsh T. R., Moran C. H. J., Zan Z., 2000, MNRAS, 314, 334
- [44] Moran C., Marsh T. R., Bragaglia A., 1997, MNRAS, 288, 538
- [45] Neale L., Tennyson J., 1995, ApJ, 454, L169
- [46] Orosz J. A., Wade R. A., Harlow J. J. B., Thorstensen J. R., Taylor C. J., Eracleous M., 1999, AJ, 117, 1598
- [47] Rohrmann R. D. 2000, MNRAS, to be published (astro-ph/0102182)
- [48] Saffer R. A., Livio M., Yungelson L. R., 1998, ApJ, 504, 392
- [49] Salaris M., García-Berro E., Hernanz M., Isern J., Saumon D., 2000 ApJ, to be published
- [50] Sarna M. J., Antipova J., Ergma E., 1999, 11th. European Workshop on White Dwarfs (Solheim J.-E., Meistas E. G., Eds.) ASP Conference Series, 169, 400
- [51] Saumon D., Jacobson S. B., 1999, ApJ, 511, L107
- [52] Saumon D., Bergeron P., Lunine J. I, Hubbard W. B., Burrows A., 1994, ApJ, 424, 333
- [53] Sauval A. J., Tatum J. B., 1984, ApJS, 56, 193
- [54] van Kerkwijk M. H., Bergeron P, Kulkarni S. R., 1996, ApJ, 467, L89
- [55] van Kerkwijk M. H., Bell J. F., Kaspi V. M., Kulkarni S. R., 2000, ApJ, 530, L37
- [56] Yungelson L. R., Nelemans G., Portegies Zwart S. F., Verbunt F., Proceedings of the The influence of binaries in stellar populations, Brussels, 2000, (D. Vanbeveren Ed.), to be published (astro-ph/0011248)
- [57] Webbink R. F., 1975, MNRAS, 171, 555