The Chandra Deep Survey of the Hubble Deep Field North Area. IV. An Ultradeep Image of the HDF-N
Abstract
We present results from a 479.7 ks Chandra exposure of the Hubble Deep Field North (HDF-N) and its immediate vicinity. In this X-ray image, the deepest ever reported with a 0.5–2.0 keV flux limit of erg cm-2 s-1, four new HDF-N X-ray sources are detected bringing the total number of such sources to 12. The new sources include two optically bright ( 18.3–18.8), low-redshift () galaxies, a Fanaroff-Riley I radio galaxy, and an edge-on spiral hosting either a powerful starburst and/or a low-luminosity active galactic nucleus (AGN). Notably, X-ray emission has now been detected from all luminous galaxies () with known in the HDF-N. We have also detected the remarkable Jy radio source VLA J123642.09+621331.4, which is located just outside the HDF-N and has a likely redshift of . The observed X-ray emission supports the presence of an AGN in this object, and its X-ray-to-optical flux ratio (i.e., ) is consistent with what is seen for low-redshift AGN.
We have detected X-ray variability from two of the previously known HDF-N X-ray sources, and spectral fitting shows clear evidence for X-ray absorption in the brightest X-ray source in the HDF-N, a broad-line AGN with associated Mg ii absorption. Stacking analyses of optically bright HDF-N galaxies not individually detected in X-rays have provided estimates of their average X-ray fluxes, and we find that the X-ray luminosities of “normal” spirals at are not more than a factor of larger (per unit -band luminosity) than those of spirals in the local Universe (). This constrains models for the evolution of low-mass X-ray binary populations in galaxies in response to the declining cosmic star-formation rate. Monte-Carlo simulations support the validity of the stacking analyses and show that the Chandra Advanced CCD Imaging Spectrometer (ACIS) performs source detection well even with effective exposure times of Ms.
1 Introduction
We are in the process of performing a deep X-ray survey ( Ms) of the Hubble Deep Field North (HDF-N; Williams et al. 1996, hereafter W96; Ferguson, Dickinson, & Williams 2000) and its environs with the Chandra X-ray Observatory (hereafter Chandra; Weisskopf et al. 2000). This field was chosen because of the excellent radio, submillimeter, infrared, and optical studies already completed (see Livio, Fall, & Madau 1998 and Ferguson et al. 2000 for reviews). The HDF-N itself is the most intensively studied extragalactic patch of sky, and it is one of only two such regions (the other being the Hubble Deep Field South) with high-resolution imaging down to 28–29th magnitude in several optical bands. By centering our survey on the HDF-N, we ensure that the best possible data will be available for follow-up of the faintest X-ray sources ever detected.
In Hornschemeier et al. (2000, hereafter H00), we presented the first results for the HDF-N based on 164.4 ks of Chandra exposure. These results were extended to 221.9 ks over an area much larger than the HDF-N in Hornschemeier et al. (2001, hereafter H01) and G.P. Garmire et al., in preparation (hereafter G01); eight sources in the HDF-N itself were reported. The total exposure on the HDF-N field has recently been more than doubled to 479.7 ks; these new data have allowed the detection of several additional HDF-N sources and substantially improved the X-ray constraints on the previously detected sources. Here we present the additional sources as well as improved constraints on sources in the HDF-N itself and on one source in its immediate vicinity. We also use stacking analyses to probe the average X-ray emission properties of HDF-N galaxies that are not individually detected in the X-ray band.
The Galactic column density along this line of sight is cm-2 (Stark et al. 1992). km s-1 Mpc-1 and are adopted throughout this paper. Coordinates throughout this paper are J2000.
2 Chandra ACIS Observations and Analysis
2.1 Observation Details and Image Creation
The field containing the HDF-N was observed with the Chandra Advanced CCD Imaging Spectrometer (ACIS; G.P. Garmire et al., in preparation) for a total exposure time of 257.9 ks on 2000 November 21–23 (167.0 ks; observation ID 1671) and 2000 November 24–25 (90.9 ks; observation ID 2344). The background was stable during the first observation, but there was significant background flaring due to “space weather” during ks of the second observation. During this ks the background was times higher, but this has had little impact on the analysis or results presented here. The HDF-N was placed near the aim point for the ACIS-I array on CCD I3 during both observations. These data were added to the 221.9 ks of data presented in H01; the entire HDF-N was covered for all observations and was kept away from gaps between the CCDs.
Several improvements over the data reduction techniques of H01 have been made. The most recently processed data from the Chandra X-ray Center were used, and the standard pixel randomization was removed.111See http://asc.harvard.edu/cal/Hrma/hrma/misc/oac/dd_psf/dd_randomiz.html. Chandra Interactive Analysis of Observations (CIAO) Version 2.0 tools were used whenever possible in place of some of the custom software used for H01.222See http://asc.harvard.edu/ciao/. All data were corrected for the radiation damage sustained by the CCDs during the first few months of Chandra operations using the procedure of Townsley et al. (2000). This procedure partially corrects for the positionally dependent grade distribution due to inefficient charge transfer in the radiation-damaged CCDs. It also partially corrects for quantum efficiency losses, which are most significant in non-corrected data at C (see Townsley et al. 2000 and H01 for discussion of the remaining small quantum efficiency losses incurred). The absolute astrometry was determined following the method in §3.1 of H01; absolute X-ray source positions in the HDF-N itself are accurate to or better.
We created images from 0.5–8.0 keV (full band), 0.5–2.0 keV (soft band), 2–8 keV (hard band) and 4–8 keV (ultrahard band) using the two event grade sets defined in Table 1; hereafter these will be called the “standard ASCA grade set” and the “restricted ACIS grade set.” The use of the restricted ACIS grade set improves our ability to detect faint sources in some cases, as discussed in Brandt et al. (2000) and T. Miyaji et al., in preparation. The basic reason for this improvement is that the restricted ACIS grade set rejects a significantly higher fraction of background events than source events (after correction for the radiation damage). With the restricted ACIS grade set, the average soft-band and hard-band background levels are reduced by 36% and 28% relative to the levels with the standard ASCA grade set (see Table 1). For comparison, the bright source CXOHDFN J123646.3+621404 (see below) loses 12% of its soft-band counts and 14% of its hard-band counts when the restricted ACIS grade set is used instead of the standard ASCA grade set.
2.2 Source Detection and Detection Limits
Source detection was performed with wavdetect (Freeman et al. 2001). Our criterion for source detection is that a source must be found with a false-positive probability threshold of in at least one of the four bands using either the standard ASCA or restricted ACIS grade sets. The 12 sources found in this manner are listed in Table 2. All photometry in Table 2 is for the standard ASCA grade set. In Table 2 we also report results for one Chandra source located just outside the HDF-N, CXOHDFN J123642.0+621331. Figure 1 shows the detected sources in the full, soft and hard bands (the ultrahard-band image is not shown since only two sources are detected). Some of the sources outside the HDF-N that are not labeled in Figure 1 are discussed in H01, while others will be discussed in a future publication. Conservatively treating the eight images searched as entirely independent, false sources are expected statistically. All sources have been manually inspected to be certain that they are not produced or affected by “cosmic ray afterglows” (Chandra X-ray Center 2000, private communication). Finally, images made with other grade set choices (e.g., only ACIS grade 0 events) were searched; no additional sources were detected.
wavdetect was also run in the various bands to search for lower-significance counterparts (matching to within ) of the highly significant sources already detected at the level in at least one of the four bands; in these runs we used probability thresholds of and . Since the spatial-matching requirement greatly reduces the number of pixels being searched, the statistically expected number of false cross-band matches obtained in this manner is very small. The only two cases where new cross-band matches were found with probability thresholds of or are noted in Table 2.
The nature of the multiwavelength counterparts to our new X-ray sources supports the validity of the X-ray detections (see §3.1 for details on the multiwavelength counterparts). For example, four of the five new X-ray sources align with radio sources (see Table 3), extending the trend established for this field at brighter X-ray fluxes (H00; H01). Given the precise X-ray and radio positions, the a priori probability of such an alignment is small (). Similarly, the probability of alignment with optically bright, low-redshift galaxies is small (compare with §4.1 of H01). The one new X-ray source in §3.1 that is not a radio source aligns with an optically bright galaxy.
The “effective exposure time” per source, as derived from our exposure map, ranges from 444–464 ks (see H01 for discussion). Even with these long exposure times, the Chandra ACIS is entirely photon limited for point-source detection near the aim point. For a power-law model with photon index and the Galactic column density, our count detection limit corresponds to soft-band and hard-band flux limits of erg cm-2 s-1 and erg cm-2 s-1, respectively.
2.3 Variability Testing
All sources have been checked for count-rate variability using Kolmogorov-Smirnov (K-S) tests, and the results are reported in Table 2. Such testing is statistically valid even when the number of counts is small, although clearly the sensitivity of the K-S test is reduced when only a few counts are available. Use of the K-S test avoids a posteriori selection problems as discussed by Press & Schechter (1974). The testing is always performed in the band where a source has its highest signal-to-noise ratio, and the standard ASCA grades were used in this analysis. We have used apertures for count extraction; these are appropriate since the HDF-N was kept close to the aim point for all observations. Gaps between observations were accounted for in the testing.
The two sources showing statistically significant evidence for variability are discussed in §3.2.
3 Results
3.1 Newly Detected Sources
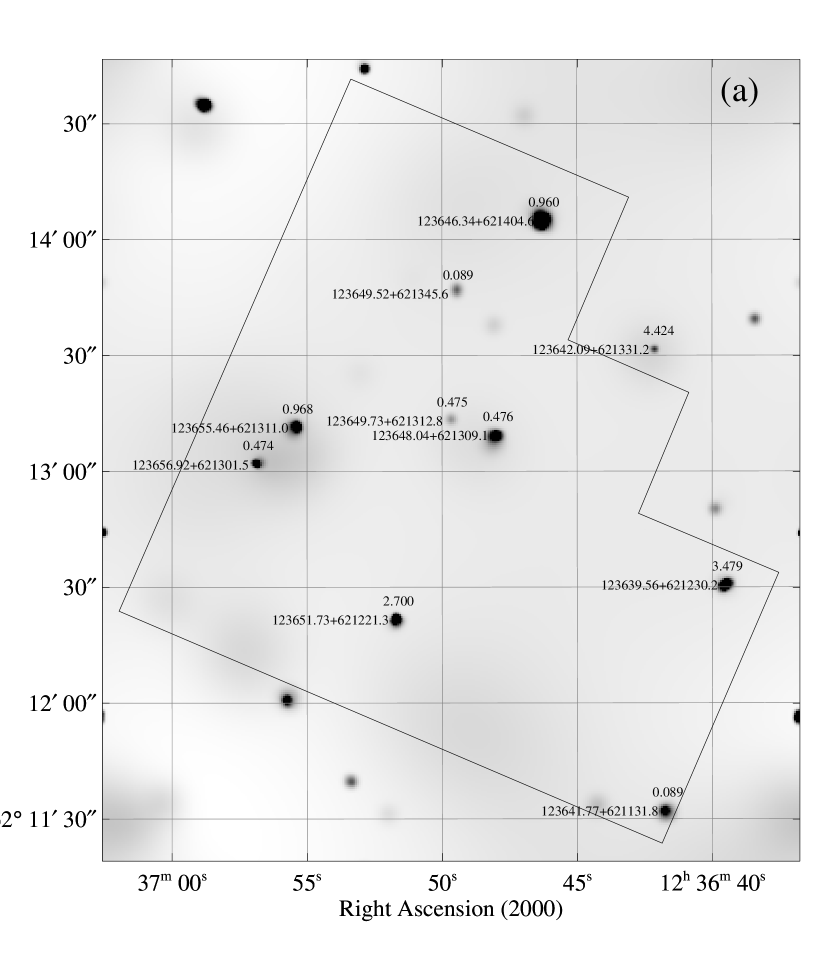
Figure 2 shows the Chandra sources detected thus far overlaid on the W96 HDF-N image, and Table 3 gives the identification information for these sources. Below we describe the properties of the newly detected sources.
CXOHDFN J123642.0+621331: This X-ray source lies just outside the HDF-N itself and is positionally coincident with the remarkable Jy radio source VLA J123642.09+621331.4 (e.g., Richards et al. 1998; Garrett et al. 2001). Detailed studies of this source indicate a redshift of (Waddington et al. 1999; R.A. Windhorst 2001, private communication; but also see §2.2 of Barger, Cowie, & Richards 2000); we shall adopt this redshift throughout the rest of the discussion below as the other redshift possibilities appear less likely. This source is thought to be powered by either a dust-enshrouded AGN or an ultraluminous starburst. If the redshift is correct, then this is the most distant X-ray source detected thus far in our Chandra field and the ninth most distant cosmic object detected in X-rays (after seven quasars and one gamma-ray burst). The 0.5–2.0 keV observed-frame bandpass in which VLA J123642.09+621331.4 is most clearly detected corresponds to a rest-frame bandpass of 2.7–10.8 keV. The implied luminosity in this bandpass of erg s-1 strongly supports the presence of an AGN.
In Figure 3 we compare the AB1450 magnitude (AB from Figure 3 of Waddington et al. 1999) and 0.5–2.0 keV flux of VLA J123642.09+621331.4 with those of AGN observed in X-rays (see Kaspi, Brandt, & Schneider 2000 and Brandt et al. 2001). VLA J123642.09+621331.4 is both the optically faintest and X-ray faintest AGN detected in X-rays; it provides the best constraints to date upon the X-ray properties of moderate-luminosity AGN. In fact, to our knowledge VLA J123642.09+621331.4 has the lowest optical luminosity of all known AGN (compare with Stern et al. 2000).
We have estimated , the slope of a nominal power law between 2500 Å and 2 keV in the rest frame. A power law was adopted for the X-ray continuum (following Reeves & Turner 2000), and an optical power-law slope of (see Schneider, Schmidt, & Gunn 1991 and Fan et al. 2001) was used to calculate the 2500 Å flux density from the AB1450 magnitude. We find . This value of is in good agreement with values found for low-redshift AGN of comparable X-ray luminosity (e.g., Avni & Tananbaum 1986; Brandt, Laor, & Wills 2000, hereafter BLW). There is no evidence that the X-rays are strongly suppressed by internal absorption, although given that we are only sensitive to hard X-rays in the rest frame the intrinsic is only constrained to be cm-2.
In contrast to the results from optically and radio selected AGN surveys, ROSAT surveys do not show a significant decrease in the space density of high-redshift, high-luminosity AGN (see §5 of Miyaji, Hasinger, & Schmidt 2000). Our X-ray detection of the moderate-luminosity AGN VLA J123642.09+621331.4 at should ultimately be useful for pinning down the X-ray luminosity function (XLF) of AGN when combined with the results from other deep X-ray surveys. At present it is difficult to assess the relation of VLA J123642.09+621331.4 to the XLF because its X-ray luminosity is times lower than those used for all high-redshift XLF studies to date.
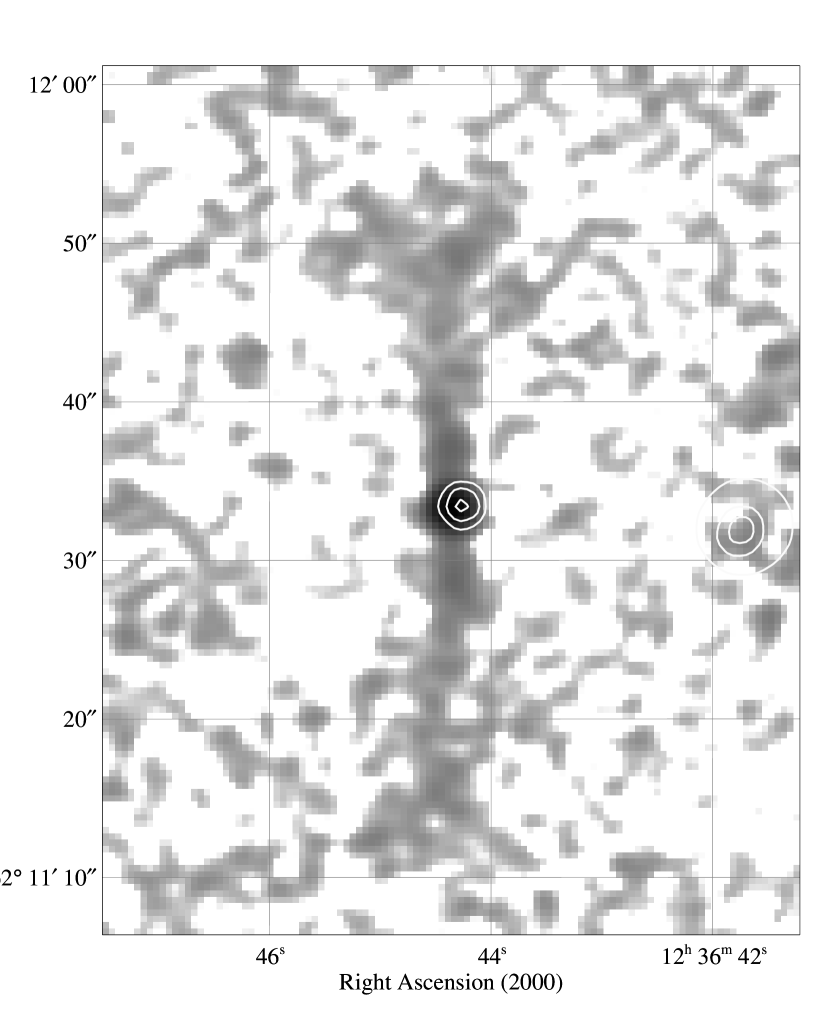
CXOHDFN J123644.3+621132: This X-ray source is coincident with a Fanaroff-Riley I (FR I) radio galaxy at that is one of the brightest radio sources in our field (its 1.4 GHz flux density is 1.29 mJy; Richards et al. 1998; Richards 2000). Its radio structure is extended over , but we only detect the core in X-rays (see Figure 4). The host galaxy is a large elliptical and is a Very Red Object (VRO) with (Hogg et al. 2000).
Using stacking techniques, H01 found evidence for two X-ray emission classes of VROs: (1) X-ray luminous VROs with hard X-ray spectra and (2) lower X-ray luminosity VROs with softer X-ray spectra. CXOHDFN J123644.3+621132 is only detected in the soft band and appears to be a member of the second class that has now been individually detected (previously the X-ray emission from the second class was only detectable when many objects were stacked). The X-ray emission is probably associated with the AGN or the hot interstellar medium and X-ray binaries of the host galaxy. The observed band ratio (see Table 2) cannot discriminate between these possibilities, and the X-ray luminosity is not inconsistent with an origin in the hot gas and X-ray binaries of this large elliptical (e.g., see Figure 2 of Matsushita, Ohashi, & Makishima 2000).
FR I sources are often located in clusters of galaxies, but no evidence is found for diffuse X-ray emission around CXOHDFN J123644.3+621132. At , the angular diameter of the core of a cluster would be (corresponding to Mpc). Using an annulus with an inner radius of and an outer radius of , we find a upper limit on the number of full-band counts of (we also excluded X-ray emission from CXOHDFN J123641.7+621131 using an exclusion cell with a radius of ). For a Raymond-Smith plasma with keV and one-third solar abundances, the full-band luminosity limit is erg s-1. No hint of X-ray emission from the other objects near CXOHDFN J123644.3+621132 is seen (see §6.1 of Richards et al. 1998).
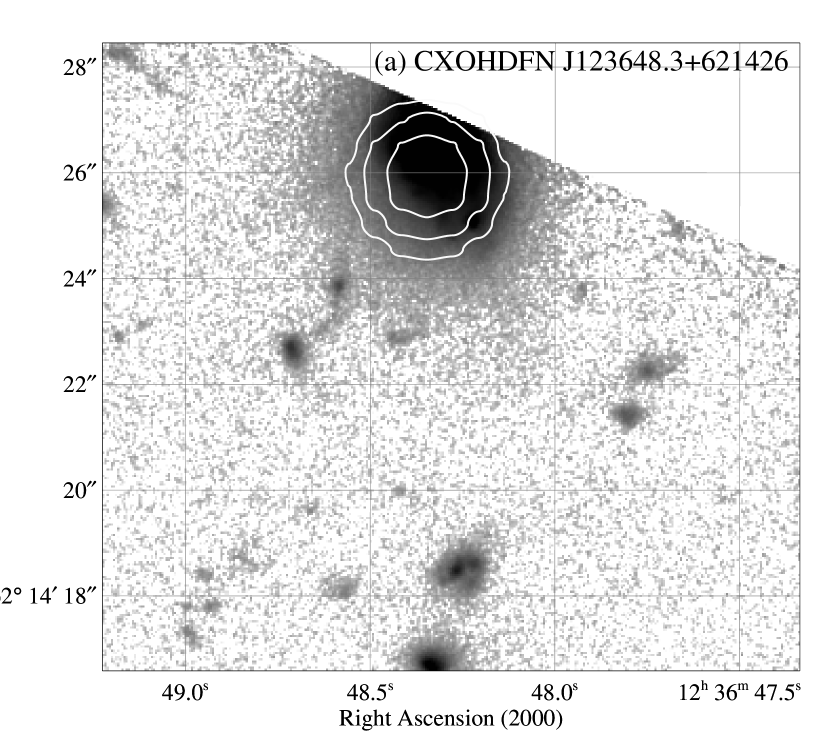
CXOHDFN J123648.3+621426: This source is coincident with a bright elliptical located at the edge of the HDF-N (see Figure 5). This galaxy has also been detected at radio and mid-infrared wavelengths (Richards et al. 1998; Aussel et al. 1999). The mid-infrared colors from ISO are consistent with the re-emission of starlight by interstellar grains as opposed to the light from cool stars (Rowan-Robinson et al. 1997). Given the low X-ray luminosity of this source and the weak constraint on its band ratio of (see Table 2; this band ratio constraint corresponds to a photon index constraint of for a power-law model with the Galactic column density), the observed X-ray emission can be plausibly explained by emission from a hot interstellar medium, perhaps combined with emission from X-ray binaries (e.g., Matsushita et al. 2000 and references therein).
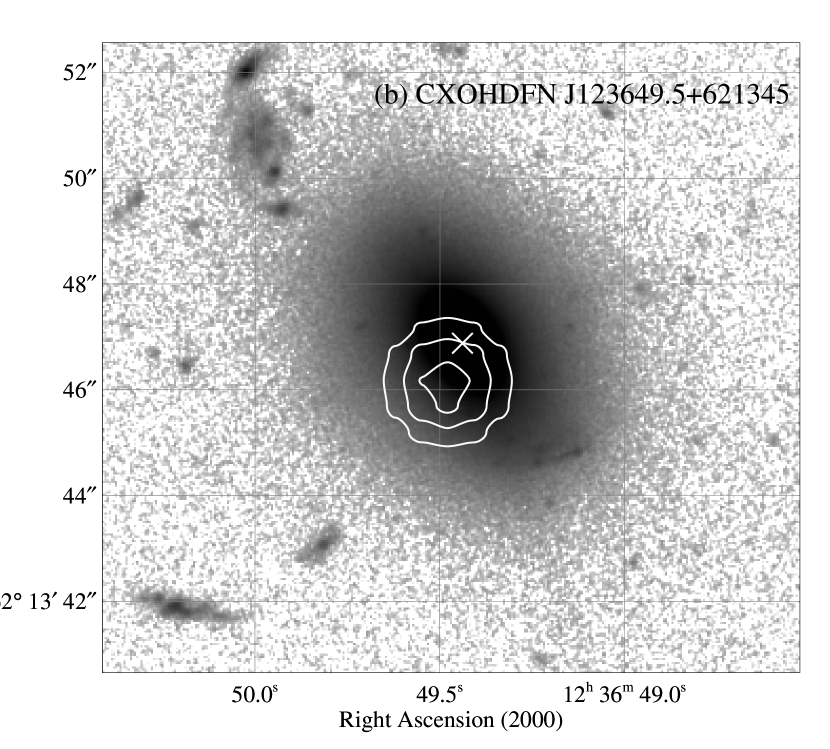
CXOHDFN J123649.5+621345: This source is located from the center of one of the optically brightest galaxies in the HDF-N, an S0 or elliptical at (see Figure 5); the corresponding projected physical offset is kpc. Although the photon statistics are limited, the fact that this offset is times larger than the offsets for the other sources (see Table 3) argues that the X-ray source is indeed off-nuclear. The 0.5–8.0 keV luminosity of erg s-1 is comparable to that of the most luminous X-ray binaries in the Local Group, and an X-ray binary nature for this source would naturally explain its off-nuclear location. We are not able to constrain the band ratio for this source since it is only detected in the full band.
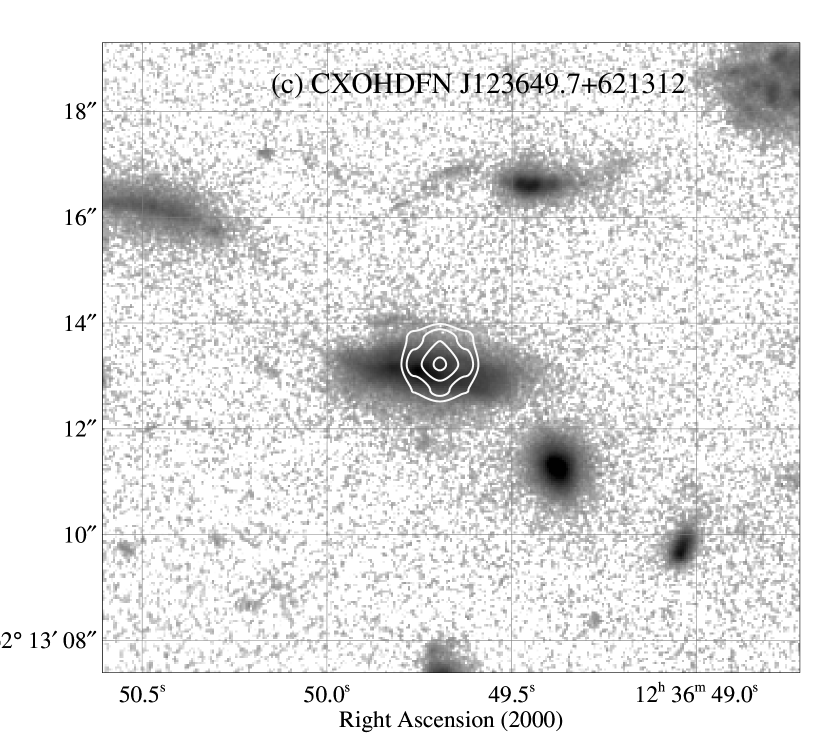
CXOHDFN J123649.7+621312: The X-ray source is coincident with the nucleus of an edge-on spiral at (see Figure 5) that is also a steep-spectrum radio source (Richards et al. 1998). The radio emission is thought to be predominantly due to starburst activity (see Chapter 4 of Richards 1999). The soft-band X-ray luminosity of erg s-1 is times that of the prototype starburst galaxy M82 (e.g., Griffiths et al. 2000). Given the X-ray luminosity and X-ray-to-optical flux ratio, the observed emission could be created by a powerful starburst and/or a low-luminosity active nucleus (e.g., Moran, Halpern, & Helfand 1996; Boller et al. 1998; Ho et al. 2001).
3.2 Further Results on Previously Detected Sources
The other eight Chandra sources detected in the HDF-N have already been described in H00 and §6 of H01; all of these previously reported sources are still detected in our improved analysis here. Below we report on some new results for these sources.
CXOHDFN J123639.5+621230: This source is associated with a broad-line AGN (see H01). The K-S test indicates highly significant count-rate variability in the full band; a constant count rate is rejected with % confidence (see Table 2). The variability is also apparent in Figure 6. During the first four observations, 15 source plus background counts were obtained in 221.9 ks, while during the last two observations 51 counts were obtained in 257.9 ks. The Poisson probability of obtaining the last two observations (or any with a higher number of counts) given the first four is ; the variability is thus highly significant even considering issues such as those described by Press & Schechter (1974). We are not aware of any instrumental effects that might explain the observed variability, and only background counts are expected in the aperture (see §2) during the entire 479.7 ks exposure. We note that the much brighter source CXOHDFN J123646.3+621404 does not show significant evidence for variability; apparent variability of this source might have been expected if the X-ray detection efficiency had changed substantially between observations.333See http://www.astro.psu.edu/users/townsley/cti/I3memo/ for constraints on temporal changes of the X-ray detection efficiency when radiation damage correction is performed with the procedure of Townsley et al. (2000). The observed count-rate variability by a factor of occurred over months in the object’s rest frame; CXOHDFN J123639.5+621230 is one of the highest redshift X-ray variable objects known. The amplitude of the observed X-ray variability appears consistent with that seen from low-redshift AGN of similar X-ray luminosity over comparable timescales (e.g., McHardy, Papadakis, & Uttley 1998).
CXOHDFN J123643.9+621249: This Chandra source is associated with a AGN candidate (see H01). The K-S test suggests count-rate variability of this source at the 98.5% confidence level (see Table 2). Examination of the soft-band light curve in Figure 6 indicates a probable drop in count rate during the last two observations. During the first four observations, we obtained seven source plus background counts in 221.9 ks, while during the last two observations we obtained zero counts in 257.9 ks. The Poisson probability of obtaining the last two observations given the first four is , so the variability is considered to be significant at the level. The required amplitude of count-rate variability is poorly constrained, but we estimate it to be at least a factor of . This apparent X-ray variability (combined with the observed luminosity) supports the AGN nature of CXOHDFN J123643.9+621249. The amplitude and timescale of the variability are consistent with what is seen from low-redshift AGN of similar luminosity (e.g., McHardy et al. 1998).
CXOHDFN J123646.3+621404: We have now collected sufficient counts from this broad-line AGN for moderate-quality spectral fitting. In this fitting, we have treated separately the data taken when the focal plane temperature was C and C; the spectra and response matrices were created following G01. A simple power-law model with only Galactic absorption clearly fails to fit the spectrum and is statistically rejected with % confidence. The resulting residuals strongly suggest the presence of intrinsic X-ray absorption (note also the fairly large band ratio of this source; see Table 2); when neutral intrinsic absorption is added we obtain a good fit with for 37 degrees of freedom (see Figure 7). The derived intrinsic column density is cm-2, and the photon index is (fit parameter errors are quoted for here and hereafter); the photon index, while rather flat, is consistent with those seen from other AGN of comparable X-ray luminosity (e.g., Brandt, Mathur, & Elvis 1997). The addition of ionized intrinsic absorption can also provide a good fit to the data, although the fit parameters are poorly constrained.
The large intrinsic column density derived for the X-ray source has prompted us to search for signs of absorption at other wavelengths: e.g., occultation of the Broad Line Region by a torus or absorption in the rest-frame ultraviolet (UV). Phillips et al. (1997) have described a Keck spectrum of this object, and we have obtained and analyzed this spectrum via the DEEP project database.444See http://deep.ucolick.org/hdf/hdf.html Two narrow Mg ii absorption doublets are seen superposed upon the blue wing of the broad (FWHM km s-1) Mg ii emission line (see Figure 8 and Phillips et al. 1997). For the stronger doublet, the rest-frame equivalent widths (EWs) of the Mg ii and Mg ii absorption lines are Å and Å, respectively. For the weaker doublet, the corresponding EWs are Å and Å. While the breadth of the observed Mg ii emission line demonstrates that the Broad Line Region is not hidden by a torus (i.e., this is not a Type 2 AGN), there is clearly absorbing material along the line of sight.
Intrinsic X-ray and UV absorption are often seen together in the spectra of Seyfert galaxies and quasars, although the precise relation between these two forms of absorption is still debated (e.g., Crenshaw et al. 1999; BLW; and references therein). The large column density derived for the X-ray absorber strongly suggests that it is related to the AGN. The UV Mg ii absorption is also likely to be intrinsic given the large doublet EWs and the fact that there are two absorption doublets so close together (compare with Steidel & Sargent 1992 and Aldcroft, Bechtold, & Elvis 1994). The EW ratios of the Mg ii doublets are consistent with both of them being saturated, and it is not possible to derive reliable Mg ii column densities from these data. The outflow velocity for the stronger Mg ii doublet is km s-1, and the outflow velocity for the weaker doublet is km s-1; these velocities are measured relative to the systemic redshift of rather than the poorly defined peak of the Mg ii emission line (see Appendix B of Phillips et al. 1997). It is possible that both the X-ray and UV absorption arise in an outflowing “warm absorber” similar to those seen in Seyfert galaxies at low redshift. Mg ii absorption is not commonly seen from Seyfert galaxies with warm absorbers, but it is detected in some such as NGC 4151 (e.g., Crenshaw et al. 1999).
Although this AGN is known to be variable in the radio (Richards et al. 1998; by % over an 18 month period) and optical (Sarajedini et al. 2000; by % over an 24 month period) and is by far the brightest X-ray source in the HDF-N, no significant X-ray variability is detected.
CXOHDFN J123651.7+621221: This source is coincident with the remarkably red object NICMOS J123651.74+621221.4 (Dickinson et al. 2000; also see §4 of Dickinson 2000) which has been argued to be either a high-redshift starburst enshrouded in dust (e.g., Muxlow et al. 1999) or a Type 2 quasar candidate (H00). With the increased exposure time, this source is now detected in the ultrahard band from 4–8 keV with counts. If this source is indeed at moderate or high redshift (see Table 3), it almost certainly contains an active nucleus given its large hard X-ray luminosity and its hard X-ray spectral shape. Note that it has the largest band ratio of any source in the HDF-N (see Table 2).
Although this object is the second brightest X-ray source in the HDF-N and is of great scientific interest, only crude X-ray spectral fitting is possible at present. The large band ratio suggests the probable presence of X-ray absorption, so we have fitted the spectrum with a power-law model that is absorbed by neutral gas at (see Table 3). The resulting fit is acceptable although poorly constrained, and the best-fit column density is cm-2. The corresponding absorption-corrected luminosity in the 0.5–8.0 keV band is erg s-1.
3.3 Band Ratios and X-ray-to-Optical Flux Ratios
In Figure 9 we show a plot of X-ray band ratio (see Table 2) versus soft-band count rate. This compares the HDF-N sources detected here to the sources detected with 221.9 ks of Chandra exposure by H01 (also compare with Figure 2 of Giacconi et al. 2001). Our faintest HDF-N sources occupy a region of low count rate and relatively low band ratio that has not been previously seen for individual sources, although stacking analyses had suggested that sources would occupy this region (e.g., Figure 2 of Giacconi et al. 2001). This is partially due to the fact that, with more exposure, we can place tighter upper limits on the X-ray band ratios for several of these sources.
The two hardest X-ray sources in the HDF-N itself are CXOHDFN J123646.3+621404 and CXOHDFN J123651.7+621221; notably, these are also the two brightest HDF-N sources in terms of their full-band emission (see Table 2). In §3.2 it was shown that the hard spectrum of CXOHDFN J123646.3+621404 is almost certainly due to intrinsic X-ray absorption, and this is probably the case for CXOHDFN J123651.7+621221 as well.
In Figure 10 we plot magnitude versus soft-band flux. All but one of the faintest ( erg cm-2 s-1) Chandra sources in the HDF-N lie below the region occupied by luminous AGN, as expected from the source descriptions in §3.1 and §3.2. Some of these sources appear to be low-luminosity AGN while others are normal galaxies. The one faint X-ray source that is also optically faint is CXOHDFN J123642.0+621331, which occupies the AGN region as expected from Figure 3.
Although the X-ray faint, optically bright sources comprise a heterogeneous population, we have determined an average band ratio for these sources to constrain their average spectral shape. We have used the six sources lying below the line in Figure 10 as well as CXOHDFN J123649.5+621345. The average band ratio is , corresponding to a photon index of for a power-law model with the Galactic column density. This photon index is consistent with that of X-ray binaries and some low-luminosity AGN, although we are hesitant to provide detailed interpretation due to the heterogeneous nature of the averaged sources. A similar photon index has recently been derived by Tozzi et al. (2001).
3.4 Stacking Analysis Results
3.4.1 Optically Bright Galaxies
Several of the optically bright galaxies in the HDF-N have now been found to be low-luminosity X-ray sources (see Figure 2). In order to extend these results, a stacking analysis was performed to attempt to detect the HDF-N galaxies from W96 with that are not individually detected in X-rays. Two galaxies lying near (but unrelated to) relatively bright Chandra sources were removed from consideration to minimize background and avoid any contamination (sources 3-400.0 and 3-659.0 in W96). The X-ray data for all galaxies were manually inspected to ensure that none of them is an X-ray source lying just below the detection limit; none of the sources contains a point source with full-band counts, and most would not admit a point source with full-band counts (after subtraction of the expected background). The resulting galaxy sample has 17 objects with from 19.9–22.5 including 11 spirals, three ellipticals and three irregulars (see Table 4 and Figure 2). None of these galaxies is known to have broad optical emission lines (Cohen et al. 2000), and none of them has been identified as an AGN candidate in the searches of Jarvis & MacAlpine (1998), Conti et al. (1999), Liu et al. (1999), Sarajedini et al. (2000) and Vanden Berk et al. (2000). Only two of them (sources 2-404.0 and 2-736.0 in W96) have been detected in the radio by Richards et al. (1998) and Richards (2000). The effective exposure time of the stacked image is 7.7 Ms, and we have used the restricted ACIS grade set in this analysis.
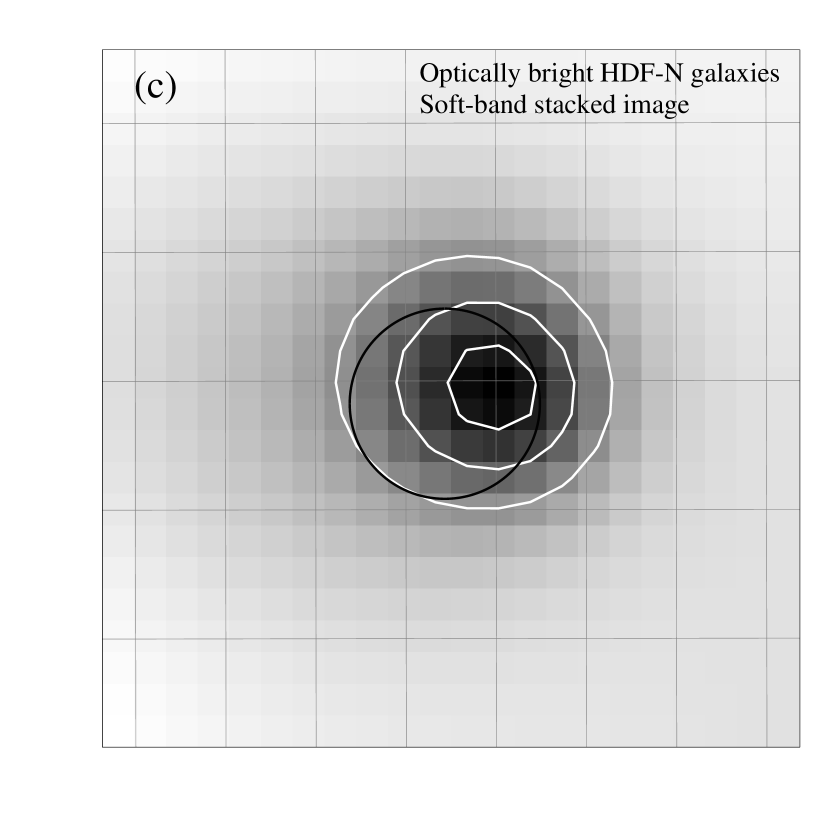
If the galaxies under study are indeed X-ray sources, some of them are likely to have their X-ray emission offset from their nuclei (as for the cases of CXOHDFN J123641.7+621131 and CXOHDFN J123649.5+621345), but without a priori knowledge of the location of this emission we are limited to stacking these galaxies at their nuclei (with one exception; see Table 4). Given the optical extents of these galaxies, X-ray emission up to from the nucleus is plausible in most cases. Therefore, for each galaxy the 30 pixels with centers within of the stacking position were considered (see Figure 11a). In the full-band stacked image, 79 counts were detected in these 30 pixels while 49.7 are expected from background. The Poisson probability of obtaining 79 counts or more when 49.7 are expected is only , so full-band X-ray emission from the average galaxy is detected with high significance. Figure 11b shows that the full-band X-ray emission appears to be well centered on the nuclear positions of the galaxies, although the centroid position is in fact uncertain at the level due to the combination of limited photon statistics, background, and the ACIS pixel size. There also appears to be a detection in the stacked soft-band image. Following the same procedure as for the full-band image, we obtain 29 events when 10.5 are expected; the corresponding Poisson probability is . The soft-band emission centroid appears somewhat offset from the nuclear positions (see Figure 11c), although as above we note that the centroid position is fairly uncertain. We have not found statistically significant evidence for a detection in the hard-band stacked image.
Source searching with wavdetect confirms the detections from the manual Poisson calculations above, although the detection significances are somewhat lower. The full-band and soft-band sources are detected when wavdetect is run with probability thresholds of and , respectively. Given that 30 pixels are being searched in each case, the respective probabilities of false detections are and . Monte-Carlo simulations were also performed to examine the reliability of the stacking analyses; good agreement was obtained with the Poisson statistics calculations above (see Appendix A). Finally, these stacking analyses are not subject to biases such as those discussed by Eddington (1913) because the number of sources under consideration is fixed and was not determined using the X-ray data.
One concern with the interpretation of an average brightness from a stacking analysis is that simply dividing the observed number of counts by the number of sources does not necessarily yield an accurate estimate of the characteristic brightness of the population; e.g., the bulk of the observed counts might be produced by only one or two sources. In this study, however, we believe that averages do reasonably reflect typical brightnesses. In the full-band stacking above, for example, there are observed counts from 17 sources. No individual source, as noted above, has counts. Therefore at least sources, and very likely more, are contributing to the observed counts.
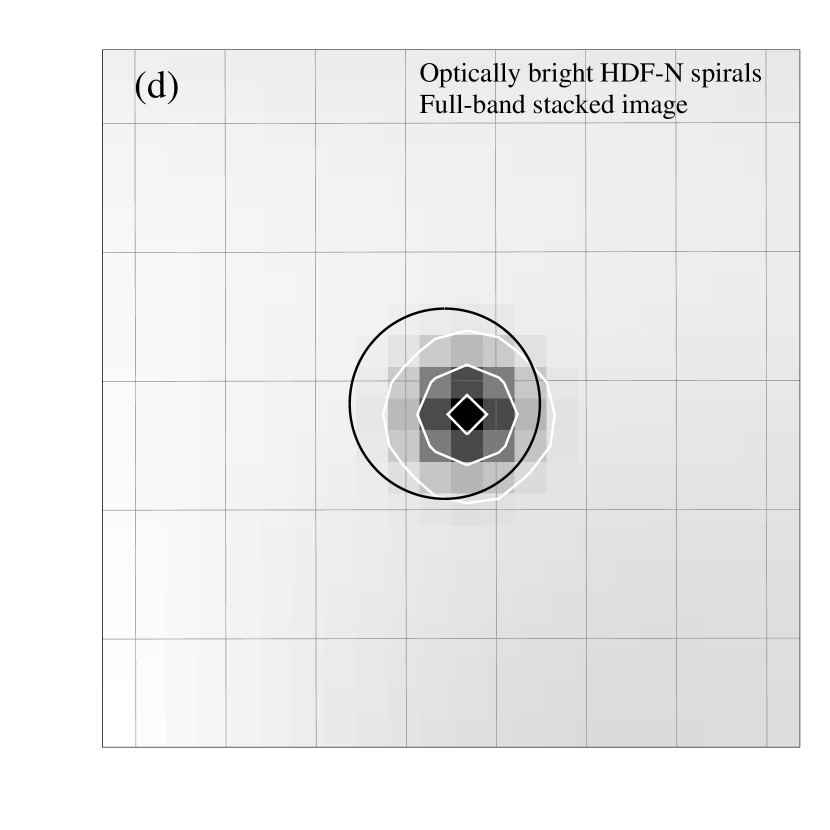
We have repeated the stacking analysis above for only the 11 spirals with (see Table 4); the effective exposure time of the resulting stacked image is 5.0 Ms. In the full-band image we obtain 47 events when 32.1 are expected (see Figure 11d); the corresponding Poisson probability is , and the Monte-Carlo analysis in Appendix A gives essentially the same probability. This detection is significant at the 99.2% confidence level. We do not obtain significant detections in the soft band or hard band for the spiral galaxy sample.
3.4.2 Radio Sources
In H00 we described the fairly good correspondence between X-ray sources and radio sources, and this continues now that deeper X-ray data are available. For example, eight of our 12 Chandra sources in the HDF-N are detected at 8.5 GHz by Richards et al. (1998). Furthermore, we preferentially detect in X-rays the brighter 8.5 GHz sources: all but one of the six radio sources with 8.5 GHz fluxes above 10 Jy are detected, compared to only three of the nine radio sources with 8.5 GHz fluxes below 10 Jy. To constrain the X-ray properties of the seven 8.5 GHz HDF-N sources not detected individually in X-rays, we have stacked them but do not obtain statistically significant point-source detections in any of our bands. The upper limit on a point source in the full-band stacked image is counts in 3.2 Ms (this is a 95% confidence upper limit calculated following Kraft, Burrows, & Nousek 1991). Adopting the spectral model used in §2.2, the upper limit on the full-band flux of the average source is erg cm-2 s-1.
4 Discussion
4.1 General Source Properties and Number Counts
With the new data, the number of Chandra sources detected in the HDF-N itself has risen from eight (H01) to 12. Nine of these 12 sources are detected in the full band, 11 are detected in the soft band, six are detected in the hard band, and two are detected in the ultrahard band. We have not found any sources that are detected only in the hard or ultrahard bands.
All of the Chandra HDF-N sources have likely counterparts at optical or near-infrared wavelengths. Most of the Chandra sources reside in optically luminous galaxies (see Table 3), and at a given redshift they tend to be among the optically brightest galaxies in the HDF-N (for our cosmology an galaxy has ). This result is consistent with that of Barger et al. (2001), extending it downward in X-ray flux by a factor of . There are, however, some apparent exceptions to this trend. For example, if CXOHDFN J123656.9+621301 is at (see Table 3), it is one of the optically fainter galaxies at this redshift. We also note that the hosts of both CXOHDFN J123641.7+621131 and CXOHDFN J123649.5+621345 have fairly low optical luminosities, and in each of these cases the X-ray source appears to be spatially offset from the nucleus (and thus is presumably not associated with a supermassive black hole). It will be important to avoid such objects when using deep X-ray surveys to conduct censuses of supermassive black holes in the local () Universe. This can probably be done with careful astrometric analysis and by exploiting the large negative values of these objects (see §3.3).
Most of the Chandra HDF-N sources have radio luminosities consistent with those of normal galaxies (e.g., Condon 1992); this is in agreement with the results of Barger et al. (2001) and H01, and it extends these results to fainter X-ray flux levels. The only Chandra sources that appear to be radio-loud AGN (using the criterion of Hooper et al. 1996) are CXOHDFN J123642.0+621331 (provided its redshift is ; see §3.1) and perhaps the FR I galaxy CXOHDFN J123644.3+621132 (see Figure 4). CXOHDFN J123646.3+621404 and CXOHDFN J123651.7+621221 also have enhanced radio emission compared to that expected from a normal galaxy, although they are not radio loud. We have compared the radio angular sizes and morphologies of our Chandra sources to those of the other radio sources in Table 3 of Richards et al. (1998), Chapter 4 of Richards (1999), and Table 2 of Richards (2000); one might expect X-ray emitting AGN to have core-jet or compact morphologies. CXOHDFN J123644.3+621132 has a clear core-jet radio morphology (see Figure 4), and CXOHDFN J123646.3+621404 and CXOHDFN J123642.0+621331 are notably compact with 8.5 GHz angular sizes . However, due to the limited sample size and radio constraints, it is not possible to draw general conclusions at present.
The corresponding soft-band and hard-band source densities for this 5.3 arcmin2 field are deg-2 (at erg cm-2 s-1) and deg-2 (at erg cm-2 s-1), respectively (error bars on these values have been calculated following Gehrels 1996). These flux limits are a factor of lower than those previously reported (Mushotzky et al. 2000; G01; Giacconi et al. 2001; Hasinger et al. 2001), and these source densities are the highest yet reported. The number counts in the soft band lie somewhat above an extrapolation of those cited above, although the discrepancy is not highly significant; any excess may be due to the emergence of the optically bright galaxies as low-luminosity X-ray sources (e.g., §5.4 of H01). The number counts in the hard band are consistent with an extrapolation of those cited above.
4.2 Stacking Analyses of Optically Bright Galaxies
A comparison of our HDF-N X-ray source list with the Cohen et al. (2000) and Cohen (2001) redshift catalogs for the HDF-N reveals that three of the five lowest-redshift () galaxies known in the HDF-N have now been detected in the X-ray band, including all of those with (the two non-detected galaxies at both have absolute magnitudes of only ). This high detection fraction is understandable given that the sensitivity needed to detect the most luminous ( erg s-1) X-ray binaries and supernova remnants at (e.g., Schlegel 1995; Makishima et al. 2000) has now been achieved. Indeed, two of the three low-redshift X-ray detections are spatially offset from their host galaxies’ nuclei. For comparison, our sensitivity limit would allow detection of the Galactic microquasar GRS 1915+105 (one of the most luminous X-ray sources in the Galaxy; e.g., Greiner, Morgan, & Remillard 1996) to . Similarly, we could detect the most luminous known off-nuclear source in M82 at its peak (e.g., Kaaret et al. 2001) to .
The stacking analyses in §3.4.1 have extended the constraints on galaxy X-ray emission to 0.2–1 for galaxies with 19.9–22.5. These analyses are complementary to the cross-correlation work performed with ROSAT on galaxies with similar optical magnitudes (e.g., Almaini et al. 1997 and references therein; also see Refregier, Helfand, & McMahon 1997 for the cross-correlation work on optically brighter galaxies). Because of our much greater sensitivity, a positive signal is obtained with many fewer galaxies (the ROSAT cross-correlations needed galaxies while we used 11–17). The greater sensitivity of this study also provides much tighter constraints on the X-ray luminosities of the individual galaxies used in the analysis. For comparison, the 0.5–2.0 keV luminosity limit for an individual galaxy at is erg s-1 in the current study while the ROSAT cross-correlation studies had individual galaxy luminosity limits of erg s-1 at this redshift. Unlike the ROSAT cross-correlation studies, we should be fairly immune to contamination by Seyfert nuclei (e.g., see §4 of Almaini et al. 1997); note that our good 2–8 keV sensitivity should also allow us to detect moderately obscured AGN with low-level soft X-ray emission. It is still possible that some low-luminosity AGN remain in the galaxy sample in Table 4; low-luminosity AGN are seen in % of local galaxies and have X-ray luminosities ranging from erg s-1 to erg s-1 with a median luminosity of erg s-1 (e.g., Ho et al. 2001). None of the galaxies in Table 4 has been identified as an AGN in the intensive HDF-N follow-up studies (see §3.4.1), although the current optical spectroscopy probably would not have detected the subtle spectral features often associated with low-luminosity AGNs.
Stacking the full-band images of the 11 spirals in Table 4 results in a detection of net counts in an effective exposure time of 5.0 Ms. At the median redshift of , the rest-frame bandpass corresponding to the full-band detection is 0.74–11.79 keV. Provided the basic X-ray production mechanisms in these spirals are similar to those of spirals in the local Universe, the emission in this bandpass is probably dominated by X-ray binaries and has an effective power-law photon index of (e.g., Kim, Fabbiano, & Trinchieri 1992). With this spectral model and the Galactic column density, the observed count rate implies a 0.5–8.0 keV flux of erg cm-2 s-1 for the average spiral in our sample (the corresponding 0.5–2.0 keV flux is erg cm-2 s-1).555We have corrected for the use of the restricted ACIS grade set rather than the standard ASCA grade set using the count ratios determined for CXOHDFN J123646.3+621404 in §2.1. At the median redshift of , the implied rest-frame 0.5–8.0 keV luminosity is erg s-1.
Normal spirals in the local Universe () with optical luminosities similar to those in the stacking sample have X-ray luminosities in the range erg s-1 to erg s-1. For example, the 11 spirals in Fabbiano, Trinchieri, & MacDonald (1984) with and X-ray detections have an average 0.5–8 keV luminosity of erg s-1.666We have corrected the luminosities from Fabbiano et al. (1984) for bandpass effects and have converted them into our adopted cosmology. Our derived luminosity of erg s-1 for the average spiral is somewhat higher than for the Fabbiano et al. (1984) spirals. However, the two samples are not inconsistent in the amount of X-ray luminosity per unit -band luminosity. The average spiral used in our stacking analysis is times more luminous in the band than the average spiral in the Fabbiano et al. (1984) comparison sample (although the medians of the two -band luminosity distributions only differ by a factor of ).
At the median redshift of , the lookback time is of the Hubble time. Thus, if this sample is representative of the Universe as a whole, it appears that the X-ray luminosities of normal spirals (per unit -band luminosity) have not evolved upward by more than a factor of over the past Gyr.
White & Ghosh (1998) considered the effects of the declining cosmic star-formation rate on the evolution of low-mass X-ray binary (LMXB) populations in galaxies. They suggested that LMXB activity should peak at 0.5–1 (rather than coincident with the peak in the cosmic star-formation rate) because the evolutionary timescale for LMXBs is a non-negligible fraction of the Hubble time. They also estimated that the X-ray luminosities of 0.5–1 galaxies should be at least an order of magnitude higher than they are today. While our current data allow the average galaxy X-ray luminosity at to be up to a factor of times higher than at , we do not see any evidence for an order-of-magnitude luminosity increase at this redshift. These are the first significant constraints on models such as those proposed by White & Ghosh (1998).
A. Ptak et al., in preparation, have recently refined the X-ray luminosities predicted by the LMXB evolution models of White & Ghosh (1998). They have made specific predictions for the HDF-N using the redshift data of Cohen et al. (2000). They predict smaller X-ray luminosities for 0.5–1 galaxies than discussed by White & Ghosh (1998), and their predicted luminosities [ (3–4) erg s-1 in the 0.5–8.0 keV band] are closer to those found by our stacking analysis.
4.3 Narrow Emission-Line Galaxies
The new Chandra data also allow us to test some predictions made previously about X-ray sources in the HDF-N. Almaini & Fabian (1997), for example, made predictions of the number of AGN in the HDF-N and proposed that X-ray luminous narrow-emission line galaxies (NELGs) may comprise up to % of the galaxies in the HDF-N. At our current soft-band sensitivity level, they predict NELGs to be present. Six of the 12 HDF-N sources in Table 3 have some narrow emission lines in their optical spectra (we exclude broad-line AGN and objects with absorption-dominated spectra). Two of these (CXOHDFN J123641.7+621131 and CXOHDFN J123648.3+621426), however, have X-ray luminosities below those typically associated with the NELG population (their X-ray to optical flux ratios are more representative of those of normal galaxies). Thus, we presently detect at most four X-ray luminous NELGs in the HDF-N (CXOHDFN J123643.9+621249, CXOHDFN J123648.0+621309, CXOHDFN J123649.7+621312 and CXOHDFN J123656.9+621301), below the predictions of Almaini & Fabian (1997) and inconsistent with them at the % confidence level. Higher quality optical spectroscopy of these four objects may well reveal that some of them contain previously unrecognized AGN.
5 Summary
We have used a 479.7 ks Chandra image, the deepest X-ray observation ever presented, to study the X-ray source content of the HDF-N and its immediate vicinity. The key results are the following:
-
•
Four new X-ray sources in the HDF-N itself have been discovered bringing the total number of HDF-N X-ray sources to 12. Two of the new sources are optically bright galaxies at low redshift; with their detection X-ray emission has now been detected from all three of the optically luminous () HDF-N galaxies with . The other two new X-ray sources are an FR I radio galaxy and an edge-on spiral that hosts a powerful starburst and/or low-luminosity AGN. See §3.1 and §4.1.
-
•
The remarkable Jy radio source VLA J123642.09+621331.4 is detected by Chandra. This source has a likely redshift of , and this X-ray detection supports the presence of an AGN in this object. The value of VLA J123642.09+621331.4 is in good agreement with values found for low-redshift AGN. See §3.1.
-
•
X-ray variability is found from the broad-line AGN CXOHDFN J123639.5+621230 and the AGN candidate CXOHDFN J123643.9+621249. The first brightens by a factor of over months in the rest frame, while the second dims by a factor of in a rest-frame time interval of months. The X-ray variability of CXOHDFN J123643.9+621249 strongly supports the presence of an AGN. See §3.2.
-
•
We have modeled the X-ray spectrum of the brightest X-ray source in the HDF-N, the broad-line AGN CXOHDFN J123646.3+621404. Evidence is found for intrinsic X-ray absorption with a column density of cm-2. This absorption is plausibly related to the Mg ii absorption doublets that are superposed upon the blue wing of the broad Mg ii emission line. See §3.2.
-
•
Stacking analyses of galaxies not individually detected in X-rays have provided estimates of the average X-ray fluxes of these objects. Their X-ray emission probably arises from combinations of X-ray binaries, supernova remnants, and low-luminosity AGN. The average X-ray luminosity of normal spiral galaxies at appears similar to that of spirals in the local Universe; this constrains models for the evolution of LMXB populations in galaxies in response to the declining cosmic star-formation rate. Monte-Carlo simulations demonstrate the validity of the stacking analyses and show that the Chandra ACIS performs well at source detection even with effective exposure times of Ms. See §3.4, §4.2 and Appendix A.
-
•
We have constrained the size of the population of X-ray luminous NELGs at the faintest X-ray fluxes. These sources are less common than has been predicted. See §4.3.
Appendix A Monte-Carlo Testing of the Stacking Analyses
The stacking methods employed in §3.4.1 have allowed us to study the properties of full-band sources down to flux levels of erg cm-2 s-1, pushing the source detection ability of Chandra beyond what has been achieved previously. As such, one must be cautious of instrumental effects and other potential problems that could lead to false source detections in the stacked images. In order to perform an “end-to-end” test of the stacking analysis and empirically assess false-detection probabilities, we have performed Monte-Carlo simulations. These were designed to reproduce the actual stacking performed as closely as possible.
Consider the full-band stacking analysis of the 17 galaxies in Table 4 performed in §3.4.1. To test this analysis, we have randomly selected 17 positions chosen to be at least 8 pixels from known X-ray sources and to have similar background levels to those of the actual galaxies being stacked. We have then constructed a stacked image from the data around these 17 positions and determined the number of counts in the 30 pixels with centers within of the stacking position (just as was done at the actual galaxy positions; see §3.4.1). Repeating the above 100,000 times, we have determined a distribution function showing the number of random trials giving a particular number of counts. The result is shown in Figure 12a. The resulting distribution is closely Gaussian; a Gaussian fit gives a mean of 49.1 counts and a standard deviation of counts. At the actual galaxy positions we obtained 79 counts. Only 9 of the 100,000 random trials yielded 79 counts or more, so the false-detection probability is only . For comparison, the Poisson statistics calculation in §3.4.1 gave a false detection probability of . The excellent agreement between the Monte-Carlo and Poisson statistics calculations gives us further confidence in the reliability of our stacking analyses and argues that there are no subtle instrumental effects causing false source detections. For example, subtle cosmic ray afterglows in ACIS could not cause a false detection since they will not be preferentially aligned with optically bright HDF-N galaxies. The ACIS performs well at source detection even with effective exposure times of Ms.
We have also performed Monte-Carlo testing of the other analyses presented in §3.4.1. The results are shown in Figures 12b and 12c, and we consistently obtain good agreement with the results presented in §3.4.1.
References
- (1)
- (2) Abraham, R.G., Ellis, R.S., Fabian, A.C., Tanvir, N.R., & Glazebrook, K. 1999a, MNRAS, 303, 641
- (3)
- (4) Abraham, R.G., Merrifield, M.R., Ellis, R.S., Tanvir, N.R., & Brinchmann, J. 1999b, MNRAS, 308, 569
- (5)
- (6) Aldcroft, T.L., Bechtold, J., & Elvis, M. 1994, ApJS, 93, 1
- (7)
- (8) Almaini, O. & Fabian, A.C. 1997, MNRAS, 288, L19
- (9)
- (10) Almaini, O., Shanks, T., Griffiths, R.E., Boyle, B.J., Roche, N., Georgantopoulos, I., & Stewart, G.C. 1997, MNRAS, 291, 372
- (11)
- (12) Aussel, H., Cesarsky, C.J., Elbaz, D., & Starck, J.L. 1999, A&A, 342, 313
- (13)
- (14) Avni, Y., & Tananbaum, H. 1986, ApJ, 305, 83
- (15)
- (16) Barger, A.J., Cowie, L.L., & Richards, E.A. 2000, AJ, 119, 2092
- (17)
- (18) Barger, A.J., Cowie, L.L., Mushotzky, R.F., & Richards, E.A. 2001, AJ, 121, 662
- (19)
- (20) Bessel, M.S. 1990, PASP, 102, 1181
- (21)
- (22) Boller, Th., Bertoldi, F., Dennefeld, M., & Voges, W. 1998, A&AS, 129, 87
- (23)
- (24) Brandt, W.N., Mathur, S., & Elvis, M. 1997, MNRAS, 285, L25
- (25)
- (26) Brandt, W. N., Laor, A., & Wills, B. J. 2000, ApJ, 528, 637 (BLW)
- (27)
- (28) Brandt, W.N., et al. 2000, AJ, 119, 2349
- (29)
- (30) Brandt, W.N., Guainazzi, M., Kaspi, S., Fan, X., Schneider, D.P., Strauss, M.A., Clavel, J., & Gunn, J.E. 2001, AJ, 121, 591
- (31)
- (32) Cohen, J.G., Hogg, D.W., Blandford, R., Cowie, L.L., Hu, E., Songaila, A., Shopbell, P., & Richberg, K. 2000, ApJ, 538, 29
- (33)
- (34) Cohen, J.G. 2001, AJ, in press (astro-ph/0101251)
- (35)
- (36) Coleman, G.D., Wu, C.-C., & Weedman, D.W. 1980, ApJS, 43, 393
- (37)
- (38) Condon, J.J. 1992, ARA&A, 30, 575
- (39)
- (40) Conti, A., Kennefick, J.D., Martini, P., & Osmer, P.S. 1999, AJ, 117, 645
- (41)
- (42) Crenshaw, D.M., Kraemer, S.B., Boggess, A., Maran, S.P., Mushotzky, R.F., & Wu, C. 1999, ApJ, 516, 750
- (43)
- (44) Dickinson, M. 2000, Phil. Trans. Royal Soc. Lond. A, 358, 2001
- (45)
- (46) Dickinson, M., et al. 2000, ApJ, 531, 624
- (47)
- (48) Ebeling, H., White, D.A., & Rangarajan, F.V.N. 2001, MNRAS, submitted
- (49)
- (50) Eddington, A.S. 1913, MNRAS, 73, 359
- (51)
- (52) Fabbiano, G., Trinchieri, G., & MacDonald, A. 1984, ApJ, 284, 65
- (53)
- (54) Fan, X., et al. 2000, AJ, 120, 1167
- (55)
- (56) Fan, X., et al. 2001, AJ, 121, 31
- (57)
- (58) Ferguson, H.C, Dickinson, M., & Williams, R., 2000, ARA&A, 38, 667
- (59)
- (60) Fernández-Soto, A., Lanzetta, K.M., Chen, H., Pascarelle, S.M., & Yahata, N. 2001, ApJ, submitted (astro-ph/0007447)
- (61)
- (62) Franceschini, A., Silva, L., Fasano, G., Granato, G.L., Bressan, A., Arnouts, S., & Danese, L. 1998, ApJ, 506, 600
- (63)
- (64) Freeman, P.E., Kashyap, V., Rosner, R., & Lamb, D.Q. 2001, ApJ, submitted
- (65)
- (66) Garrett, M.A., et al. 2001, A&A, 366, L5
- (67)
- (68) Gehrels, N. 1986, ApJ, 303, 336
- (69)
- (70) Giacconi, R., et al. 2001, ApJ, submitted (astro-ph/0007240)
- (71)
- (72) Greiner, J., Morgan, E.H., & Remillard, R.A. 1996, ApJ, 473, L107
- (73)
- (74) Griffiths, R.G., et al. 2000, Science, 290, 1325
- (75)
- (76) Hasinger, G., et al. 2001, A&A, 365, L45
- (77)
- (78) Ho, L.C., et al. 2001, ApJ, 549, L51
- (79)
- (80) Hogg, D.W., et al. 2000, ApJS, 127, 1
- (81)
- (82) Hooper, E.J., Impey, C.D., Foltz, C.B., & Hewett, P.C. 1996, ApJ, 473, 746
- (83)
- (84) Hornschemeier, A.E., Brandt, W.N., Garmire, G.P., Schneider, D.P., et al. 2000, ApJ, 541, 49 (H00)
- (85)
- (86) Hornschemeier, A.E., Brandt, W.N., Garmire, G.P., Schneider, D.P., et al. 2001, ApJ, in press (H01; astro-ph/0101494)
- (87)
- (88) Jarvis, R.M., & MacAlpine, G.M. 1998, AJ, 116, 2624
- (89)
- (90) Kaaret, P., Prestwich, A.H., Zezas, A., Murray, S.S., Kim, D.-W., Kilgard, R.E., Schlegel, E.M., & Ward, M.J. 2001, MNRAS, 321, L29
- (91)
- (92) Kaspi, S., Brandt, W.N., & Schneider, D.P. 2000, AJ, 119, 2031
- (93)
- (94) Kim, D.-W., Fabbiano, G., & Trinchieri, G. 1992, ApJ, 393, 134
- (95)
- (96) Kraft, R.P., Burrows, D.N. & Nousek, J.A. 1991, ApJ, 374, 344
- (97)
- (98) Liu, C.T., Petry, C.E., Impey, C.D., & Foltz, C.B. 1999, AJ, 118, 1912
- (99)
- (100) Livio, M., Fall, S.M., & Madau, P. 1998, The Hubble Deep Field. Cambridge University Press, Cambridge
- (101)
- (102) Lyons, L. 1991, Data Analysis for Physical Science Students. Cambridge University Press, Cambridge
- (103)
- (104) Makishima, K., et al. 2000, ApJ, 535, 632
- (105)
- (106) Matsushita, K., Ohashi, T., & Makishima, K. 2000, PASJ, 52, 685
- (107)
- (108) McHardy, I.M., Papadakis, I.E., & Uttley, P. 1998, Nuclear Phys. B., 69, 509
- (109)
- (110) Miyaji, T., Hasinger, H., & Schmidt, M. 2000, A&A, 353, 25
- (111)
- (112) Moran, E.C., Halpern, J.P., & Helfand, D.J. 1996, ApJS, 106, 341
- (113)
- (114) Mushotzky, R.F., Cowie, L.L., Barger, A.J., & Arnaud, K.A. 2000, Nature, 404, 459
- (115)
- (116) Muxlow, T.W.B., Wilkinson, P.N., Richards, A.M.S., Kellermann, K.I., Richards, E.A., & Garrett, M.A. 1999, New Astronomy Reviews, 43, 623
- (117)
- (118) Oke, J.B., et al. 1995, PASP, 107, 307
- (119)
- (120) Phillips, A.C., Guzmán, R., Gallego, J., Koo, D.C., Lowenthal, J.D., Vogt, N.P., Faber, S.M., & Illingworth, G.D. 1997, ApJ, 489, 543
- (121)
- (122) Press, W.H. & Schechter, P. 1974, ApJ, 193, 437
- (123)
- (124) Reeves, J.N. & Turner, M.J.L. 2000, MNRAS, 316, 234
- (125)
- (126) Richards, E.A., Kellermann, K.I., Fomalont, E.B., Windhorst, R.A., & Partridge, R.B. 1998, AJ, 116, 1039
- (127)
- (128) Richards, E.A. 1999, PhD thesis, University of Virginia (also see PASP, 112, 1001)
- (129)
- (130) Refregier, A., Helfand, D.J., & McMahon, R.G. 1997, ApJ, 477, 58
- (131)
- (132) Richards, E.A. 2000, ApJ, 533, 611
- (133)
- (134) Rowan-Robinson, M., et al. 1997, MNRAS, 289, 490
- (135)
- (136) Sarajedini, V.L., Gilliland, R.L., & Phillips, M.M. 2000, AJ, 120, 2825
- (137)
- (138) Schlegel, E.M. 1995, Rep. Prog. Phys., 58, 1375
- (139)
- (140) Schneider, D. P., Schmidt, M. & Gunn, J. E. 1991, AJ, 101, 2004
- (141)
- (142) Schneider, D.P., Schmidt, M., Hasinger, G. Lehmann, I., Gunn, J.E., Giacconi, R., Trümper, J., & Zamorani, G. 1998, AJ, 115, 1230
- (143)
- (144) Stark, A.A., Gammie, C.F., Wilson, R.W., Bally, J., Linke, R.A., Heiles, C., & Hurwitz, M. 1992, ApJS, 79, 77
- (145)
- (146) Steidel, C.C., & Sargent, W.L.W. 1992, ApJS, 80, 1
- (147)
- (148) Stern, D., Spinrad, H., Eisenhardt, P., Bunker, A.J., Dawson, S., Stanford, S.A., & Elston, R. 2000, ApJ, 533, L75
- (149)
- (150) Townsley, L.K., Broos, P.S., Garmire, G.P., & Nousek, J.A. 2000, ApJ, 534, L139
- (151)
- (152) Tozzi, P., et al. 2001, ApJ, submitted (astro-ph/0103014)
- (153)
- (154) van den Bergh, S., Abraham, R.G., Ellis, R.S., Tanvir, N.R., Santiago, B.X., & Glazebrook, K.G. 1996, AJ, 112, 359
- (155)
- (156) van den Bergh, S., Cohen, J.G., Hogg, D.W., & Blandford, R. 2000, ApJ, 120, 2190
- (157)
- (158) Vanden Berk, D.E., Stoughton, C., Crotts, A.P.S., Tytler, D., & Kirkman, D. 2000, AJ, 119, 2571
- (159)
- (160) Waddington, I., Windhorst, R.A., Cohen, S.H., Partridge, R.B., Spinrad, H., & Stern, D. 1999, ApJ, 526, L77
- (161)
- (162) Weisskopf, M.C., Tananbaum, H.D., Van Speybroeck, L.P. & O’Dell, S.L. 2000, Proc. SPIE, 4012, 2
- (163)
- (164) White, N.E. & Ghosh, P. 1998, ApJ, 504, L31
- (165)
- (166) Williams, R.E., et al. 1996, AJ, 112, 1335 (W96)
- (167)
| Name | Band | Grades | Background counts pixel-1 |
|---|---|---|---|
| Standard ASCA grade set | Full | ASCA grades 0, 2, 3, 4, 6 | |
| Soft | ASCA grades 0, 2, 3, 4, 6 | ||
| Hard | ASCA grades 0, 2, 3, 4, 6 | ||
| Ultrahard | ASCA grades 0, 2, 3, 4, 6 | ||
| Restricted ACIS grade set | Full | ACIS grades 0, 2, 8, 16, 64 | |
| Soft | ACIS grades 0, 64 | ||
| Hard | ACIS grades 0, 2, 8, 16 | ||
| Ultrahard | ACIS grades 0, 2, 8, 16 |
| Coordinates | Det. | Counts | Band | Flux | Probability | |||||
|---|---|---|---|---|---|---|---|---|---|---|
| Bandsa | FBb | SBb | HBb | Ratioc | FBd | SBd | HBd | of Constancye | ||
| 12 36 39.56 | +62 12 30.2 | FSH | 1.51 | 0.57 | 0.54 | |||||
| 12 36 41.77 | +62 11 31.8 | FS | 0.45 | 0.14 | ||||||
| 12 36 43.99 | +62 12 49.8 | S | 0.05 | |||||||
| 12 36 44.35 | +62 11 32.9 | S | 0.09 | 0.76 | ||||||
| 12 36 46.34 | +62 14 04.6 | FSHU | 21.61 | 2.92 | 18.81 | 0.43 | ||||
| 12 36 48.04 | +62 13 09.1 | FSH | 0.82 | 0.24 | 0.47 | 0.45 | ||||
| 12 36 48.36 | +62 14 26.0 | S | 0.06 | 0.56 | ||||||
| 12 36 49.52 | +62 13 45.6 | F | 0.11 | 0.94 | ||||||
| 12 36 49.73 | +62 13 12.8 | FS | 0.23 | 0.09 | 0.17 | |||||
| 12 36 51.73 | +62 12 21.3 | FSHU | 2.97 | 0.29 | 2.68 | 0.42 | ||||
| 12 36 55.46 | +62 13 11.0 | FSH | 1.13 | 0.44 | 0.76 | 0.63 | ||||
| 12 36 56.92 | +62 13 01.5 | FSH | 0.84 | 0.41 | 0.40 | 0.11 | ||||
| 12 36 42.09 | +62 13 31.2f | FS | 0.24 | 0.08 | 0.11 | |||||
| Coordinates | W96 | CXO/W96 | Other | Spect. | ||||||||
|---|---|---|---|---|---|---|---|---|---|---|---|---|
| Name | Offset(′′)a | Redshiftc | FBe | SBe | HBe | Typeg | Notes | |||||
| 12 36 39.56 | +62 12 30.2 | 4-852.12 | 0.16 | 24.3 | 3.479 | 43.8 | 43.1 | 43.4 | Broad-line AGN | |||
| 12 36 41.77 | +62 11 31.8 | 4-976 | 0.89h | 19.9 | 0.089 | 39.9 | 39.4 | I | Face-on spiral | |||
| 12 36 43.99 | +62 12 49.8 | 4-402.31 | 0.33 | 21.3 | 0.557 | 40.6 | R, I | AGN candidate | ||||
| 12 36 44.35 | +62 11 32.9 | 4-752.1 | 0.29 | 22.7 | 1.050 | 41.4 | R | FR I | ||||
| 12 36 46.34 | +62 14 04.6 | 2-251 | 0.03 | 22.1 | 0.960 | 43.5 | 42.6 | 43.5 | R, I | Broad-line AGN | ||
| 12 36 48.04 | +62 13 09.1 | 2-121 | 0.31 | 21.0 | 0.476 | 41.7 | 41.2 | 41.5 | I | Elliptical | ||
| 12 36 48.36 | +62 14 26.0 | 2-537.111 | 0.49 | 18.8 | 0.139 | 39.4 | R, I | Elliptical | ||||
| 12 36 49.52 | +62 13 45.6 | 2-456.1111 | 1.33i | 18.3 | 0.089 | 39.3 | I | S0 or Elliptical | ||||
| 12 36 49.73 | +62 13 12.8 | 2-264.1 | 0.31 | 21.9 | 0.475 | 41.1 | 40.7 | R, I | Edge-on spiral | |||
| 12 36 51.73 | +62 12 21.3 | 0.22 | 26.5 | 2.7 | 43.3 | 42.1 | 43.3 | R, I | NICMOS | |||
| 12 36 55.46 | +62 13 11.0 | 3-180 | 0.10 | 23.3 | 0.968 | 42.5 | 42.1 | 42.4 | R, I | Elliptical | ||
| 12 36 56.92 | +62 13 01.5 | 3-355 | 0.02 | 23.4 | 0.474 | 41.8 | 41.4 | 41.5 | R, I | Elliptical | ||
| 12 36 42.09 | +62 13 31.2j | 0.15 | 4.424 | 43.2 | 42.4 | R, I | AGN/Star-forming | |||||
| Namea | Morph. Typed | Spect. Typee | |||||
|---|---|---|---|---|---|---|---|
| 1-34.0 | 12 36 44.57 | 62 13 04.6 | 22.11 | 0.485 | Spiral | ||
| 1-87.0 | 12 36 45.85 | 62 13 25.8 | 21.49 | 0.321 | Spiral | ||
| 2-264.0 | 12 36 49.37 | 62 13 11.2 | 21.67 | 0.477 | Elliptical | ||
| 2-404.0 | 12 36 51.08 | 62 13 20.7 | 19.92 | 0.199 | Spiral | ||
| 2-652.0 | 12 36 51.78 | 62 13 53.7 | 21.94 | 0.557 | Spiral | ||
| 2-736.0 | 12 36 52.78 | 62 13 54.4 | 22.26 | 1.355 | Irregular | ||
| 3-350.0 | 12 36 53.90 | 62 12 54.0 | 21.88 | 0.642 | Spiral | ||
| 3-386.0 | 12 36 50.25 | 62 12 39.7 | 21.20 | 0.474 | Spiral | ||
| 3-534.0 | 12 36 58.76 | 62 12 52.3 | 21.58 | 0.321 | Spiral | ||
| 3-610.1 | 12 36 56.65 | 62 12 45.6 | 21.30 | 0.518 | Spiral | ||
| 3-965.0 | 12 36 57.48 | 62 12 10.5 | 22.23 | 0.665 | Elliptical | ||
| 4-241.1 | 12 36 47.04 | 62 12 36.8 | 21.40 | 0.321 | Irregular | ||
| 4-402.0 | 12 36 44.19 | 62 12 47.9 | 21.13 | 0.555 | Irregular | ||
| 4-550.0f | 12 36 46.20 | 62 11 41.2 | 22.18 | 1.013 | Spiral | ||
| 4-656.0 | 12 36 42.91 | 62 12 16.2 | 21.27 | 0.454 | Spiral | ||
| 4-744.0 | 12 36 43.80 | 62 11 42.8 | 22.40 | 0.765 | Elliptical | ||
| 4-795.0 | 12 36 41.94 | 62 12 05.4 | 21.52 | 0.432 | Spiral |
![[Uncaptioned image]](/html/astro-ph/0102411/assets/x2.png)
![[Uncaptioned image]](/html/astro-ph/0102411/assets/x3.png)


![[Uncaptioned image]](/html/astro-ph/0102411/assets/x15.png)
![[Uncaptioned image]](/html/astro-ph/0102411/assets/x16.png)