Broad Absorption Line Quasars In The Sloan Digital Sky Survey With VLA-FIRST Radio Detections
Abstract
We present 13 Broad Absorption Line (BAL) quasars, including 12 new objects, which were identified in the Sloan Digital Sky Survey (SDSS) and matched within to sources in the FIRST radio survey catalog. The surface density of this sample of radio-detected BAL quasars is per deg2, i.e. approximately 4 times larger than previously found by the shallower FIRST Bright Quasar Survey (FBQS). A majority of these radio-detected BAL quasars are moderately radio-loud objects. The fraction of BAL quasars in the entire radio quasar sample, , is comparable to the fraction of BAL quasars among the SDSS optical quasar sample (ignoring selection effects). We estimate that the true fraction of BAL quasars (mostly HiBALs) in the radio sample is once selection effects are accounted for. We caution that the absorption troughs of 4 of the 13 radio-detected quasars considered do not strictly satisfy the standard BALnicity criterion. One or possibly two of the new radio-detected BAL quasars are of the rare “iron LoBAL” type. BAL quasars are generally redder than the median SDSS quasar at the same redshift.
Subject headings:
quasars: general, absorption lines – galaxies: active – radio continuum: general – catalogs – surveys1. Introduction
The spectra of Broad Absorption Line (BAL) quasars show broad, blueshifted absorption troughs corresponding to highly-ionized restframe-UV transitions such as C iv, Si iv, N v, O vi, more rarely Mg ii and Al iii and even more rarely Fe ii (e.g. Hazard et al. 1987; Weymann et al. 1991; Becker et al. 1997). The similarity of the continuum and line emission of BAL and non-BAL quasars motivates the hypothesis that BAL quasars are not intrinsically different from other quasars. The presence of BAL features in the spectra of only of optically-selected quasars could naturally be explained by a difference in viewing angle if the subrelativistic outflow at the origin of the BAL features is not isotropic (Weymann et al. 1991). The popular notion that the outflow is preferentially located in the plane of the disk surrounding the supermassive black hole has found support in spectro-polarimetric measurements for BAL quasars (e.g. Goodrich & Miller 1995; Cohen et al. 1995; see, e.g., Murray et al. 1995 for a theoretical wind model).
This geometrical interpretation of BAL features suggests the possible existence of links between the BAL characteristics of a quasar and its radio properties (such as jet orientation, radio spectral index or even radio-loudness). Along those lines, Stocke et al. (1992) found that their sample of optically-selected BAL quasars revealed only radio-quiet sources, while BAL quasars were strikingly absent from a sample of radio-loud objects. The authors proposed that the BAL phenomenon is simply anticorrelated with the mechanism giving rise to strong radio emission in quasars; they also noted the tendency for radio-loud quasars at the high-end of the radio-loudness distribution to lack high-velocity BALs (see also Weymann et al. 1991). Other interpretations of the BAL phenomenon have been presented, such as the evolutionary scenario of Briggs, Turnshek & Wolfe (1984; see also Gregg et al. 2000) in which BAL quasars later become radio-loud objects.
The mJy flux-limited VLA-FIRST survey (Becker, White & Helfand 1995) has challenged many of the standard views concerning radio quasars and the BAL phenomenon. In the FIRST Bright Quasar Survey (FBQS; Gregg et al. 1996; White et al. 2000), FIRST sources with point-source optical counterparts brighter than 17.8 in the APM catalog POSS-I plates were systematically targeted for spectroscopic identification. The FBQS, besides challenging the existence of a clear radio-dichotomy for quasars (White et al. 2000), has established beyond doubt the existence of a population of radio-loud BAL quasars (Becker et al. 2000; see also Hazard et al. 1987; Becker et al. 1997, Brotherton et al. 1998; Wills, Brandt & Laor 1999). Furthermore, the population of radio-detected BAL quasars identified by the FBQS was found to exhibit a diversity of radio spectral indices (both steep and flat spectra) which may not support an interpretation of BAL quasars as preferentially edge-on oriented systems (Becker et al. 2000; see also Gregg et al. 2000).
In this paper, we describe preliminary results for BAL quasars spectroscopically identified by the Sloan Digital Sky Survey (SDSS) and matched within to radio counterparts in the FIRST survey catalog. These results are part of a more ambitious project aimed at studying all SDSS sources with FIRST radio detections (see Ivezić et al. 2001; Knapp et al. 2001). Our main result is that, at the greater depth probed by SDSS in the optical, the surface density of radio-detected BAL quasars is times larger than previously reported by the FBQS, with a majority of moderately radio-loud objects.
In §2, we describe how SDSS and FIRST sources were selected to be part of the sample of BAL quasars discussed. The sample and some of its characteristics are described in §3, while results concerning the optical (SDSS photometric) properties are emphasized in §4. We conclude in §5.
2. Target Selection
2.1. SDSS Photometric and Spectroscopic Systems
The Sloan Digital Sky Survey (SDSS; York et al. 2000) uses a camera with an array of CCDs (Gunn et al. 1998) on a dedicated 2.5-m telescope (Siegmund et al. 2001) at Apache Point Observatory, New Mexico, to obtain images in five broad optical bands over 10,000 deg2 of the high Galactic latitude sky () centered approximately on the North Galactic Pole. The five filters (designated , , , , and ) cover the entire wavelength range of the CCD response, longward of the atmospheric cutoff at short wavelengths (Fukugita et al. 1996). Photometric calibration is provided by simultaneous observations with a 20-inch telescope at the same site. The survey data processing software measures the properties of each detected object in the imaging data, and determines and applies astrometric and photometric calibrations (Pier et al. 2001; Lupton et al. 2001).111SDSS nomenclature: the names for sources have the format SDSSp Jhhmmss.ss+ddmmss.s, where the coordinate equinox is J2000, and the “p” refers to preliminary. The reported magnitudes are asinh magnitudes (Lupton, Gunn & Szalay 1999) and are based on a preliminary photometric calibration; to indicate this the filters have an asterisk instead of a prime superscript. The estimated current astrometric accuracies in each coordinate are 0.1′′ and the calibration of the photometric measurements are currently accurate to 0.02–0.05 magnitudes.
Based on their optical morphology and colors, a subset of the sources discovered in the imaging survey is selected for spectroscopic follow-up. The spectroscopic survey uses two fiber–fed double spectrographs designed to cover the wavelength range 3800–9200 Å. The SDSS spectrographs achieve a spectral resolution of 1800 across the entire spectral range. Each spectrograph accepts 320 fibers, each of which subtends a diameter of 3 on the sky. Exposures are typically minutes long. Details concerning the SDSS spectroscopic system are given by Uomoto et al. (2001) and Frieman et al. (2001).
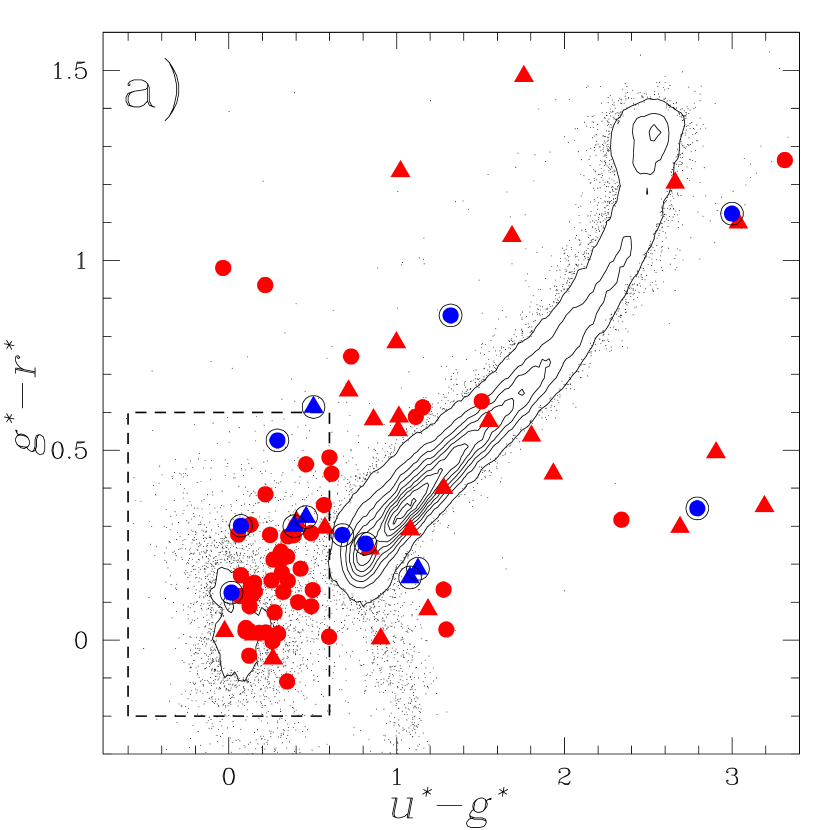
Quasar candidates are selected from their point-source optical morphology222At low redshift, this morphology cut is not enforced so that extended AGN are included in the spectroscopic sample as well (Richards et al. 2001b). and optical colors such that they lie outside the stellar locus in color-color space (blue colors for quasars – see box in Fig. 2a – and red colors for quasars; Fan 1999; Fan et al. 1999). In addition, point sources with radio counterparts within in the FIRST catalog are favored candidates for spectroscopy (because there is very little stellar contamination in radio matches, independent of the optical colors; Helfand et al. 1999; Ivezić et al. 2001; Knapp et al. 2001). The quasar selection criteria used for this sample was not constant throughout the period of observations; however, all otherwise good quasar candidates with reddening corrected magnitudes brighter than were flagged as spectroscopic targets. In addition, other quasar candidates (mostly high-redshift candidates) were selected as faint as . Radio-detected quasar candidates were selected to the brighter of these limits, unless they were also high-redshift candidates (see Richards et al. 2001b for a detailed account on the selection for spectroscopic follow-up).
2.2. Matching to the VLA-FIRST Survey Catalog
The identification in the FIRST catalog of several hundreds of radio counterparts to SDSS optical sources shows that there is very little contamination by spurious associations at angular separations (Ivezić et al. 2001). The FIRST catalog provides both peak and integrated 1.4 GHz flux densities down to 1 mJy (corresponding to a detection). The source radio morphology can be studied from the FIRST survey images.333FIRST website: http://sundog.stsci.edu For comparison, the flux limit for the radio sample of Stocke et al. (1992) is typically 0.2-0.3 mJy.
3. Results
3.1. The Sample of Quasars
We report on results concerning 60 SDSS spectroscopic plates, covering a total sky area of deg2. The total area was calculated by summing the areas corresponding to individual spectroscopic plates and by taking into account the overlaps between the plates. The completeness of the radio sample is expected to be nearly because only spectroscopic plates corresponding to regions covered by the VLA-FIRST survey were considered. Overall, a total of 2326 targets were spectroscopically identified as quasars (see Vanden Berk et al. 2001 for definition; see also Richards et al. 2001a), 96 of which show BAL features as determined by visual inspection. A subset of 272 quasars have reliable FIRST detections (i.e. radio counterparts within ), while 13 of the 96 BAL quasars do.444In what follows, we refer to objects without a FIRST radio detection as “radio-undetected” and objects with a FIRST radio detection as “radio-detected”. The focus of this paper is on these 13 radio-detected BAL objects, whose properties are listed in Table 1: J2000 coordinates, SDSS optical magnitudes , , , , (reddening-corrected), peak radio flux in the FIRST catalog, BALnicity index (see definition below), maximum outflow velocity , a representative absolute magnitude, , radio-loudness (k-corrected ratio of radio to optical fluxes), 1.4 GHz specific radio luminosity (in erg-1 s-1 Hz-1), redshift and BAL classification.
The absolute magnitudes and specific radio luminosities were calculated assuming the following cosmology: , () and km s-1 Mpc-1. The ”BALnicity” index is a measure of the strength of an absorption trough, similar to an equivalent width, but requiring continuous absorption of at least 10% in depth and spanning at least km s-1, and excluding the region within km s-1 of the quasar emission redshift (Weymann et al. 1991). C iv is used in all cases for which it is accessible and Mg ii is used otherwise. The quantity ”” is the maximum outflow velocity of the absorption lines, relative to the quasar emission redshift. We only list peak flux densities because of their close agreement with the integrated values for all the sources, as expected for radio point sources. The compact radio morphology of the 13 BAL quasars listed was confirmed by inspecting the FIRST survey images for each object.
A NASA/IPAC Extragalactic Database (NED) search reveals that one of the objects (SDSSp J115944.81+011207.1) can be identified with PKS J1159+0112, that another one (SDSSp J003923.20-001452.7) was detected as a radio source in the NVSS survey (with a compact radio morphology and a peak flux density consistent with the FIRST values) and that none of the objects listed has a counterpart in the IRAS survey catalog. No counterparts were found in the ROSAT All Sky Survey or 2MASS catalogs either (only 8 of the 13 listed objects are located in the sky region covered by the 2MASS Second Incremental Data Release555Available at http://www.ipac.caltech.edu/2mass/releases/second/index.html).
Following Becker et al. (2000), we do not limit our BAL sample to the conservative definition of Weymann et al. (1991), which explains why four of the objects listed have a zero BALnicity index (i.e. if an absorption feature satisfied all the criteria of Weymann et al. except being beyond km s-1 of the quasar emission redshift, the object was still considered as a potential BAL quasar). The justifications given by Becker et al. (2000) for including objects which do not strictly satisfy the BALnicity criterion are as follows: (i) nearly black absorption spanning 4000 km s-1, which is unlikely to break up into narrow lines, (ii) several absorption systems with a large value; none in excess of 2000 km s-1, but taken together they are suggestive of an intrinsic BAL outflow, (iii) evidence for partial covering, which is a property of BAL quasars and (iv) low-ionization lines in BAL quasars tend to be narrower than high-ionization lines (Voit, Weymann & Korista 1993), so that any BALnicity index which had to be calculated from low-ionization lines (because high-ionization lines could not be observed) are likely to be a lower limit. These same criteria motivate us to include four objects with a zero BALnicity index in our sample of radio-detected BAL quasars. SDSSp J003923.20-001452.7 has a measured BALnicity index , but rounded down to 0; it satisfies criterion (i) and maybe criterion (iii). SDSSp J235702.55-004824.0 satisfies criterion (i) and maybe criterion (ii). SDSSp J115944.81+011207.1 satisfies criterion (i) except for km s-1; it satisfies criterion (ii): there is an additional broad absorption system at km s-1; it also appears to satisfy criterion (iii): the C absorption trough is nearly flat-bottomed with a residual flux indicating partial coverage. SDSSp J133903.41-004241.2 is the least convincing of its category; Mg absorption is black with km s-1 , but the noisy C part of the spectrum may allow it to satisfy criterion (iv).
The radio-loudness is calculated as the k-corrected ratio of the 5 GHz radio flux to the 2500 optical flux (which is calculated from the B-band magnitude), following the definition of Stocke et al. (1992). We adopt the photometric transformation which is appropriate for the power-law spectra of quasars (see, e.g., Schmidt, Schneider & Gunn 1995) and we assume a power-law index (with ) in the radio (the same value of the radio power-law index was assumed for the k-correction when calculating ). A power-law index was assumed when calculating the absolute magnitudes (see Vanden Berk et al. 2001 for a measure of from an SDSS quasar composite spectrum; see also Richards et al. 2001a).
The redshifts were determined automatically by the SDSS spectroscopic pipeline and modified as necessary upon visual inspection (BAL quasar redshifts prove difficult to measure automatically with precision but the modifications were generally not more than a few hundredths of a unit redshift). The BAL classification refers to the ionization states seen in absorption: HiBALs are defined as those exhibiting absorption only by high-ionization ions, LoBALs show both high- and low-ionization lines, and FeLoBALs are LoBALs with lines from meta-stable Fe ii and Fe iii. Examples of specific lines are Mg ii for LoBAL (as well as, e.g., lines of Al ii, Al iii, Si ii, and C ii), C iv for HiBAL, and Fe ii and Fe iii for FeLoBAL (Hazard et al. 1987). Of course, all the lines cannot be seen for all the quasars because of the finite spectral coverage in the observer frame.
We note that one or possibly two of the 13 radio-detected BAL quasars reported here are of the rare FeLoBAL type, of which the FBQS has found only four examples (Becker et al. 2000) and only one other has been reported (Hazard et al. 1987). Five of the six known FeLoBALs have radio detections, which supports the speculation by Becker et al. (1997) that these quasars are associated with rather strong radio emission. We note, however, that the number of FeLoBALs in the radio-undetected sample is presently unknown and that these results still concern a small number of sources. The spectra of the 13 radio-detected BAL quasars listed in Table 1 are shown in Figure 1.
3.2. General Properties
Despite the small size of this sample of radio-detected BAL quasars, some interesting conclusions can be drawn. The surface density of radio-detected BAL quasars at the depth probed by SDSS is objects per 100 deg2, which is approximately times larger than reported by the FBQS (with the same definition for the BAL sample; Becker et al. 2000). This is expected given that the SDSS goes deeper than the limiting magnitude of 17.9 for the FBQS. Adopting a dividing line between radio-quiet and radio-loud objects at (following Stocke et al. 1992), we see that most of the objects identified by SDSS and found in the FIRST catalog are of a moderately radio-loud () to strongly radio-loud () nature. This is the result of the greater depth probed by SDSS in the optical (as compared to the APM digitized POSS-I catalog used for the FBQS), which, given the mJy flux limit of the FIRST survey, tends to uncover objects which are more radio-loud than previously known. The specific radio luminosity alone is also sometimes used as a direct measure of the radio-loudness of quasars. Adopting a dividing line between radio-quiet and radio-loud objects at erg-1 s-1 Hz-1 (following Gregg et al. 1996 and Stern et al. 2000), we see again that a majority of the objects listed in Table 1 are on the radio-loud side.666Note that a FIRST source with a 1 mJy flux (the survey limit) must be at a redshift larger than or so to automatically satisfy the above luminosity-based radio-loudness criterion. Although two of our objects have , both of them have flux densities four times brighter than the FIRST survey limit. A more conservative cut at erg-1 s-1 Hz-1 still results in 7 out of the 13 objects being on the radio-loud side. Thus, we find no evidence of the anticorrelation of the radio-loud emission mechanism with the BAL phenomenon which was found by Stocke et al. (1992). The trend of moderate radio-loudness in our sample of radio-detected BAL quasars may, however, be consistent with the tendency found by Stocke et al. (1992; see also Weymann et al. 1991) for strongly radio-loud quasars to lack high-velocity BALs.
One must temper the conclusion of this analysis, however, by a few words of caution. In particular, we note that the BALnicity distribution of the radio-detected BAL quasars listed in Table 1 appears different (at a level) from that of the sample of radio-quiet BAL quasars of Weymann et al. (1991). While of our BAL quasars have a BALnicity index km s-1, of the BAL quasars discussed by Weymann et al. (1991) do. These authors warn that quasars with a BALnicity index km s-1 risk contamination by unusually strong “associated narrow absorbers” (as opposed to bona fide BAL features), which may be preferentially found in radio-louder objects.
While nine of our radio-detected BAL quasars have a BALnicity index km s-1, we note that those with a non-zero BALnicity index have large enough values to avoid contamination by associated narrow absorbers. The motivation for including the remaining four objects with zero BALnicity indices was given in §3.1. The overall low BALnicity of the sample is evident777We note that the absorption troughs in SDSSp J115944.81+011207.1 and SDSSp J235702.55-004824.0 could be characterized as associated absorption lines in the sense that they are contained within the corresponding broad emission line. On the other hand, FIRST sources being preferentially flat-spectrum sources, these two objects may not necessarily belong to the class of systems with associated absorption lines and usually steep radio spectra (see, e.g., Hamann et al. 2001). and it is interesting that the objects with zero BALnicity indices are among the radio-loudest ones. For this reason, we also quote radio-detected BAL fractions excluding the 4 systems with a zero BALnicity index and refer to them in what follows as “conservative values”. Interestingly, only of the radio-detected BAL quasars found by the FBQS have a BALnicity index km s-1, in agreement with our results. The discrepancy with the Weymann et al. sample may therefore indicate a real difference between the populations of radio-quiet and radio-loud BAL quasars. We also note that the redshift distribution of our radio-detected BAL quasars appears different from that of the FBQS radio BAL quasars: none of our objects is found below , while 11 of the 29 FBQS objects are in this low redshift range.
Our results concerning various interesting fractions for the quasar sample are summarized in Table 2. In the total SDSS quasar sample, of all spectroscopically identified quasars have radio detections in the FIRST survey, in agreement with a fraction for the BAL subsample only. The fraction of BAL quasars in the entire SDSS quasar sample is , which is consistent with the fraction (conservative value: ) of BAL quasars in the subsample of sources with radio detection. These values suggest that BAL quasars are not preferentially found among radio-detected quasars (in contradiction to Becker et al. 2000 for the FBQS), but are found in equal number among sources with and without a FIRST radio detection. This apparent discrepancy may be explained by the necessity for Becker et al. (2000) to compare their BAL quasar fraction (after correction for the selection effects) to those obtained in independent optical surveys. The combination of SDSS optical data and FIRST radio data should provide a more robust estimate for the radio-detected and radio-undetected BAL fractions; a larger number of sources is required to settle this issue with confidence.
The fractions of BAL quasars quoted above do not take into account the strong selection effects which affect the identification of BAL quasars (the restframe-UV absorption features must be conveniently located in the optical spectral range observed). Accounting for these selection effects is usually done by assuming that there is no significant redshift dependence of the BAL quasar fraction. Under this assumption, we calculate the corrected fraction as the ratio of the number of BAL quasars to the total number of quasars in the redshift range such that the detection of a specific restframe-UV absorption line is guaranteed given the SDSS spectral coverage (see, e.g., Becker et al. 2000 for a similar procedure for the FBQS).
The redshift range relevant to LoBAL quasars is based on Mg ii absorption. However, we find that Al iii absorption is present in nearly all the spectra showing Mg ii absorption. This effectively pushes the maximum detection redshift for LoBALs to . This situation illustrates how the uniform signal to noise and extended spectral coverage of the SDSS will allow to define more sophisticated BAL fractions (based on several specific lines) which should be less subject to selection effects than usual. A total of 249 radio-detected quasars, including 7 LoBAL quasars, are found in the redshift range (based on both Mg ii and Al iii absorption), so that the corrected LoBAL fraction is (conservative value: ) in the sample of radio-detected objects.
The redshift range relevant to HiBAL quasars is , so that C iv absorption would be seen if present. A total of 141 radio-detected quasars, including 13 HiBAL quasars (all the quasars listed in Table 1 show high-ionization BAL features), are found in this redshift range, so that the corrected HiBAL fraction is (conservative value: ) in the sample of radio-detected objects. For the FBQS, Becker et al. (2000) find a corrected LoBAL fraction of , which is consistent with the above, but a corrected HiBAL fraction of , which is significantly higher than the HiBAL fraction of the present radio sample. We note that the HiBAL fraction in optical samples such as the LBQS is consistent with the quoted here (e.g. Foltz et al. 1990). The same exercise for the radio-undetected BAL quasars requires a careful BAL classification for these objects, which is beyond the scope of this preliminary communication.
3.3. Optical Properties
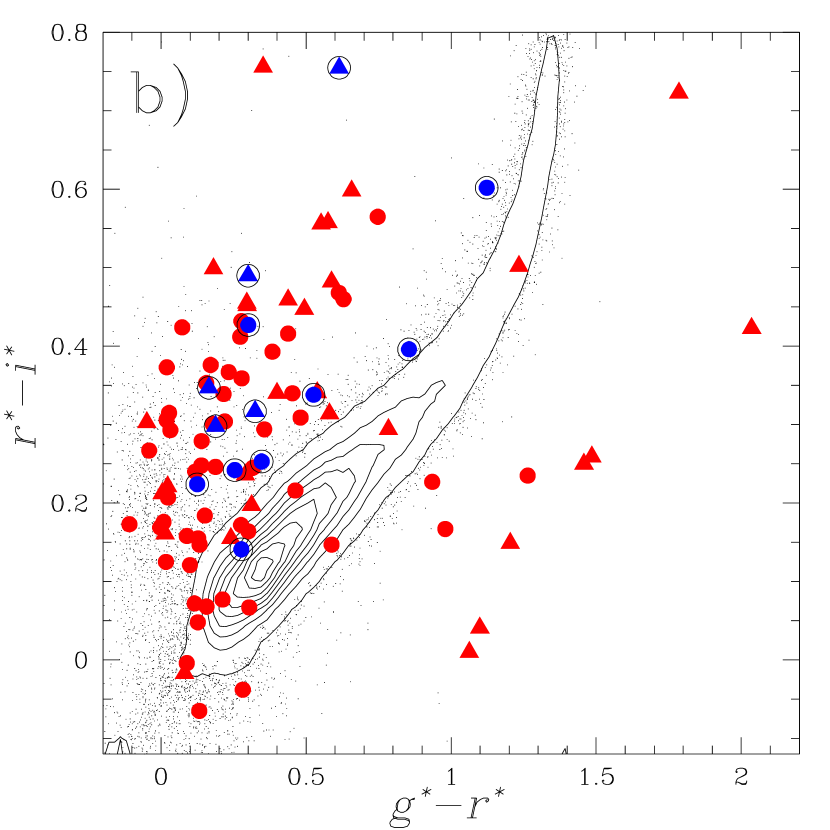
The optical properties of the sample of radio-detected BAL quasars are further described in Figures 2 and 3, where similar properties for the sample of radio-undetected BAL quasars are also shown. Fig 2a and 2b illustrate how most of the 96 BAL quasars were selected for spectroscopy, based on their location in the (, , ) SDSS color space. In one color plane or the other, most BAL quasars lie outside the stellar locus, indicated by contours and small dots (for individual objects) for an SDSS control sample of point sources, almost all of which are stars. The photometric quality of the control sample was guaranteed by applying the following cuts: and corresponding photometric errors . The BAL quasars only fill the red side of the low-z quasar box (indicated by dashed lines in Fig. 2a) because of their rather large redshifts () and comparatively red colors (see below). The low- quasar box approximates the region of color-space where the majority of quasars are found. The circled objects (radio-detected BAL quasars) are evenly distributed among the BAL quasar sample in Fig. 2, showing that there is no detectable color difference between the radio-detected and radio-undetected objects.
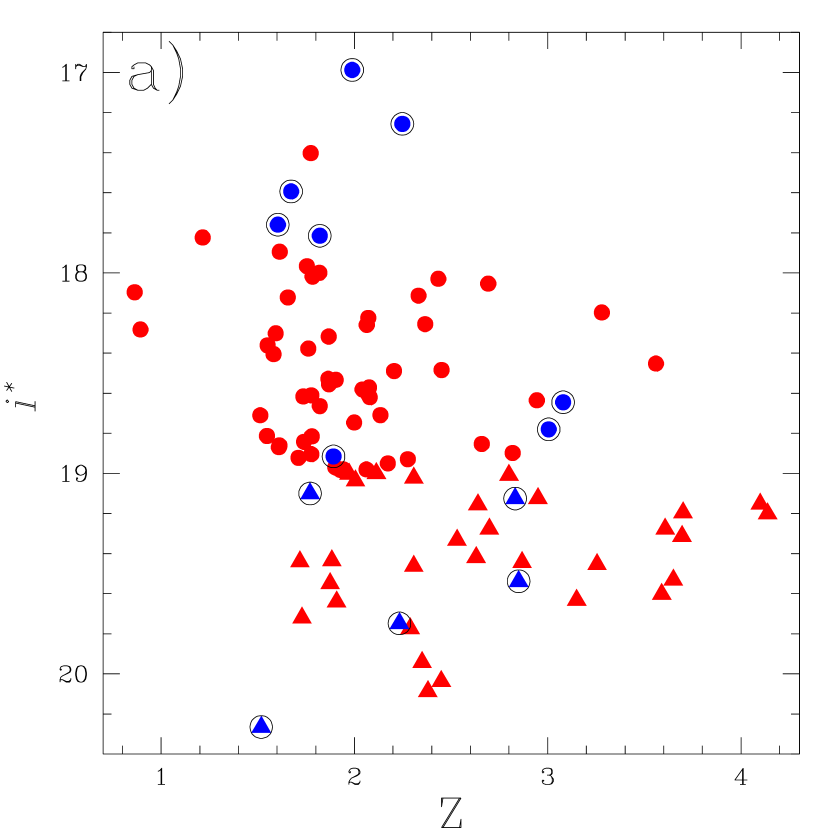
Figure 3a shows a redshift-magnitude () diagram for the BAL quasar sample, showing again no obvious trend separating the radio-detected sources from the radio-undetected ones. Since the standard photometric cut applied in SDSS for spectroscopic follow-up is at , Fig. 3a suggests that the sample of radio-detected BAL quasars is not strongly biased toward faint magnitudes (relative to the rest of the BAL sample) as could have resulted from the favored spectroscopic selection for radio-detected sources.
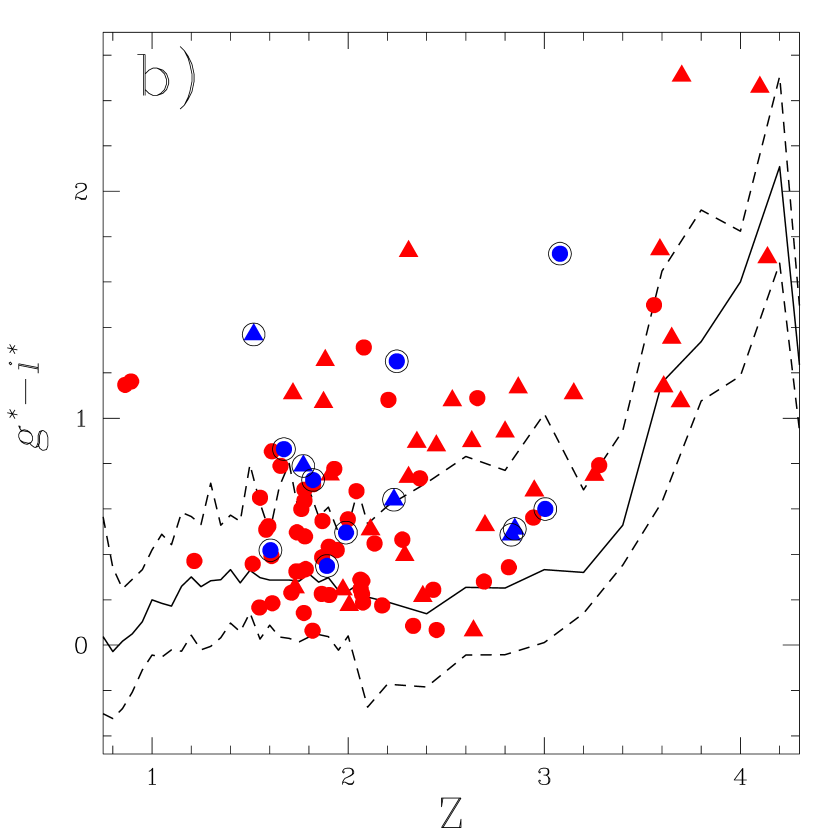
Figure 3b shows a redshift-color () diagram for the BAL quasar samples. The color was chosen so that systematics appearing when strong emission lines enter or leave photometric bands (especially the band; Richards et al. 2001a) are minimized. The relation for the median color as a function of redshift found by Richards et al. (2001a) for a nearly identical sample of 2625 spectroscopically identified quasars with SDSS colors is shown as a solid line, while the dashed lines indicate the confidence limits. The location of many BAL quasars above the median value (solid line) clearly shows that BAL quasars are redder than the typical quasars spectroscopically identified by SDSS, in agreement with previous results on the colors of BAL quasars (Sprayberry & Foltz 1992; Brotherton et al. 2000; see also Weymann et al. 1991). This red nature is interpreted as continuum extinction rather than attributed to the presence of the absorption troughs in the BAL quasar spectra (Sprayberry & Foltz 1992; Yamamoto & Vansevicius 1999). This was confirmed here for the 13 radio-detected BAL quasars by inspection of the spectra and comparison to the SDSS composite spectrum of Vanden Berk et al. (2001). We note that the red colors of BAL quasars could imply that they are strongly under-represented in magnitude-limited samples. Further work is required to address this question properly.
Since of the radio-undetected objects are below the median color, of the radio-detected BAL quasars are expected below the median value if the two populations have similar color properties. One cannot conclude, however, from the absence of any radio-detected BAL quasar below the solid line that they are redder than radio-undetected BAL quasars because the samples are too small at this point to draw statistically significant conclusions. Interestingly, Richards et al. (2001a) found that many of the reddest quasars in their sample have FIRST radio detections.
4. Conclusion
We described the properties of 13 BAL quasars spectroscopically identified by the SDSS which possess radio counterparts in the VLA-FIRST survey catalog. This sample, from an area of deg2, is the second largest sample of radio-detected BAL quasars after that reported by the FIRST Bright Quasar Survey (Becker et al. 2000).
Despite the small statistical size of this sample, we were able to isolate some of its important characteristics. Because of the SDSS limiting magnitude of for our sample, compared to for the FIRST Bright Quasar Survey, we find a density of radio-detected BAL quasars of objects per deg2, i.e. four times larger than in the FIRST Bright Quasar Survey. A majority of the newly identified radio-detected BAL quasars are moderately radio-loud objects, in contradiction with early claims of an anti-correlation between the radio-loud emission mechanism and the BAL phenomenon. The preference for moderate radio-loudness in our sample may indicate that strongly radio-loud quasars tend to lack high velocity BALs.
Upon completion, the combination of the full set of SDSS data with the FIRST catalog should provide us with several hundreds of radio-detected BAL quasars, allowing a robust characterization of the properties of this population of rare objects.
Acknowledgments
The Sloan Digital Sky Survey (SDSS) is a joint project of The University of Chicago, Fermilab, the Institute for Advanced Study, the Japan Participation Group, The Johns Hopkins University, the Max-Planck-Institute for Astronomy, New Mexico State University, Princeton University, the United States Naval Observatory, and the University of Washington. Apache Point Observatory, site of the SDSS telescopes, is operated by the Astrophysical Research Consortium (ARC). Funding for the project has been provided by the Alfred P. Sloan Foundation, the SDSS member institutions, the National Aeronautics and Space Administration, the National Science Foundation, the U.S. Department of Energy, Monbusho, and the Max Planck Society. The SDSS Web site is http://www.sdss.org/.
This research has made use of the NASA/IPAC Extragalactic Database (NED) which is operated by the Jet Propulsion Laboratory, California Institute of Technology, under contract with the National Aeronautics and Space Administration.
We are grateful to M. Strauss for useful discussions, R. Becker for comments on the manuscript and the referee for a very useful report. Support for this work was provided by NASA through Chandra Postdoctoral Fellowship grant number PF9-10006 awarded (to KM) by the Chandra X-ray Center, which is operated by the Smithsonian Astrophysical Observatory for NASA under contract NAS8-39073. GRK and IS acknowledge support from NASA grant NAG-3364. DPS and GTR acknowledge support from NSF grant AST99-00703.
References
- (1) Becker, R.H., Gregg, M.D., Hook, I.M., McMahon, R.G., White, R.L. & Helfand, D.J., 1997, ApJ, 479, L93
- (2) Becker, R.H., White, R.L. & Helfand, D.J., 1995, ApJ, 450, 559
- (3) Becker, R.H. et al., 2000, ApJ 538, 72
- (4) Briggs, F.H., Turnshek, D.A. & Wolfe, A.M., 1984, ApJ, 287, 549
- (5) Brotherton, M.S., et al., 1998, ApJ, 505, L7
- (6) Brotherton, M.S., Tran, H.D., Becker, R.H., Gregg, M.D., Laurent-Muehleisen, S.A. & White, R.L., 2000, ApJ, in press, astroph/0008396
- (7) Cohen, M.H. et al., 1995, ApJ, 448, L77
- (8) Fan, X., 1999, AJ, 117, 2528
- (9) Fan, X. et al. 1999, AJ, 118, 1
- (10) Foltz, C., Chaffee, F., Hewett, P., Weymann, R. & Morris, S. 1990, BAAS, 21, 806
- (11) Frieman, J.A. et al., 2001, in preparation
- (12) Fukugita, M., Ichikawa, T., Gunn, J.E., Doi, M., Shimasaku, K., & Schneider, D.P. 1996, AJ, 111, 1748
- (13) Goodrich, R.W. & Miller, J.S., 1995, ApJ, 448, L73
- (14) Gregg, M.D., Becker, R.H., White, R.L., Helfand, D.J., McMahon, R.G. & Hook, I.M., 1996, AJ, 112, 407
- (15) Gregg, M.D., Becker, R.H., Brotherton, M.S., Laurent-Muehleisen, S.A., Lacy, M. & White, R.L., 2000, ApJ, 544, 142
- (16) Gunn, J.E., et al. 1998, AJ, 116, 3040
- (17) Hamann, F.W., Barlow, T.A., Chaffee, F.C., Foltz, C.B. & Weymann, R.J., 2001, ApJ in press, astroph/0011030
- (18) Hazard, C., McMahon, R.G., Webb, J.K. & Morton, D.C., 1987, ApJ, 323, 263
- (19) Helfand, D.J., Schnee, S., Becker, R.H., White, R.L. & McMahon, R.G., 1999, ApJ, 117, 1568
- (20) Ivezić, Ž, et al., 2001, in preparation
- (21) Knapp, G., et al., 2001, in preparation
- (22) Lupton, R.H., et al. 2001, in preparation
- (23) Lupton, R.H., Gunn, J.E. & Szalay, A.S. 1999, AJ, 118, 1406
- (24) Murray, N., Chiang, J., Grossman, S.A. & Voit, G.M., 1995, ApJ, 451, 498
- (25) Pier, J.R., et al. 2001, in preparation
- (26) Richards, G.T. et al., 2001a, AJ, in press, astroph/0012449
- (27) Richards, G.T. et al., 2001b, in preparation
- (28) Schmidt, M., Schneider, D.P. & Gunn, J.E., 1995, AJ, 110, 68
- (29) Siegmund, W., et al. 2001, in preparation
- (30) Sprayberry, D. & Foltz, C.B., 1992, ApJ, 390, 39
- (31) Stern, D., Djorgovski, S.G., Perley, R.A., de Carvalho, R.R. & Wall, J.V., 2000, AJ, 119, 1526
- (32) Stocke, J.T., Morris, S.L., Weymann, R.J. & Foltz, C.B., 1992, ApJ, 396, 487
- (33) Uomoto, A. et al., 2001, in preparation
- (34) Vanden Berk, D.E. et al., 2001, AJ, in press, astroph/0105231
- (35) Voit, G.M., Weymann, R.J. & Korista, K.T., 1993, ApJ, 413, 95
- (36) Weymann, R.J., Morris, S.L., Foltz, C.B. & Hewett, P.C., 1991, ApJ, 373, 23
- (37) Wills, B.J., Brandt, W.N. & Laor, A., 1999, ApJ, 520, L91
- (38) Yamamoto, T.M. & Vansevicius, V., 1999, PASJ, 51, 405
- (39) York, D.G. et al 2000, AJ, 120, 1579
| RA (J2000) | Dec (J2000) | BALnicityaaThe BALnicity values have been rounded to the nearest km s-1 and the values to the nearest km s-1 to reflect the estimated precision. The estimated uncertainties in the redshift measurements (based on MgII if available or CIII] otherwise) are for all the objects, except SDSSp J132139.86-004152.0 for which the redshift measurement is accurate only to 0.02. | aaThe BALnicity values have been rounded to the nearest km s-1 and the values to the nearest km s-1 to reflect the estimated precision. The estimated uncertainties in the redshift measurements (based on MgII if available or CIII] otherwise) are for all the objects, except SDSSp J132139.86-004152.0 for which the redshift measurement is accurate only to 0.02. | zaaThe BALnicity values have been rounded to the nearest km s-1 and the values to the nearest km s-1 to reflect the estimated precision. The estimated uncertainties in the redshift measurements (based on MgII if available or CIII] otherwise) are for all the objects, except SDSSp J132139.86-004152.0 for which the redshift measurement is accurate only to 0.02. | BAL | |||||||||
|---|---|---|---|---|---|---|---|---|---|---|---|---|---|---|
| (mJy) | (km s-1) | (km s-1) | Type | |||||||||||
| (1) | (2) | (3) | (4) | (5) | (6) | (7) | (8) | (9) | (10) | (11) | (12) | (13) | (14) | (15) |
| 00 39 23.20 | 00 14 52.7 | 20.85 | 20.39 | 20.07 | 19.75 | 19.41 | 21.2 | 0 | 5100 | 25.15 | 419.3 | 33.62 | 2.233 | HibbNED: NVSS source J003923-001452; possibly MgII BAL. Measured BALnicity is 0 (rounded here), but value is consistent with 0 given spectral resolution and flux density errors. |
| 03 05 43.45 | 01 06 22.1 | 21.13 | 20.05 | 19.89 | 19.54 | 19.55 | 5.2 | 400 | 12150 | 25.99 | 69.4 | 33.21 | 2.850 | Hi |
| 11 54 04.14 | 00 14 19.5 | 18.85 | 18.18 | 17.9 | 17.76 | 17.73 | 1.5 | 4100 | 16200 | 26.68 | 4.2 | 32.18 | 1.604 | Lo |
| 11 59 44.81 | 01 12 07.1 | 18.30 | 17.48 | 17.23 | 16.99 | 16.72 | 266.5 | 0 | 3000 | 27.82 | 377.4 | 34.63 | 1.989 | HiccNED: identified with PKS J1159+0112; possibly MgII BAL; km s-1. |
| 13 02 08.27 | 00 37 31.6 | 18.75 | 18.46 | 17.93 | 17.59 | 17.57 | 11.2 | 1200 | 10050 | 26.48 | 41.3 | 33.11 | 1.672 | Lo |
| 13 21 39.86 | 00 41 52.0 | 23.37 | 20.37 | 19.25 | 18.65 | 18.41 | 4.1 | 3500 | 12150 | 25.83 | 70.4 | 33.17 | 3.080 | FeLo |
| 13 23 04.58 | 00 38 56.7 | 18.61 | 18.54 | 18.24 | 17.81 | 17.77 | 8.9 | 300 | 9600 | 26.58 | 34.6 | 33.08 | 1.821 | Hi |
| 13 31 50.52 | 00 45 18.8 | 19.28 | 19.26 | 19.14 | 18.91 | 18.9 | 2.9 | 1300 | 12900 | 25.94 | 21.9 | 32.63 | 1.892 | Hi |
| 13 39 03.41 | 00 42 41.2 | 22.14 | 21.63 | 21.02 | 20.27 | 20.01 | 2.0 | 0 | 1650 | 23.11 | 142.6 | 32.28 | 1.518 | Lo ddused MgII BAL; km s-1. |
| 14 01 12.01 | 01 11 12.3 | 20.28 | 19.89 | 19.59 | 19.10 | 19.02 | 3.1 | 1500 | 10350 | 25.17 | 41.6 | 32.59 | 1.771 | Lo |
| 15 16 36.78 | 00 29 40.5 | 19.83 | 18.51 | 17.65 | 17.26 | 17.12 | 2.2 | 6700 | 25000 | 27.05 | 7.6 | 32.64 | 2.248 | FeLo? |
| 16 04 12.39 | 00 08 07.9 | 20.74 | 19.61 | 19.42 | 19.12 | 18.99 | 1.4 | 600 | 7200 | 26.42 | 12.6 | 32.64 | 2.832 | Hi |
| 23 57 02.55 | 00 48 24.0 | 22.17 | 19.38 | 19.03 | 18.78 | 18.53 | 4.0 | 0 | 4050 | 26.77 | 28.4 | 33.15 | 3.005 | Lo ee km s-1. |
| Sub-sample | Fraction |
|---|---|
| Quasars with Radio Detection: | |
| BAL Quasars with Radio Detection: | |
| Quasars with BAL Features (uncorrected): | |
| Radio Quasars with BAL Features (uncorrected): | ()aaThe fraction in parenthesis corresponds to the value obtained when a conservative BAL definition is adopted (see text). |
| Radio Quasars with LoBAL Features (corrected): | ()aaThe fraction in parenthesis corresponds to the value obtained when a conservative BAL definition is adopted (see text). |
| Radio Quasars with HiBAL Features (corrected): | ()aaThe fraction in parenthesis corresponds to the value obtained when a conservative BAL definition is adopted (see text). |