Constraints on the nuclear emission of the Circinus galaxy: the torus
Abstract
In the context of the unified model of Seyfert galaxies, we use observations from the literature and a radiative transfer model to investigate the near–IR to mm emission produced by the presumed torus in the Circinus galaxy, from 2m to 1.3mm. From the infrared SED modelling, we find that the total luminosity (LIR) in this wavelength range, consists of similar contributions from the torus and starburst with a ratio of nuclear luminosity to starburst luminosity (LNUC/LSB) 0.8.
By using a similar torus model to that of NGC1068, but without the conical dust, we find an upper limit to the outer torus radius of 12pc with a best fit of 2pc. The upper limit torus size estimated from the radiative transfer modelling is consistent with the 16pc torus radius estimated from near–IR imaging polarimetry of Circinus.
keywords:
galaxies: individual: Circinus - galaxies: nuclei - galaxies: active - infrared: galaxies - radiative transfer1 Introduction
Observational evidence for obscuring material in the centres of Active Galactic Nuclei (AGN) is now abundant. Obscuration is observed in the form of molecules and dust, present in the centres of these galaxies on scales that vary from a fraction of a parsec to tens and even hundreds of parsecs (Malkan \etal1998; Gallimore; Siebenmorgen \etal1997; Greenhill \etal1996). It is believed that the obscuring material takes the form of a dusty “torus” which blocks and absorbs part of the radiation from the active nucleus. These dusty tori play an essential role in unified theories of Seyfert galaxies and strongly support the unification models.
The unified model for Seyfert galaxies proposes that all types of Seyfert galaxy are fundamentally the same, but, the presence of the dusty torus obscures the nucleus, including the broad line emission region in many systems. In this picture the classification of Seyfert 1 or 2 depends on the inclination angle of the torus to our line of sight (e.g. Antonucci and Miller 1985; Antonucci 1993). Strong support for this model has come from X–ray observations, showing that Seyfert 2 galaxies are Compton thick, i.e. the nuclear radiation is absorbed by matter with column densities 1024cm-2 (Lawrence and Elvis 1982; Maiolino \etal1998a).
Direct imaging of the presumed torus is technically demanding due to its (predicted) small size (e.g. Efstathiou, Hough and Young 1995, hereafter EHY95; Granato, Danese and Franceschini 1997; Alexander \etal1999). The most convincing direct evidence for a Seyfert torus comes from observations of the HCN molecule (Jackson \etal1993), which traces dense molecular gas, and near–IR imaging polarimetry (Young \etal1996), both of NGC1068. These images show a large nuclear structure of 200pc in extent, approximately perpendicular to the [O iii]5007 emission cone and radio lobe emission. Indirect support for tori comes from ground–based narrow band imaging (e.g. Wilson and Tsvetanov 1994), high resolution HST imaging (e.g. Capetti \etal1997; Falcke, Wilson and Simpson 1998) and imaging–polarimetry (e.g. Ruiz \etal2000; Lumsden \etal1999; Tadhunter \etal1999; Packham \etal1997) which have shown a number of objects with nuclear cone–like structures, presumably collimated by the torus.
The origin of the infrared continuum in a number of Seyfert 2 galaxies is clearly thermal as indicated by silicate features such as the broad absorption at 10m (Roche \etal1991) and the various emission features from polycyclic aromatic hydrocarbons (PAHs), e.g. 3.3, 6.2 and 11.3m, which are normally associated with the presence of hot stars in a starburst environment. Dust grains, distributed in a toroidal geometry surrounding the central black hole and accretion disc, are believed to be responsible for the absorption of radiation from the central source and re–radiation of energy into longer wavelengths giving rise to the observed “IR bump” longwards of 1m and peaking at mid–IR wavelengths (Rowan–Robinson and Crawford 1989). The resultant radiation spectrum is dependent on the distribution of dust grain temperatures ( 2000K) and optical depth. Two additional components can add to the IR spectra of active galaxies (Rowan–Robinson and Crawford 1989): galactic diffuse emission from large dust grains heated by the interstellar radiation field in the galactic disc (cirrus, T 40K ) and a starburst component peaking at about 60m.
Thus, a radiative transfer model which takes into account dust grain features within a true toroidal configuration and starburst environment is needed to correctly reproduce the near–IR to mm SED of the Circinus galaxy.
Here, we present a model for the IR continuum emission of the Circinus galaxy which successfully fits the observations from 2m to mm wavelengths. We constrain the size and flux of the dusty AGN torus and estimate the contribution of the starburst emission to total IR emission. Section 2 presents the data compilation and sections 3 and 4 present the model and the fitting procedure. Section 5 discusses the model and its implications and conclusions are summarised in section 6.
2 The Data
| flux | beamsize | reference333References: (1) Maiolino \etal(1998b); (2) Sturm \etal(2000); (3) Moorwood and Glass (1984); (4) IRAS, Moshir \etal(1992); (5) Ghosh \etal(1992); (6) Siebenmorgen \etal(1997) | |
| (m ) | (Jy) | ||
| 2.2 444nuclear measurement | 0.022 | 0.15 arcsec | 1 |
| 3.0 | 1.1 | 1420 arcsec2 | 2 |
| 3.28555PAH feature peak | 2.0 | 1420 arcsec2 | 2 |
| 3.8b | 0.777 | 0.3 arcsec | 6 |
| 4.8b | 1.832 | 0.3 arcsec | 6 |
| 6.2c | 8.5 | 1420 arcsec2 | 2 |
| 7.7c | 20.0 | 1420 arcsec2 | 2 |
| 8.6c | 10.0 | 1420 arcsec2 | 2 |
| 10.3b | 6.32 | 1.5 arcsec | 6 |
| 11.3c | 20.0 | 1420 arcsec2 | 2 |
| 12 | 19 | 90 arcsec | 4 |
| 20 | 45 | 1420 arcsec2 | 2 |
| 30 | 100 | 1420 arcsec2 | 2 |
| 40 | 200 | 1420 arcsec2 | 2 |
| 25 | 65 | 90 arcsec | 4 |
| 60 | 280 | 90 arcsec | 4 |
| 100 | 340 | 90 arcsec | 4 |
| 1506665 upper limit | 150 | 40 arcsec | 5 |
| 1300 | 0.248 | 23 arcsec | 6 |
The continuum and PAHs data points have been compiled from a variety of sources in the literature and are presented in Table 1. The data sources will be described below. There is a large range of sizes in the observational apertures, from arcsec to arcminute beamsizes, equivalent to physical sizes of 5pc and 200pc (for Circinus, 1 arcsec corresponds to 20pc); whenever possible, data from the smallest available aperture were used to minimise the contribution from galactic disk emission.
In the near–IR, below 2m, the stellar contribution is quite significant, and to study the nuclear emission, the starlight contribution has to be subtracted from the integrated flux. The data point at 2.2m shown in Table 1 corresponds to the deconvolved non–stellar measurement as presented by Maiolino \etal(1998b) and derived from a 0.15arcsec aperture. This measure will set a limit on the size of the nuclear non–stellar source (see section 2.1).
In the mid–IR, between 3 and 20m, the continuum data points at 3.8 and 4.8m, are provided by Siebenmorgen \etal(1997) who carried out speckle interferometry in the L’(3.8m) and M(4.8m) bands with a 0.3arcsec aperture. The speckle observations are insensitive to larger scale components, e.g. starlight, and predict more directly the nuclear non–stellar contribution (see section 4). Other continuum data points over this wavelength range are from the ISO–SWS spectrum presented in Sturm \etal(2000).
Line information for the PAH features at 3.28, 6.2, 7.7, 8.6 and 11.3m were directly measured from the ISO–SWS spectrum in Sturm \etal(2000). The reported values in Table 1 correspond to the peak of these emission lines. ISO apertures are large enough (24arcsec2) to contain much of the circumnuclear star forming regions as well as the nuclear emission. The ISO spectrum shows that the region between 5 and 12m is dominated by PAH features, characteristic of star formation activity (see Fig 1), and it is remarkably similar to those of pure starburst galaxies also observed by ISOPHOT (Siebenmorgen, Krügel and Zota 1999).
The spectrum corresponding to the Si absorption feature centered at 9.7m is shown in more detail in Fig 1. It was provided by P. Roche and published by Roche \etal(1991). This spectrum was taken with the UCL spectrometer and used an aperture of 4.3arcsec. For comparison also shown in Fig 1 is the mid-IR ISO–SWS spectrum of Circinus taken with the much larger aperture of 1420arcsec2 (Sturm \etal2000).
The N(10.3m) band continuum data point, is also provided by Siebenmorgen \etal(1997) and measured through a 1.3arcsec slit. It is interesting to note that a larger aperture measurement at 10.3m by Moorwood and Glass (1984) with a 5arcsec aperture is very similar to the smaller aperture data of Siebenmorgen \etal(1997). This is a good indication of the compact nature of the central source at this wavelength. The continuum data points at 20, 30 and 40m were taken from the ISO–SWS spectrum (Sturm \etal2000). The ISO SWS spectrum at 25m agrees within 20 of the IRAS flux.
The far–IR continuum observations were collected from the IRAS large aperture observations (90arcsec) at 12, 25, 60 and 100m as reported by Moshir \etal(1992). The continuum data point at 150m was taken from the analysis by Ghosh \etal(1992) which corresponds to an aperture of 40arcsec. This measurement is only a 5 upper limit as Circinus was not detected at this wavelength.
At millimeter wavelengths, Circinus has been detected at 1.3mm with an aperture of 23arcsec as reported by Siebenmorgen \etal(1997). Maps of the millimeter continuum emission show Circinus as an unresolved source.
Clearly, the large aperture observations are contaminated with light from various emission sources particularly from the extended galactic disc; thus, special care is needed when fitting the large aperture data points to the individual emission components in the radiative transfer model (see next section).

2.1 Constraints from Observational Data
In the K band (2.2m), the source is clearly unresolved in a 0.3arcsec aperture (6pc on source). By deconvolving the nuclear K–band surface brightness radial distribution with a stellar profile and a nuclear PSF, Maiolino \etal(1998b) set a constraint on the size of the nuclear non–stellar source of 1.5pc. Similarly, at 3.8 and 4.8m the source is also observed to be unresolved at 0.7arcsec resolution and is possibly 0.3arcsec in size, putting upper limits of 6pc (Siebenmorgen \etal1997). Clearly, at wavelengths 5m most of the emission comes from a central source with a size 6pc. This size scale almost certainly corresponds to the inner radius of the proposed dusty torus, as the near–IR emission is most likely to result from hot dust grains (T1300K) heated by the intense radiation from the non–stellar central source. Thus, in our model, the near–IR data points at 5m are assumed to be totally dominated by the emission from the torus component.
Observations at 10m reveal that the central source size is possibly resolved with a size of 26pc whilst at 20m it is unresolved and 30pc in size (Siebenmorgen \etal1997). As mentioned in the previous section, the emission detected with the larger aperture of Moorwood and Glass (1984) at 10m does not seem very different from that of smaller aperture by Siebenmorgen \etal(1997). At wavelengths larger than 20m, the IR emission most likely results from a more extended region, and there is possibly a significant contribution from the inner circumnuclear starburst ( 40pc in radius).
The spatial resolution analysis at 60, 100 and 150m by Ghosh \etal(1992) reveals a deconvolved size of Circinus of 40arcsec at 50m. However, at these longer wavelengths, the resolution is too poor to put useful constraints on the size of the emitting source.
The spectrum corresponding to the Si feature at 9.7m (Fig 1) was taken with an on–source equivalent aperture of 80pc (Roche \etal1991). The detection of a number of CO stellar absorption features in a 4.46.6arcsec2 aperture gives strong evidence for circumnuclear star–formation on a region few tens of parsecs from the nucleus (Oliva \etal1994, Maiolino \etal1998b), thus, the Si feature cannot be solely modelled by dust self–absorption from the torus component, but, a starburst contribution will have to be included when fitting this feature with the SED model.
The long wavelength data points and PAH features (IRAS and ISO data), which correspond to large aperture observations (see Table 1), are hence dominated by the larger scale starburst emission observed in the circumnuclear ring at 200pc from the nucleus. Thus, the data points corresponding to IRAS and ISO data are fitted with a starburst component.
3 The General Infrared model
The model used is the radiative transfer model of Efstathiou \etalas described in detail in Efstathiou and Rowan–Robinson (1995, hereafter ER95), EHY95, and Efstathiou, Rowan–Robinson and Siebenmorgen (2000, hereafter ERS). This radiative transfer model has been successful in fitting the IR continuum of NGC1068 (EHY95) and Centaurus A (Alexander \etal1999). The proposed model for the SED of the Circinus galaxy is a combination of the following two components described below.
3.1 Torus
As concluded in ER95, the most likely geometry for the obscuring material in the center of AGNs, is that of a “tapered disc”. Other proposed geometries for the torus are “flared discs” (Granato and Danese 1994; Efstathiou and Rowan–Robinson 1990 (hereafter ER90)) or cylinders (Pier and Krolik 1992; 1993; Taniguchi and Murayama 1998). However, the shape of the IR continuum spectrum of type 1 and type 2 objects, the appearance of the 10m silicate features and the statistics of the two types of Seyfert galaxies, give strong support for a tapered disc geometry (see ER95 for detailed discussion). Indeed, there is further confirmation of the validity of the tapered disc geometry to realistically represent the nuclear emission of tori in AGNs. This comes from the fitting of IR data to a sample of Seyfert galaxies with the EHY95 models of Figure 3. They have been successfully used to fit nuclear (non–stellar) near–IR observations for a sample of Sy1s and Sy2s (Alonso–Herrero \etal2001) showing that the near–IR nuclear emission from Seyfert galaxies can be fitted with the tapered disc geometry tori of EHY95. We therefore assume this geometry for the Circinus torus. As demonstrated in ER90, the orientation of the plane of the system to the line–of–sight is a very important parameter when fitting the observed spectra, since only a small difference in this inclination parameter, , produces a significant variation in the emergent spectrum. Another important parameter that determines the shape of the IR continuum, is the half–opening angle of the torus, . In general, these parameters are not known for most objects, but fortunately, we have a good idea of their values from spectropolarimetry (Alexander \etal2000) and IR–imaging polarimetry of Circinus (Ruiz \etal2000) which gives 40 degrees (measured from the axis of the torus to the line of sight) and 45 degrees. Although the emission line cones observed in Circinus and many other AGNs offer a measure of the opening angle of the torus, it is common to find that the conical emission “opens–up” as light travels and scatters in the circumnuclear medium. Thus, we should keep in mind that can be smaller than that derived from emission line cones (see section 4).
Other parameters that will affect the shape of the emergent SED spectrum are: the ratio of the inner and outer radii (), the ratio of the height to the outer radius (), the equatorial optical depth (eqAUV), the dust sublimation temperature () and the radial dependence of the density distribution . To take into account the effects of dust in the nuclear regions of Circinus, we assume that there is an additional extinction (i.e. in addition to that produced by the torus). Marconi \etal(1994) found A 20mag towards the nucleus. This limit follows from the fact that we can see the nucleus at 1.25m but are unable to do so at 7000Å, thus, they only set a lower limit for the nuclear extinction. However, we find that AV=25 mag is required to successfully fit the near–IR data. This value is also close to that found by Moorwood and Glass (1984) from the depth of silicate feature at 9.7m and is also consistent with that estimated by Maiolino \etal(1998b). Based on H and K band observations, they set a minimum extinction AV 12mag toward the nucleus of Circinus. From their images, it is clear that this obscuration is caused by the large amounts of dust as seen in their H–K colour map and it is due to the presence of a nuclear gas bar. Their estimated AV however is only a lower limit and we expect a larger value since the extinction is most likely to be due to an inhomogeneous distribution of dust, gas and stars. The parameters assumed for the torus model are listed in Table 2.
| Best fit torus parameters | |
| system inclination777measured from the plane of the torus to the line of sight, , (∘) | 50 |
| cone opening half-angle, , (∘) | 30 |
| eqAUV (mag) | 1000 |
| eqAV (mag) | 200 |
| losAV (mag) | 83888eqAV corrected for the inclination of the torus to the line of sight |
| (K)999dust sublimation temperature at torus inner radius | 1000 |
| 101010value determined as discussed in EHY95 | 1 |
| additional AV111111due to circumnuclear bar(mag) | 25 |
| Best fit starburst parameters | |
| Starburst e-folding time | 10 Myr |
| Starburst age | 26 Myr |
| , initial GMC optical depth | 50 |
| AV in ISM (mag) | 5 |
| AV through Galactic disk (mag) | 1.5 |
3.2 Starburst
The radiative transfer models of starburst galaxies are described
in detail in ERS. The models consider
a starburst galaxy as an ensemble of optically thick giant molecular
clouds centrally illuminated by recently formed stars.
The stellar population is determined according to the Bruzual and Charlot (1993)
stellar population synthesis models. The grain model used is that of
Siebenmorgen and Krügel (1992) and the emission of transiently heated
dust grains is calculated according to their method. In the models, the effects of multiple scattering is taken into account. The models relate the observed properties of a galaxy to its age and star formation history.
These models have
successfully matched the observational characteristics of M82 and other starburst
galaxies (ERS).
Various populations of dust particles are considered:
(i) Mathis, Rumpl and Nordsieck (1977). These are large particles with a
size distribution of classical grains
(ii) small graphite grains, to account for the extinction bump at around
2175Å (Draine 1989)
(iii) PAH molecules, to explain the near–IR and mid–IR emission bands
To take into account the effects of dust in the starburst regions
of Circinus, we extinct the starburst emission by AV=5mag, as measured from narrow
emission line ratios (Oliva \etal1994).
This is lower than the additional extinction assumed to the nucleus (section 3.1), as the starburst
is expected to be outside the circumnuclear molecular bar.
4 Model fitting
As described in section 3, the data points will be fitted to the SED model components according to the observational constraints described in section 2.1. The critical wavelength range is likely to be where the torus and starburst components are equally important, that is in the 10–30m region. Here, the strong absorption feature is indicative of the presence of dust in the form of silicates which are likely to be present in a dusty environment such as the torus, however, the observational beam for this data is large enough to cover a region which also includes star formation. Thus, contributions from both the torus and starburst components are important in this wavelength range. On the other hand, given that the near–IR points are to be modelled by the torus alone (see section 2.1), this sets a strong constraint on the number of possible models to be tested for the torus. Similarly, in the long wavelength range and large aperture data points which include the PAHs features, the starburst component dominates, and only a number of starburst models can be applied. Thus, the overall fitting procedure is much better constrained and the number of free parameters reduced once the short and long wavelength ranges are considered.
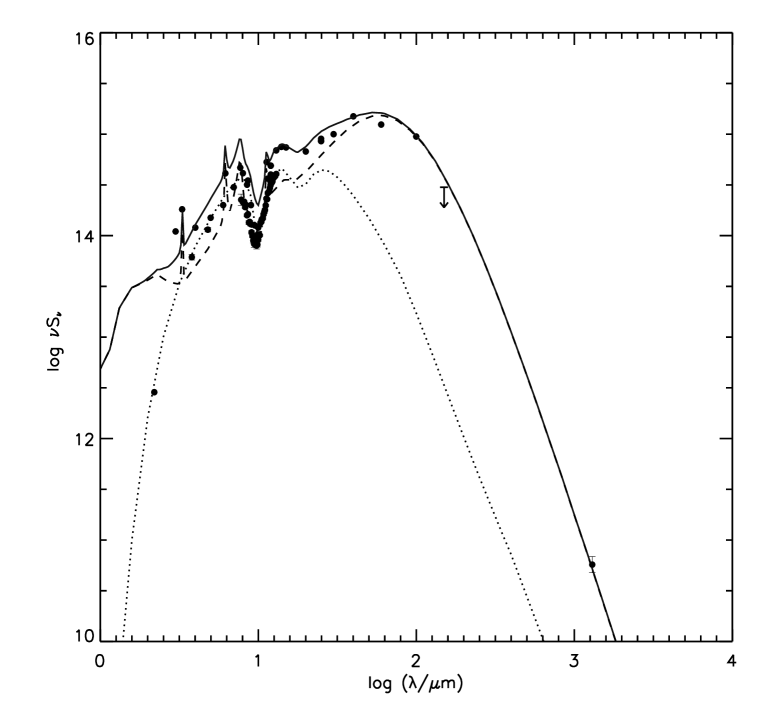
The torus input parameters that reproduce the near–IR points are listed in Table 2. The best fits were obtained with a cone half–opening angle of 30 degrees, the same as the best fit obtained for the NGC1068 torus model (EHY95). One important difference with the NGC1068 model is that there is no requirement to include a contribution from hot dust in the torus cone. Indeed, if this is included, then it is very difficult to obtain a fit to the near–IR data points. The starburst parameters which reproduce the PAHs features and large scale emission successfully are also listed in Table 2. Table 3 presents the derived geometrical characteristics for the best fit torus in Circinus. In Figure 2 we show the best model for the SED of the Circinus galaxy which is the addition of the torus and starburst models. Note that the solid line (representing the total emission from the galaxy) exceeds the mid–infrared data of Roche \etal(1991). This is not surprising as the starburst which contributes about half of the emission is more extended that the 4arcsec aperture of Roche \etal(1991). Thus, the final SED for the 10m absorption feature should not fit the 9.7m data of Roche \etal1991 (Fig 1).
Unfortunately, there is a serious lack of small aperture (nuclear) data in the range of 30–60m. As a consequence, we are unable to rule out tori up to 12pc although increasing the torus outer radius further would produce far too much 30–60m flux. Future observations in this critical wavelength range, will put extra constraints on the torus model, and the torus size would be determined more accurately.
It is interesting to note in Figure 2 the overall larger contribution to the total IR emission of the starburst compared to the torus component. This is indicated by the ratio of the nuclear luminosity –torus component– to starburst luminosity –starburst component– (/) 0.8 (see next section).
| 0.05 | |
|---|---|
| 0.5 | |
| inner radius (, pc) | 0.12 |
| outer radius (, pc) | 2.4 |
| height (, pc) | 1.2 |
5 Discussion
Our SED model shows that, overall, the starburst contribution to the total IR luminosity, slightly dominates over the torus contribution. A direct result of this, is the relatively small size of the torus in Circinus, with a best fit of 2pc for the outer radius, comparable to the torus outer radius of 1.8pc modelled for Cen A (Alexander \etal1999) but significantly smaller than the 90pc torus for NGC1068 (Young \etal1996 and EHY95). This result is smaller than that calculated from the near–IR imaging polarimetry modelling of Ruiz \etal(2000) which suggests that the torus is approximately 16pc in radius, although consistent with our upper limit of 12pc.
So far, by using the radiative transfer models of Efstathiou \etalwe have been able to model the size of the torus outer radius for three objects: NGC1068 (EHY95), CenA (Alexander \etal1999) and Circinus (this work). Although the statistics are small, it is interesting to note that all three AGN can be modelled with tori of very similar parameters. This suggests that whatever the mechanism that forms these tori in an AGN–SB environment, it is such that the size of the tori scales with the luminosity of the central source but the rest of the torus parameters (Table 2) are scale invariant. For example, the hard X–ray continuum, which is considered to be a good indicator of the central source strength, indicates that the Circinus galaxy is a relatively low luminosity AGN (Matt \etal1996), while NGC1068 is 100 times more powerful (Turner \etal1997), with a torus radius 100pc. The predicted torus radii scales as , reflecting the fact that both objects can be fitted with very similar radiative transfer models.
Of great debate regarding the nature of the Circinus galaxy is the ratio of the AGN to starburst emission (/), that is, the relative contribution of the torus and starburst components to the total . Previous predictions from IR modelling differ widely. As already mentioned, Rowan–Robinson and Crawford (1989) found a 20 contribution of the nuclear component to the total and / 0.3 while this work suggests a / of 0.8. On the other hand, from the Br luminosity, Moorwood \etal(1996) estimate that this ratio is perhaps as high as 9. Our result is in very good agreement with that suggested by Maiolino \etal(1998b) who estimate from K band observations a / ratio of 0.9 for the region 200pc. Similarly, we agree with the ratio derived from the inferred ionising continuum required to produce the highly ionised IR lines suggesting a ratio closer to 1 (Moorwood \etal1996). We believe that the differences are caused by a number of pitfalls. For example, Rowan–Robinson and Crawford (1989) modelled the far–IR (10-100m) IRAS data with a three component model, a starburst, a Seyfert and a disc cirrus–like component. This model assumed a spherically symmetric dust distribution with a power–law density distribution, . In this model, radiation from the polar regions of the torus is absorbed by the spherical dust cloud. Thus, this model will naturally under–estimate the nuclear component, as their low / ratio shows. However, there is now ample observational evidence that favours the existence of axially symmetric distributions of dust (Efstathiou and Rowan–Robinson 1990, ER95). On the other hand the large / ratio derived by Moorwood \etal(1996) suggests a strongly dominant AGN over the starburst. This was derived from the comparison of near–IR recombination lines in Circinus and M82; from a Br map (Moorwood and Oliva 1994), they assume that 50 of the recombination lines are produced in the nucleus of Circinus. However, this is likely to be an over–estimation of the strength of Br in the nucleus since,,more recently, a more accurate measurement of the Circinus nuclear recombination lines (Maiolino \etal1998b) has shown that only 10 of the total recombination lines flux is produced in the nucleus of Circinus. Thus, assuming the standard relation between Br flux and total IR luminosity in starburst galaxies, we can determine the contribution of the starburst to . We find 8.5, so / 1.2 for an AGN luminosity of . This is in good agreement with the ratio we find from the SED modelling.
Radio observations suggest that at these wavelengths, the starburst emission is the dominant component (Forbes and Norris, 1998) and Circinus would certainly be classified as a starburst galaxy based purely on radio emission. Indeed, it is interesting to note that the FIR–radio correlation established by Helou, Soifer and Rowan–Robinson (1985) which is followed by normal spiral and starburst galaxies, is closely followed by the Circinus galaxy, confirming Forbes and Morris result. However, it is almost certain that this correlation is the result of large scale star–formation activity unrelated to the Seyfert activity which generates both the synchrotron radio emission and the thermal FIR emission. Given that the Circinus galaxy has strong star–formation activity on small and large scales, it is not surprising that this galaxy follows the FIR–radio correlation. Radio observations on arcsec resolution can not easily distinguish between Seyfert and starburst activity. The radio emission from both starburst regions and Seyfert nuclei have similar spectra and morphology, and the steep spectrum of even the compact cores seen in VLA maps of Seyferts suggests that they might contain a significant nuclear starburst component (Norris \etal1992). On the other hand, long–baseline radio interferometry is sensitive only to compact, high brightness objects and is an ideal tool to discriminate over the two spatial scales. Unfortunately no radio interferometry is available for the Circinus galaxy and we can not clearly determine the nature of the central source from present radio data.
Nevertheless, there is a clear large variation in the predicted / ratios for Circinus, from starburst-dominated at FIR wavelengths, to AGN-dominated in the near and mid IR. Indeed, NGC1068, the prototypical Seyfert 2 galaxy shows a similar behaviour. The mid–IR(5-16m) spectrum of NGC1068 is 85-95 dominated by the AGN, and / 3. In the FIR however, where extended emission dominates, the nucleus does not contribute more than 25 to the total IR flux at 450m (Le Floc’h \etal2001). Clearly, determination of / is strongly dependant on the spectral region where it is calculated.
Our SED modelling has the advantages over other predictions of having a more complete model for the SED, including the emission of PAH features and a more realistic torus model. Additionally we have used a large set of recently published data, from NIR to mm wavelengths. More importantly, we pay special attention to the fit of data points from the various aperture sizes which give important constraints to the size of the emitting source. The undoubted composite nature of the Circinus galaxy is shown in our IR SED model which predicts a galaxy dominated by the AGN torus at near and mid–IR wavelengths while at far–IR to mm wavelengths the starburst activity is the dominant one.
6 Conclusions
We can summarise our results as follows:
-
•
The case of the Circinus galaxy provides strong support for the dusty torus model of active galaxies which further support the unification scheme, that is, thick dusty tori with a tapered disc geometry surrounding the central engine.
-
•
Our best fit for the outer radius of the torus in Circinus is 2pc, but a radius as large as 12pc can not be ruled out.
-
•
We confirm the composite nature of the Circinus galaxy, which is dominated by the AGN torus emission in the near–IR but largely dominated by starburst phenomena in the far–IR and mm wavelengths. The is slightly dominated by the starburst emission and the ratio / 0.8.
7 Acknowledgements
We thank P.Roche for providing the mid–IR spectrum of Circinus and D.Sturm for providing the ISO SWS spectrum. We thank A. Alonso–Herrero and the anonymous referee for useful comments. MR and AE thank PPARC for support through a postdoctoral assistantship. DMA thanks the TMR network (FMRX-CT96-0068) for support through a postdoctoral grant while working on this project. This research has made use of the NASA/IPAC Extragalactic Database (NED), which is operated by the Jet Propulsion Laboratory, California Institute of Technology, under contract with NASA.
References
- [1] Alexander, D.M., Heisler C.A., Young S., Bailey J.A., Hough J.H., Lumsden S.L. 2000, MNRAS, 313, 815
- [2] Alexander D.M., Efstathiou A., Hough J.H., Aitken D.K., Lutz D., Roche P.F., Sturm E. 1999, MNRAS, 310, 78
- [3] Alonso–Herrero A., Quillen A.C., Simpson C., Efstathiou A., Ward M.J., AJ, 2001, astro-ph/0012096
- [4] Antonucci R., Miller J., 1985, ApJ, 297, 621
- [5] Antonucci R. 1993, ARA&A, 31, 473
- [6] Bruzual G., Charlot S., 1993, ApJ, 405, 538
- [7] Capetti A., Axon D., Macchetto F. D., 1997, ApJ, 487, 560
- [8] Danese L., Silva L., Granato G.L., Franceschini A., 1998, in “The young Universe: Galaxy Formation and Evolution at Intermediate and High Redshift”, eds. D’Odorico S., Fontana A., Giallongo E., ASP Conf. Series, 146, 40
- [9] Draine B.T., 1989, in “Interstellar Dust”, eds. Allamandola L., Tielens A.G.G., Proc. IAU Symp., 135, Kluwer, Dordrecht, p.313
- [10] Efstathiou A., Rowan–Robinson M., 1990, MNRAS, 273, 649, (ER90)
- [11] Efstathiou A., Hough J.H., Young S., 1995, MNRAS, 277, 1134 (EHY95)
- [12] Efstathiou A., Rowan–Robinson M., 1995, MNRAS, 273, 649 (ER95)
- [13] Efstathiou A., Rowan–Robinson M., Siebenmorgen R., 2000, MNRAS, 313, 734 (ERS)
- [14] Falcke H., Wilson A. S., Simpson C., 1998, ApJ, 502, 1998
- [15] Forbes D.A., Norris R.P., 1998, MNRAS, 300, 757
- [16] Gallimore J.F., Baum S.A., O‘Dea C.P., 1997, Nature, 388, 743
- [17] Ghosh S.K., Bisht R.S., Iyengar K.V.K., Rengarajan T.N., Tandon S.N., Verma R.P., 1992, ApJ, 391, 111
- [18] Granato G.L., Danese L., 1994, MNRAS, 268, 235
- [19] Granato G.L., Danese L., Franceschini A., 1997, ApJ, 486, 147
- [20] Greenhill L.J., Gwinn C.R., Antonucci R., Barvainis R., 1996, ApJ, 472, L21
- [21] Helou G., Soifer B.T., Rowan–Robinson M., 1985, ApJ, 298, L7
- [22] Jackson J.M., Paglione, T.A.D., Ishizuki, S., Nguyen, Q.R., 1993, ApJ, 418, L13
- [23] Lawrence A., Elvis M., 1982, ApJ, 256, 410
- [24] Le Floc’h E., Mirabel I.F., Laurent O., Charmandaris V., Gallais P., Sauvage M., Vigroux L., Cesarsky C., 2001, astro-ph/0101038
- [25] Lumsden S.L., Moore T.J.T., Smith C., Fujiyoshi T., Bland–Hawthorn J., Ward M. J., 1999, MNRAS, 303, 209
- [26] Maiolino R., Salvati M., Bassani L., Dadina M., Della Ceca R., Matt G., Risaliti G., Zamorani G., 1998a, A&A, 338, 781
- [27] Maiolino R., Krabbe A., Thatte N., Genzel R., 1998b, ApJ, 493, 650
- [28] Malkan M.A., Gorjian V., Tam R., 1998, ApJS, 117, 25
- [29] Marconi A., Moorwood A.F.M., Origlia L., Oliva E., 1994, Messenger, 78, 20
- [30] Mathis J.S., Rumpl W., Nordsieck K.H., 1977, ApJ, 217, 425
- [31] Matt G., Fiore F., Perola G.C., Piro L., Fink G.G., Grandi P., Matsuoka M., Oliva E., Salvati M., 1996, A&A, 315, L109
- [32] Moorwood A.F.M., Glass I.S., 1984, A&A, 135, 281
- [33] Moorwood A.F.M., Oliva E., 1994, Infrared Phys. Tech., 35, 349
- [34] Moorwood A.F.M., Lutz D., Oliva E., Marconi A., Netzer H., Genzel R., Sturm E., de Graauw T., 1996, A&A, 315, L109
- [35] Moshir M., Kopman G., Conrow T.A.O., Pasadena: Infrared Processing and Analysis Center, California Institute of Technology, 1992, edited by Moshir M., Kopman G., Conrow T.A.O.
- [36] Norris R.P., Roy A.L., Allen D.A., Kesteven M.J., Troup E.R., Reynolds J.E., 1992, in “Relationships between Active Galactic Nuclei and Starburst Galaxies”, eds. Alexei Filippenko, ASP Conf. Series, 31, 71
- [37] Oliva E., Salvati M., Moorwood A.F.M., Marconi A., 1994, A&A, 288, 457
- [38] Packham C., Young S., Hough J.H., Axon D.J., Bailey J.A., 1997, MNRAS, 288, 375
- [39] Pier E., Krolik J., 1992, ApJ, 401, 99
- [40] Pier E., Krolik J., 1993, ApJ, 418, 673
- [41] Roche P.F., Aitken D.K,. Smith C.H., Ward M.J., 1991, MNRAS, 248, 606
- [42] Rowan–Robinson M., Crawford J., 1989, MNRAS, 238, 523
- [43] Ruiz M., Alexander D.M., Young S., Hough J.H., Lumsden S., Heisler C. 2000, MNRAS, 316, 49
- [44] Siebenmorgen R., Krügel E., 1992, A&A, 259, 614
- [45] Siebenmorgen R., Moorwood A.F.M., Freudling W., Käufl, H.U., 1997, A&A, 325, 450
- [46] Siebenmorgen R., Krügel E., Zota V., 1999, A&A, 351, 140
- [47] Sturm E., Lutz D., Tran D., Feuchtgruber H., Genzel R., Kunze D., Moorwood A.F.M., Thornley M.D., 2000, A&A, 358, 481
- [48] Tadhunter C., Packham C., Axon D.J., Jackson N.J., Hough J.H., Robinson A., Young S., Sparks W., 1999, ApJ, 512, L91
- [49] Taniguchi Y., Murayama T., 1998, ApJ, 501, L25
- [50] Turner T.J., George I.M., Nandra K., Mushotzky R.F., 1997, ApJ, 488, 164
- [51] Wilson A.S., Tsvetanov Z.I., 1994, AJ, 107, 1227
- [52] Young S., Packham C., Hough J.H., Efstathiou A., 1996, MNRAS, 283, L1
- [53]