Dusty Nuclear Disks and Filaments in Early Type Galaxies111 Based on observations with the NASA/ESA Hubble Space Telescope, obtained at the Space Telescope Science Institute, which is operated by the Association of Universities for Research in Astronomy, Inc. under NASA contract No. NAS5-26555.
Abstract
We examine the dust properties of a nearby distance-limited sample of early type galaxies using the WFPC2 of the . Dust is detected in 29 out of 67 galaxies (43%), including 12 with small nuclear dusty disks. In a separate sample of 40 galaxies biased for the detection of dust by virtue of their detection in the 100 m band, dust is found in 78% of the galaxies, 15 of which contain dusty disks. In those galaxies with detectable dust, the apparent mass of the dust correlates with radio and far infrared luminosity, becoming more significant for systems with filamentary dust. A majority of and radio detections are also associated with dusty galaxies rather than dustless galaxies. This indicates that thermal emission from clumpy, filamentary dust is the main source of the far-IR radiation in early type galaxies. Dust in small disk-like morphology tends to be well aligned with the major axis of the host galaxies, while filamentary dust appears to be more randomly distributed with no preference for alignment with any major galactic structure. This suggests that, if the dusty disks and filaments have a common origin, the dust originates externally and requires time to dynamically relax and settle in the galaxy potential in the form of compact disks. More galaxies with visible dust than without dust display emission lines, indicative of ionized gas, although such nuclear activity does not show a preference for dusty disk over filamentary dust. There appears to be a weak relationship between the mass of the dusty disks and central velocity dispersion of the galaxy, suggesting a connection with a similar recently recognized relationship between the latter and the black hole mass.
Accepted for publication in AJ
1 Introduction
Elliptical galaxies have often been viewed as old, uniform systems, with little gas, dust and activity. Through the years, ground-based and especially high spatial resolution imaging studies with the () have rapidly changed that view (Sadler & Gerhard, 1985; Véron-Cetty & Véron, 1988; Forbes, 1991; Goudfrooij et al., 1994; Ferrarese et al., 1994; Jaffe et al., 1994; van den Bosch et al., 1994; van Dokkum & Franx, 1995; Lauer et al., 1995; Faber et al., 1997; Ferrari et al., 1999; Tomita et al., 2000). Based on these surveys, early-type galaxies are now known to commonly contain large amount of dust in various forms and sometimes complex structures. Of particular interest are the small (″, 200 pc) dusty nuclear disks that have been found in the centers of elliptical galaxies (see review by Ford et al. 1997). Their discovery and the ionized gas disks, associated with the dust, opened up a new means of efficiently measuring the central mass potentials, possibly of supermassive black holes (BH), residing in the centers of galaxies (Harms et al., 1994; Ferrarese et al., 1996; Macchetto et al., 1997; Bower et al., 1998; van der Marel & van den Bosch, 1998; Ferrarese & Ford, 1999; Verdoes Kleijn et al., 2000).
In this paper, we conduct a survey of two large samples of elliptical galaxies to study their dust properties and how they are related to other global properties of the parent galaxies as a whole. The main sample consists of E or S0 galaxies from the Lyon/Meudon Extragalactic Database (LEDA), selected to be nearby with 3400 km s-1, and lying at galactic latitude 20° to minimize Galactic extinction. Details of the sample selection and morphological and photometric properties of the galaxies are described in Rest et al. (2001) (hereafter Paper I). A total of 130 galaxies meet our criteria, out of which 67 galaxies were observed by using WFPC2 in snapshot mode with the F702W filter ( band). We shall refer to this sample as the “snapshot” sample in the rest of the paper.
In order to better assess the results derived from the snapshot sample, we also discuss where relevant a sample of galaxies selected for their 100 m emission. The rational is that these galaxies are selected for their higher far-IR (60 and 100 m) emission, and thus are probably more likely to contain large amount of dust. The selection criteria are similar to those of the snapshot sample except that the galaxies are drawn from the archive, and with the additional criterion that a 100 m detection exist with significance. A total of 40 galaxies with /WFPC2 images was collected from the archive, and examined. Hereafter, we refer to this sample as the “IRAS” sample.
Our goal is to provide a reliable assessment of the frequency of dust and dusty disks in early-type galaxies and how their morphology, amount, and dynamics relate to the activity and other characteristics of the host galaxies. The main strength of our snapshot study is the large and unbiased sample of galaxies, all imaged at similar high resolution. This will allow us to make reliable statistical statements regarding their dust properties. Ultimately, we wish to use those with dusty nuclear disks as a probe of the central BH masses, and study how they are related to their environment. For consistency with Paper I, we use = 80 km s-1 Mpc-1 throughout the paper.
2 Analysis
2.1 Dust Morphology and Mass
Some general properties of galaxies in the snapshot sample are listed in Table 1. Paper I describes the observations and reduction of the images. We now describe our analysis of the galaxies with dust. Paper I reports the detection of dust in 29 galaxies, or 43% of the snapshot sample (the method of dust detection is outlined below). This is generally comparable to those reported by previous studies of early-type galaxies, which have shown the following detection rates of dust: Sadler & Gerhard (1985): 40%; Véron-Cetty & Véron (1988): 23%; Goudfrooij et al. (1994): 41%; van Dokkum & Franx (1995): 48%; Ferrari et al. (1999): 75%; Tomita et al. (2000): 56%. The large variation in the dust detection rates among different studies may be due to the different methods of counting detections, or the different resolutions and sensitivities of the observations. The ground-based CCD study of Véron-Cetty & Véron (1988), for example, includes only dust at the level of , effectively missing all the small nuclear dust disks, resulting in an abnormally low detection rate. The relatively high detection rate of Ferrari et al. (1999), on the other hand, may be due to higher sensitivity and lower detection threshold. Also, we note that the 85% dust detection rate found by van den Bosch et al. (1994) for galaxies in the Virgo cluster is considerably higher than those mentioned above. The reason for this is because they included galaxies with weakly distorted isophotes, in which the presence of dust was not directly visible by eye. In several cases, it later turned out that these distortions were not due to dust, but rather to defects in the CCD chips (so called “measles”). Van den Bosch et al. (1994) detected dust “by eye” in 5 out of 14 galaxies (36%), which is in good agreement with other studies.
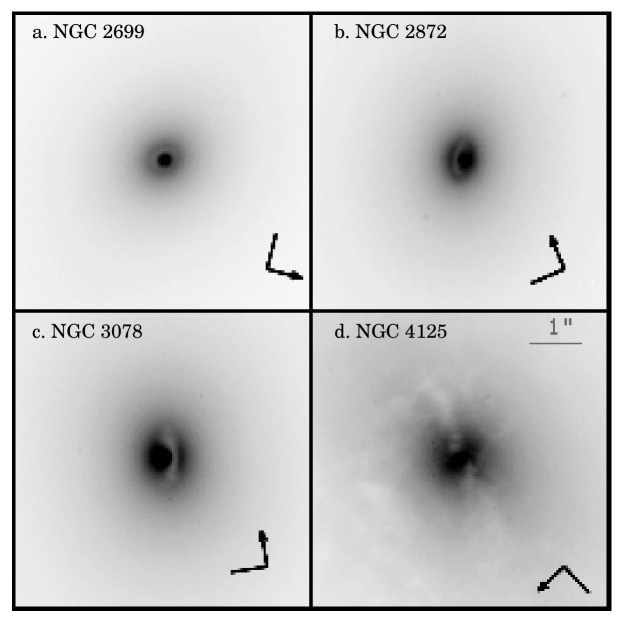
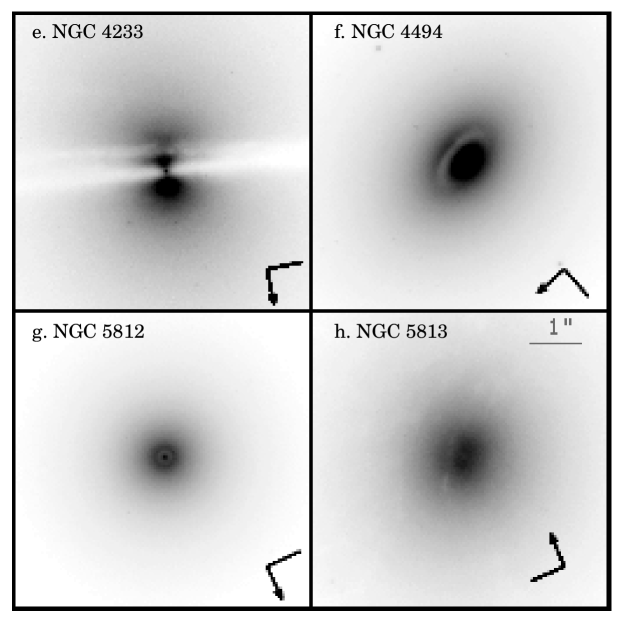
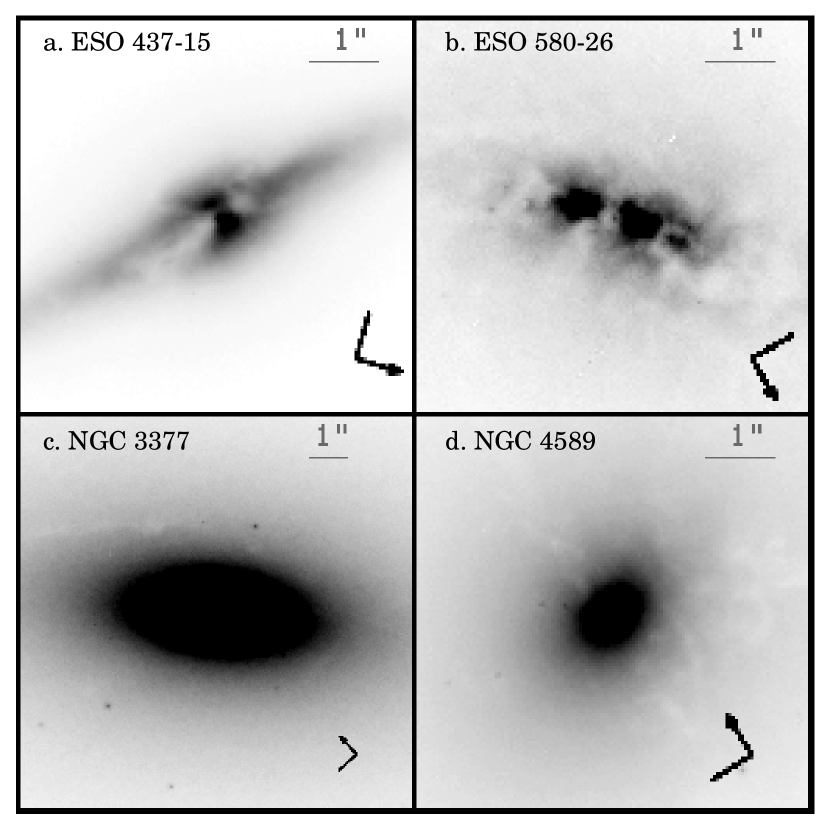
For our sample, the morphology of the dust is grouped into two broad categories: filamentary and disky. Of these systems, 17 have only filamentary dust with no disks, 9 have well-defined dusty disks, and 3 show dust lying not only in a disk-like morphology but also in widespread extended filaments. See Table 2 for a summary of the dust morphology found in the sample. In Paper I, the level of filamentary dust is described in a purely qualitative way, with the simple scale I, II or III being assigned to denote the least to most dusty galaxies through visual inspection only. Class I represents small traces of dust that do not greatly affect the isophotal shape of the galaxy; class II and III denote large amounts of dust that prevent a meaningful analysis of the isophotes and luminosity profiles. Figures 1 and 2 show examples of some of the galaxies with dusty disks and filaments. In this paper, we follow Sadler & Gerhard (1985) and van Dokkum & Franx (1995) to estimate the mass of the dust present in each system. The dust mass is given by:
| (1) |
where is the mean visual extinction in magnitudes, is the surface area covered by the dust, and is the extinction coefficient per unit mass. We adopt mag kpc2 -1 (van Dokkum & Franx, 1995).

To obtain , we first determine the optical depth from the ratio of the calibrated image to the model of its surface brightness generated from an isophotal elliptical fit, using the IRAF task “ellipse” with the dusty features masked out. The optical depth in is then , where is the observed flux and is the modeled flux, and . Assuming a Galactic extinction law with , we have (Cardelli, Clayton & Mathis 1989). In determining the mean visual extinction, we include all areas where , which is the minimum detectable . Along with the estimated mass of the visible dust, Table 2 lists the morphologies of the dust features, the mean visual absorption, the position angle (PA) of the major axis of the dust feature, and the PA of the galaxy major axis. Table 2 shows that the range of dust mass values for our sample is comparable to that obtained by Goudfrooij & de Jong (1995) and van Dokkum & Franx (1995), typically 101–105 222van Dokkum & Franx (1995) refer to the total as the dust mass, with .. In Table 3, we show a comparison of the optically derived gas mass estimated by our study with those of previous works. For consistency, we consider only results obtained from similar observations by van Dokkum & Franx (1995) and Tomita et al. (2000). A gas-to-dust ratio of 130 is assumed for our study, and previous mass values have been converted using distances listed in Table 1. Although the number of objects in common between these studies are small, the mass estimates are in reasonable good agreement, given the uncertainty of 0.5 in logarithmic scale (Tomita et al., 2000) typical for this type of dust mass determination. The agreement appears better with van Dokkum & Franx (1995), who used the same method as our study, than with Tomita et al. (2000), who used color excess, giving mass values that are a few times to one order of magnitude larger than ours.
Note that the dust mass estimated above relies on the simple assumption of a foreground screen in front of a background light. Any dust embedded within the galaxies or intermixed with stars cannot be estimated by this method. For example, using radiative transfer calculations, including scattering of photons into the line of sight, Martel et al. (2000) have found that the mass estimated for the dusty disk in NGC 4261 is about one order of magnitude greater than that inferred from a foreground screen model. Furthermore, since we are fitting directly to the observed light, and it is impossible to mask out all faint dust features, we do not have a perfect model of the true underlying light. Thus the derived masses listed in Table 2 are always lower limits to the true mass.
Some of the missing non-clumpy, diffuse dust could be detected through its far-infrared radiation. This is confirmed by our estimates of the dust mass from the flux densities . Following Goudfrooij & de Jong (1995), the dust mass is estimated from the flux through the formula:
| (2) |
where is the flux density in mJy, is distance in Mpc, and is in m. The dust temperature is estimated from the color ratio , according to the prescription of Kwan & Xie (1992), using an emissivity law that varies as . For those galaxies where the color ratio is not available, a representative color temperature of K is assumed. We caution that the dust mass is very sensitive to such assumed parameters as grain size and temperature. Table 4 lists the radio and fluxes for those galaxies detected in the sample. The radio 1400 MHz flux densities are derived from the NRAO VLA Sky Survey (NVSS; Condon et al. 1998), and the fluxes are taken from Knapp et al. (1989), except for ESO 437-15, ESO 447-30, ESO 580-26, and NGC 2824, which are not included in their sample. For these galaxies, we measured their flux densities from the data scans by using the apphot package in IRAF and comparing the results to values in the to derive scaling factors, which are similar to those of Knapp et al. (1989). As Figure 3 shows, for those galaxies with both detections and visibly detectable dust, the dust masses estimated from the fluxes, listed in Table 4, are 1–4 orders of magnitude greater than those derived from optical depth measurements of visual dust structures. This is consistent with earlier studies (Goudfrooij & de Jong, 1995; de Koff et al., 2000).
2.2 Correlation with Galaxy Properties


Although the optically derived dust mass, , always underestimates the true dust mass, we choose to use it in our analysis, since the derived dust mass, is unsuitable for any analysis relating to the far-IR properties. If derived in a consistent manner for the whole sample, should be a reliable representation of the dust mass. Moreover, some galaxies have no detections and yet dust is detected visually (see below). Presumably, most of the dust in these objects may be too cold ( 20 K) to be detected by (Tsai & Mathews, 1996; Merluzzi, 1998). Figures 4 and 5 show the scatter plots of various properties of the snapshot sample galaxies versus dust mass. Table 5 summarizes the correlation coefficients for these plots. As can be seen, both the 60m and 100m luminosities are significantly correlated with dust mass. Furthermore, the correlation becomes stronger when the few systems with dusty disks are excluded. The only outliner is NGC 3065 whose IR fluxes are suspected to be contaminated with emission from NGC 3066, 3′ away (Knapp et al., 1989). This source is excluded from our statistical analysis. As Figure 4 and Table 5 also show, there appears to be no significant correlation between luminosities and absolute blue magnitudes of these galaxies. Turning to the radio property, Figure 5 and Table 5 show that the 1.4 GHz radio luminosity is also seen to follow a weak, but significant relationship with dust mass. However, in this case, the radio luminosity is also correlated with the optical luminosity of the galaxies, in agreement with Calvani, Fasano, & Franceschini (1989). This suggests that the – correlation may be largely a secondary effect of a more fundamental relationship between optical luminosity (and thus mass) and radio luminosity of the galaxy.
If one considers the radio detection rate, not constrained solely to those galaxies found to have dust, the correspondence of radio-emitting sources to the presence of dust is much stronger. Figure 6 and Table 6 present the detection rates of various properties for both the snapshot and samples. In the snapshot sample, only 8% of the galaxies without dust have radio detection, while 66% of the galaxies with dust do. Similarly, of the 26 galaxies in the snapshot sample with 100 m detection, most (58%) are associated with dusty galaxies, a great majority of which are filamentary (Table 6). Since the galaxies are selected to be nearby ( 40 Mpc), any distance effects are likely to be small. The overall rate of detection in the snapshot sample is 42%, consistent with those reported by Knapp et al. (1989) for E and S0 galaxies.

Turning to the sample listed in Table 7, about 3/4 (78%) of the galaxies contain dust (i.e., detection by eye from images) of some type, compared to only 43% for the snapshot sample. Since the sample is specifically selected for the detection of 100 m emission, this suggests that the far-IR radiation largely arises from dust embedded throughout the galaxy.
As Figure 7 shows, there appears to be no correlation between the derived dust mass and absolute blue magnitude. This result is consistent with that of Goudfrooij & de Jong (1995) and van Dokkum & Franx (1995) but disagrees with Merluzzi (1998) and Ferrari et al. (1999). At first sight, this seems to suggest that there is little causal connection between the dust and the existing stellar population in the galaxy. However, if only the 12 galaxies with dusty disks are examined (open circles in Fig. 7), a clear relationship is evident between the dust mass and blue luminosity of the galaxies. The correlation between and is highly significant, with a Spearman rank coefficient of ()333Since the correlation does not appear linear, we quote the Spearman rank coefficient here; a Pearson linear coefficient is given in Table 5 for comparison.. NGC 4233 is an outliner, reducing the the significance of the correlation. Excluding NGC 4233 improves the correlation coefficient to ().

2.3 Correlation with Velocity Dispersion
The mass of the central BH in early type galaxies has been shown to be correlated with the bulge luminosity (and hence its mass; e.g., Kormendy & Richstone 1995; van der Marel 1999). Very recently, a much tighter correspondence has been shown between the BH mass and the velocity dispersion of the galaxy (Ferrarese & Merritt, 2000; Gebhardt et al., 2000). In Figure 8 we show plots of the mass and diameter of the dusty disks versus the central velocity dispersion for both galaxies in the snapshot and samples. is the velocity dispersion taken from Davies et al. (1987) and McElroy (1995), and we have used distances derived from surface brightness fluctuation (SBF; e.g., Neilsen & Tsvetanov 2000) wherever possible. There appears to be a weak tendency for larger disks with higher dust mass to show higher velocity dispersion. However, the diagrams contain considerable scatters, and any correlation is very weak at best. Notable are the apparent “zones of avoidance” in the upper left and lower right areas of the graphs. A formal test shows that the vs. plot has a correlation coefficient of (). Interestingly, in the disk size vs. diagram, the correlation seems to apply only for those galaxies whose dust disk diameter is 400 pc. Those galaxies with very extended “disks”, or more like lanes, such as NGC 5128 (Cen A), NGC 4697, NGC 4233, NGC 6861 and ESO 208-21 lie well above the trend line. Discarding these from the analysis, statistical test shows that the correlation has a coefficient of ().

If the correlation is real, it is interesting to speculate on the cause and implications of such a relationship. The more luminous galaxies with larger mass may be expected to contain more dust. Indeed, there is a strong relationship between dust mass and absolute magnitude for those galaxies with dusty disks (Fig. 7). The loose correlations between the disk size/mass and (Fig. 8) could be a direct consequence of a correlation between galaxy mass and , which has long been documented (Faber & Jackson, 1976; Faber et al., 1987). The remarkable sharpness of the disks detected (Fig. 1) is also highly suggestive of some physical mechanism that acts to limit the size and shape of these disks. If so, the disk size/mass – relation indicates that such process is ultimately governed by the mass of the central BH.
2.4 Origin of the Dust
Clues to the origin of the dust can be glimpsed from a comparison of the PA between the major axis of the dust features and that of the galaxy. The isophotal PA of the galaxy’s major axis is measured at 10″, and listed in Table 2. Table 2 also lists the PA difference between the two major axes. Figure 9 displays a distribution of the PA difference. As can be seen, the dusty nuclear disks have a high tendency to be aligned with the major axis of the host galaxies, nearly all within 10°, while the filamentary dust structures show a much lower tendency to align with their hosts. The former result is in agreement with that of Martel et al. (2000) for a sample of dusty disks in nearby 3CR elliptical galaxies. The median for the dusty disks and filamentary dust are 5° and 23°, respectively. A K-S test confirms that the distributions are significantly different, with only a 0.7% probability that they are drawn from the same parent population. This may suggest different origins for the disky and filamentary dust: internal for the dusty disk and external for filamentary dust. The presence of a correlation in Figure 7 for dusty disks but not for filamentary dust also seems to corroborate this. However, if both types of dust have a common origin, the most likely interpretation is that the dust comes from the outside and requires time to settle into well-organized disks. Again, the outliner is NGC 4233, which is the only galaxy with dusty “disk” that does show a misalignment (). This galaxy, however, happens to have very extended double dust lanes, rather than the more typical compact nuclear disk, perhaps suggesting that the dust has been acquired more recently and is still in the process of settling into a compact nuclear disk.

For those galaxies that have filamentary dust, the acquired dust has not yet had sufficient time to relax and achieve equilibrium in a “settled state”. If the dust had arisen internally we would have expected a general alignment with the major dynamical axis of the galaxy. Our finding is consistent with that of van Dokkum & Franx (1995), who found a kinematic misalignment between the stars and the dust in a sample of early-type galaxies, suggesting that the two are not kinematically coupled, and thus have different origins. In a study of a sample of radio-loud active galaxies (the 3CR sample), de Koff et al. (2000) also find the dust in various forms similar to those seen here, and they suggest that these are also probably reflective of their different dynamical states. Previous studies have reached similar conclusion that the dust is external in origin (Kim, 1989; Forbes, 1991; Goudfrooij & de Jong, 1995).
3 Discussion
If the dust originated in a merger of two gas-rich disk galaxies (Barnes & Hernquist 1996, 1998), one might expect that the stars have not fully reached equilibrium either. However, no evidence for recent merger activity has been found in stars, even in the outer parts of the galaxy. This may suggest that the dust could arise from the tidal capture of gas from an encounter with a nearby galaxy. As a simple test of this hypothesis we have looked for any correlation between the amount of dust and local environment density of the galaxies in the snapshot sample. The group membership is taken from Garcia (1993), Huchra & Geller (1982) and Geller & Huchra (1983) and are listed in Table 1. As a rough measure of the size of the group we have also considered the group harmonic radius taken from Huchra & Geller (1982) and Geller & Huchra (1983). It is defined as , where is the mean velocity of the group, is the number of group members, and is the angular separation of the th and th group members. We show in Figure 10 the scatter plots of versus , , and the number density of the group defined as . As can be seen, there appears to be no correlation between the dust mass with any of these quantities.
As Table 6 and Figure 6 also show, there is virtually no difference between the extra-galactic environment of the two types of galaxies: dusty galaxies are no more likely to be found in groups or having close companions than dustless galaxies. These tests, therefore, fail to support an external origin for the dust. However, given other evidence for an external origin from this and previous studies, it may be possible for the dust to either be captured sufficiently long ago that no signs of mergers or interactions are currently evident, or be acquired more recently but has an efficient way of losing angular momentum quickly. As shown by Tohline, Simonson, & Caldwell (1982) and Steiman-Cameron & Durisen (1988), the timescale that dissipative differential precession causes gas entering an elliptical galaxy to settle in a disk is fairly short ( yrs). We note that an external origin, coupled with the distribution in Figure 9, also suggests that elliptical galaxies are predominantly oblate (Tohline et al., 1982). The external or internal origin of the dust could be confirmed with a systematic spectroscopic study of a large and well-defined sample of galaxies with dust, such as that of the present study, to examine the dynamics and sense of rotation of the stars and gas. If approximately half of the disks are counter-rotating with respect to the stars, the dust most likely has an external origin. Such counter-rotating disks have been observed in a number of galaxies (Bertola & Corsini, 1999; Caon, Macchetto & Pastoriza, 2000), with a higher incidence in early-type galaxies (Kannappan & Fabricant, 2000), providing support for the idea that these disks are products of galaxy interactions or mergers.
It has been shown that the presence of dust is closely associated with ionized gas in early-type galaxies (Caldwell, 1984; Goudfrooij et al., 1994; Ferrari et al., 1999). The presence of ionized gas alone, however, does not establish the object as being a bona fide active galactic nuclei (AGN), with the excitation of the gas provided by photoionization from a central nonthermal continuum. Because active star forming regions are often associated with dust, in some of these systems, the gas ionization probably comes from circumnuclear starburst or high-velocity shocks and not a true active nucleus (i.e, gas-fed BH), although many are found to be LINERs (Table 1; many of which are believed to be low-luminosity AGNs). For the purpose of the following discussion, we shall take the presence of any emission line as a sign of galaxy activity.

We wish to see if ionized gas indicative of galactic activity is more reflective of not only dust, but dust in a small nuclear disk. That is, is it more likely for a galaxy to show emission lines when a dusty disk is present than when dust is filamentary in form or no dust is seen? It is natural to expect galaxies with dusty nuclear disks to show some level of nuclear activity because there is an ample gas supply from the disk to feed the central massive BH, if it is present. Furthermore, the closer the dust is to the nucleus, the more likely the connection is to the activity. To answer this question, we have searched the literature for observations of any line emission in the snapshot sample. Table 1 summarizes our results. Of the 67 galaxies in our snapshot sample, we found 43 with published observations establishing whether or not ionized gas is present. Our search indicates that 19 (86%) of the dusty galaxies do show line-emitting gas, compared to only 6 (28%) of the dustless galaxies. As §2.1 shows, however, if no dust is visually detected, it may not mean that it is truly free of dust; the dust could be in a diffuse, non-clumpy form that is not visibly apparent. Figure 6 indicates that the presence of line-emitting gas does not show any preference for galaxies with dust in the form of a small disk, or extended clumps/filaments. In fact, the incidence of emission lines is virtually identical ( 87%) between the two groups. This indicates that emission line activity does show a strong preference for galaxies with visibly detectable dust, consistent with the finding by Caldwell (1984) and Tomita et al. (2000), but not necessarily in small nuclear disky form. Taken as a whole, emission lines occur in about 58% of the snapshot sample galaxies. This is consistent with Ho et al. (1997a), who found that the detection rate for emission line in E and S0 galaxies in a large, complete sample of nearby galaxies is 60%.
While most of the dusty disk galaxies in our sample have ionized gas, we have found at least a few without any signs of line emission (e.g., NGC 4406, NGC 4648). While this may indicate that the emission level is below the detection limit of the surveys, how the fuel is being fed to the central BH and the rate of accretion may be an important factor in determining the energy production and emission. Perhaps, a central massive BH may not have yet formed in some galaxies even though a dusty disk is present; alternatively, the BH is present but the accretion rate may not be high enough to ignite the activity: the absence of activity may be due to either a puny BH or an underfed massive one. For the two galaxies mentioned above, their velocity dispersions of order 240 km s-1 (McElroy, 1995) suggest a black hole mass of , quite typical of many early-type galaxies (Ferrarese & Merritt, 2000; Gebhardt et al., 2000). Thus, their inactivity may most likely be due to a radiation inefficient mode of, or lack of, fuel accretion rather than a lack of a BH.
Further support for a lack of fuel transport comes from close examination of the central regions of dusty galaxies. Martini & Pogge (1999) examined WFPC2 images of the CfA sample of Seyfert 2 galaxies and found that the presence of nuclear spiral dust lanes within the inner 10-100 pc is nearly ubiquitous. Apparently, such dust spirals appear necessary in order for the gas to lose angular momentum and infall effectively into the supermassive BH, thereby producing real AGN activity. Although we were unable to produce color images for most of our galaxies since they were observed in only one band (F702W), examination of the optical depth images (see §2.1) revealed that nuclear dust spirals are not a common feature in our sample galaxies, appearing in only about four of 29 dusty galaxies. This is consistent with their lack of strong activity.
We showed in §2.2 that a significantly higher fraction of the galaxies with dust have detections in the radio. A survey of radio-loud early-type galaxies (Verdoes Kleijn et al., 1999) has shown that the incidence of dust is 89%, about twice as high as found in our snapshot sample of relatively benign, radio-quiet early-type galaxies (43%). Even in the sample, which is biased for the detection of dust, the dust detection rate (78%) is significantly lower than that of the radio-loud sample. However, the overall rates of radio and emission line detection are slightly higher than those in the snapshot sample (Table 6). Recently, Sparks et al. (2000) show that the detection rate of dust and dusty disks in nearby FR-I radio sources is nearly 100%. In 4 out of 5 cases where the galaxies are sufficiently nearby to allow a detailed look of the nuclei, Sparks et al. also report the presence of optical jets emanating perpendicular to face-on dust disks. These studies provide strong support for the idea that radio and nuclear activities are intimately linked with the presence of clumpy dust, and strongly suggest that the disks and filaments are the source of fuel and gas supply for the radio engines lying at the core of the galaxy. If all galaxies have central BHs (as is very likely) and the presence of dust is higher in galaxies that are active, this implies that galaxies have active duty cycles, and that the central supply of gas and dust is the requisite for the onset of the activity.
The probable relationship between the mass/size of the dusty disks and the central velocity dispersion (§2.3), coupled with a similar correspondence between the latter and the central BH mass, suggests that the mass of the disk is connected with that of the BH. If real, it would imply that activity in early-type galaxies may undergo a process of evolution in which dust is acquired, settles, and provides a channel and fuel reservoir that support the growth and activity of the central massive BH. We note, however, that not all galaxies in which a central BH has been found show visibly detectable dusty disk, and not all galaxies with dusty disk are detected, due to projection effects (van Dokkum & Franx, 1995). Thus, the two effects might mitigate each other to some extent.
4 Summary and Conclusions
Confirming previous studies, we find that dust is very common in elliptical studies. Although this result has been noted before, our unbiased and volume-limited sample puts such finding on a better footing. There is a strong correspondence between the presence of dust and the detection of radio and far infrared emission. Among those galaxies with visibly detectable dust, a significant correlation is found between the derived mass of the dust and infrared luminosities, especially when only systems with filamentary dust are considered. At the limit of the survey, dusty galaxies are more than 10 times more likely to have 100 m detection than dustless galaxies, and those with filamentary dust are 4 times more likely to have 100 m detection than those with dusty disks. This result suggests that the 100 m radiation most likely comes from filamentary dust which absorbs UV and visible radiation from the surrounding stars and reradiate it in the far-IR. While it is possible to have detection in 100 m without visually detectable dust (e.g., NGC 2549, NGC 3348), the presence of dust makes the detection much more likely.
Galaxies with detectable, clumpy dust are also much more likely to show nuclear activity in the form of radio and line emission than dustless galaxies. The formation of clumpy dust thus appears to be a necessary ingredient for radio and emission-line activity. However, galaxies with dust in small disky morphology are not any more likely to show such activity than those having irregular, filamentary dust. Nearly all dusty disks are well aligned with the major axes of the galaxies in which they reside, while dust filaments seem to be more randomly oriented. If both types of dust have the same origin, then the dust is most likely acquired externally and requires time to settle dynamically. However, there appears to be no correlation between the presence of dust and the ambient galaxy density. Alternatively, the two types of dust may have different origins. A spectroscopic survey to study the dynamics of a well-defined sample of galaxies is needed to confirm the external or internal origin of dust. The possible relationship between the size of the dusty disks with the central velocity dispersion of the galaxy suggests a causal connection between the BH mass and the mass/size of the dusty disk and bulge.
References
- Barnes & Hernquist (1996) Barnes, J. E., & Hernquist, L. 1996, ApJ, 471, 115
- Barnes & Hernquist (1998) Barnes, J. E., & Hernquist, L. 1998, ApJ, 495, 187
- Bennett & Moss (1998) Bennett, S. M., & Moss, C. 1998, A&AS, 132, 55
- Bertola & Corsini (1999) Bertola, F., & Corsini, E. M. 1999, in IAU Symp. 186: Galaxy Interactions at Low and High Redshift, ed. J. E. Barnes & D. B. Sanders, 186, 149
- Bettoni & Buson (1987) Bettoni, D., & Buson, L. M. 1987, A&AS, 67, 341
- Bower et al. (1998) Bower, G. A. et al. 1998, ApJ, 492, L111
- Bureau et al. (2000) Bureau, M. et al. 2000, in Galaxy Disks and Disk Galaxies, ASP Conference Series, ed. J. G. Funes S. J. & E. M. Corsini, astro-ph/0009332
- Buson et al. (1993) Buson, L. M., Sadler, E. M., Zeilinger, W. W., Bertin, G., Bertola, F., Danzinger, J., Dejonghe, H., Saglia, R. P., & de Zeeuw, P. T. 1993, A&A, 280, 409
- Caldwell (1984) Caldwell, N. 1984, PASP, 96, 287
- Calvani et al. (1989) Calvani, M., Fasano, G., & Franceschini, A. 1989, AJ, 97, 1319
- Caon, Macchetto & Pastoriza (2000) Caon, N., Macchetto, D. & Pastoriza, M. 2000, ApJS, 127, 39
- Cardelli et al. (1989) Cardelli, J. A., Clayton, G. C., & Mathis, J. S. 1989, ApJ, 345, 245
- Condon et al. (1998) Condon, J. J., Cotton, W. D., Greisen, E. W., Yin, Q. F., Perley, R. A., Taylor, G. B., & Broderick, J. J. 1998, AJ, 115, 1693
- Davies et al. (1987) Davies, R. L., Burstein, D., Dressler, A., Faber, S. M., Lynden-Bell, D., Terlevich, R. J., & Wegner, G. 1987, ApJS, 64, 581
- de Koff et al. (2000) de Koff, S., Best, P., Baum, S. A., Sparks, W., Rottgering, H., Miley, G., Golombek, D., Maccheto, F., & Martel, A. 2000, ApJS, 129, 33
- Faber & Jackson (1976) Faber, S. M., & Jackson, R. E. 1976, ApJ, 668, 683
- Faber et al. (1987) Faber, S. M. et al. 1987, in Nearly Normal Galaxies, ed. S. Faber, (New York: Springer), p. 175
- Faber et al. (1997) Faber, S. M. et al. 1997, AJ, 114, 1771
- Ferrarese & Ford (1999) Ferrarese, L., & Ford, H. C. 1999, ApJ, 515, 583
- Ferrarese et al. (1996) Ferrarese, L., Ford, H. C., & Jaffe, W. 1996, ApJ, 470, 444
- Ferrarese & Merritt (2000) Ferrarese, L., & Merritt, D. 2000, ApJ, 539, L9
- Ferrarese et al. (1994) Ferrarese, L., van den Bosch, F. C., Ford, H. C., Jaffe, W., & O’Connell, R. W. 1994, AJ, 108, 1598
- Ferrari et al. (1999) Ferrari, F., Pastoriza, M. G., Macchetto, F., & Caon, N. 1999, A&AS, 136, 269
- Forbes (1991) Forbes, D. A. 1991, MNRAS, 249, 779
- Ford et al. (1997) Ford, H. C., Tsvetanov, Z. I., Ferrarese, L., Kriss, G., Jaffe, W., Harms, R. & Dressel, L. 1997, in Accretion Phenomena and Related Outflows, IAU Coll. No. 163, ed. D. T. Wickramasinghe, G. V. Bicknell, and L. Ferrario, p. 620
- Garcia (1993) Garcia, A. M. 1993, A&AS, 100, 47
- Gebhardt et al. (2000) Gebhardt, K. et al. 2000, ApJ, 539, L13
- Geller & Huchra (1983) Geller, M. J., & Huchra, J. P. 1983, ApJS, 52, 61
- Goudfrooij et al. (1994) Goudfrooij, P., Hansen, L., Jørgensen, H. E., & Nørgaard-Nielsen, H. U. 1994, A&AS, 105, 341
- Goudfrooij & de Jong (1995) Goudfrooij, P., & de Jong, T. 1995, A&A, 298, 784
- Gonzalez (1993) Gonzalez, J. J. 1993, Ph.D. Thesis, University of California, Santa Cruz
- Harms et al. (1994) Harms, R. J. et al. 1994, ApJ, 435, L35
- Ho et al. (1995) Ho, L. C., Filippenko, A. V., & Sargent, W. L. W. 1995, ApJS, 98, 477
- Ho et al. (1997a) Ho, L. C., Filippenko, A. V., & Sargent, W. L. W. 1997a, ApJS, 112, 315
- Ho et al. (1997b) Ho, L. C., Filippenko, A. V., & Sargent, W. L. W. 1997b, ApJ, 487, 568
- Honma (1999) Honma, M. 1999, ApJ, 516, 693
- Huchra & Burg (1992) Huchra, J. P., & Burg, R. 1992, ApJ, 393, 90
- Huchra & Geller (1982) Huchra, J. P., & Geller, M. J. 1982, ApJ, 257, 423
- Jaffe et al. (1994) Jaffe, W., Ford, H. C., O’Connell, R. W., van den Bosch, F. C., & Ferrarese, L. 1994, AJ, 108, 1567
- Kannappan & Fabricant (2000) Kannappan, S. J., & Fabricant, D. G. 2000, AJ, 121, 140
- Kim (1989) Kim, D.-W. 1989, ApJ, 346, 653
- Knapp et al. (1989) Knapp, G. R., Guhathakurta, P., Kim, D. and Jura, M. A. 1989, ApJS, 70, 329
- Kollatschny & Fricke (1989) Kollatschny, W., & Fricke, K. J. 1989, A&A, 219, 3
- Kormendy & Richstone (1995) Kormendy, J., & Richstone, D. O. 1995, ARA&A, 33, 581
- Kwan & Xie (1992) Kwan, J., & Xie, S. 1992, ApJ, 398, 105
- Lauer et al. (1995) Lauer, T. R. et al. 1995, AJ, 110, 2622
- Macchetto et al. (1997) Macchetto, F., Marconi, A., Axon, D. J., Capetti, A., Sparks, W. & Crane, P. 1997, ApJ, 489, 579
- Macchetto et al. (1996) Macchetto, F., Pastoriza, M., Caon, N., Sparks, W. B., Giavalisco, M., Bender, R., & Capaccioli, M. 1996, A&AS, 120, 463
- Martel et al. (2000) Martel, A. R., Turner, N. J., Sparks, W. B., & Baum, S. A. 2000, ApJS, 130, 267
- Martini & Pogge (1999) Martini, P., & Pogge, R. W. 1999, AJ, 118, 2646
- McElroy (1995) McElroy, D. B. 1995, ApJS, 100, 105
- Merluzzi (1998) Merluzzi, P. 1998, A&A, 338, 807
- Neilsen & Tsvetanov (2000) Neilsen, E. H., & Tsvetanov, Z. I. 2000, ApJ, 536, 255
- Phillips et al. (1986) Phillips, M. M., Jenkins, C. R., Dopita, M. A., Sadler, E. M., & Binette, L. 1986, AJ, 91, 1062
- Osterbrock & de Robertis (1985) Osterbrock, D. E., & de Robertis, M. M. 1985, PASP, 97, 1129
- Rest et al. (2001) Rest, A., van den Bosch, F. C., Jaffe, W., Tran, H. D., Tsvetanov, Z., Ford, H. C., Davies, J., & Schafer, J. 2001, AJ, in press, astro-ph/0102286 (Paper I)
- Roberts et al. (1991) Roberts, M. S., Hogg, D. E., Bregman, J. N., Forman, W. R., & Jones, C. 1991, ApJS, 75, 751
- Sadler & Gerhard (1985) Sadler, E. M., & Gerhard, O. E. 1985, MNRAS, 214, 177
- Shields (1991) Shields, J. C. 1991, AJ, 102, 1314
- Sparks et al. (2000) Sparks, W. B., Baum, S. A., Biretta, J., Macchetto, D., & Martel, A. R. 2000, ApJ, 542, 667
- Steiman-Cameron & Durisen (1988) Steiman-Cameron, T. Y., & Durisen, R. H. 1988, ApJ, 325, 26
- Tohline et al. (1982) Tohline, J. E., Simonson, G. F., & Caldwell, N. 1982, ApJ, 252, 92
- Tomita et al. (2000) Tomita, A., Aoki, K., Watanabe, M., Takata, T., & Ichikawa, S. 2000, AJ, 120, 123
- Trinchieri & di Serego Alighieri (1991) Trinchieri, G., & di Serego Alighieri, S. 1991, AJ, 101, 1647
- Tsai & Mathews (1996) Tsai, J. C., & Mathews, W. G. 1996, ApJ, 468, 571
- van den Bosch et al. (1994) van den Bosch, F. C., Ferrarese, L., Jaffe, W., Ford, H. C., & O’Connell, R. W. 1994, AJ, 108, 1579
- van der Marel (1999) van der Marel, R. P. 1999, in Galaxy Interactions at Low and High Redshifts, IAU Symp. No. 186, ed. D. B. Sanders, & J. Barnes, (Kluwer:Dordrecht), p. 333
- van der Marel & van den Bosch (1998) van der Marel, R. P. & van den Bosch, F. 1998, AJ, 116, 2220
- van Dokkum & Franx (1995) Van Dokkum, P. G., & Franx, M. 1995, AJ, 110, 2027
- Verdoes Kleijn et al. (1999) Verdoes Kleijn, G. A., Baum, S. A., de Zeeuw, P. T., & O’Dea, C. P. 1999, AJ, 118, 2592
- Verdoes Kleijn et al. (2000) Verdoes Kleijn, G. A., van der Marel, R. P., Carollo, C. M., & de Zeeuw, P. T. 2000, AJ, 120, 1221
- Verkhodanov et al. (1997) Verkhodanov, O. V., Trushkin S. A., Andernach H., & Chernenkov, V. N. 1997, in Astronomical Data Analysis Software and Systems VI, ASP Conf. Ser., ed. G. Hunt & H. E. Payne, 125, 322
- Véron-Cetty & Véron (1988) Véron-Cetty, M.-P., & Véron, P. 1988, A&A, 204, 28
| Name | Dust | Line Emiss | LGG Group | N | CfA Group | N | Ref | ||||
|---|---|---|---|---|---|---|---|---|---|---|---|
| (1) | (2) | (3) | (4) | (5) | (6) | (7) | (8) | (9) | (10) | (11) | (12) |
| ESO 378-20 | 0 | LGG256 | 7 | … | … | … | |||||
| ESO 437-15 | 3 | N | LGG210 | 6 | … | … | … | BM98 | |||
| ESO 443-39 | 0 | LGG328 | 6 | … | … | … | |||||
| ESO 447-30 | 0 | … | .. | … | … | … | |||||
| ESO 507-27 | 0 | LGG310 | 12 | … | … | … | |||||
| ESO 580-26 | 3 | L | … | .. | … | … | … | OD85 | |||
| IC 875 | 0 | … | .. | … | 2 | … | |||||
| MCG 11-14-25A | 0 | LGG238 | 3 | GH82 | 6 | 0.67 | |||||
| MCG 8-27-18 | 0 | … | .. | … | … | … | |||||
| NGC 2549 | 0 | N | … | 1 | … | 1 | 0 | H97 | |||
| NGC 2592 | 4 | … | .. | … | 3 | … | |||||
| NGC 2634 | 0 | N | LGG160 | 5 | HG90 | 3 | 0.25 | H97 | |||
| NGC 2699 | 4 | LGG164 | 4 | … | … | … | |||||
| NGC 2778 | 0 | Y | LGG171 | 3 | GH43 | 5 | 0.42 | G93 | |||
| NGC 2824 | 3 | … | 1 | … | 1 | 0 | |||||
| NGC 2872 | 4 | … | .. | H99 | 2 | 0.0105 | |||||
| NGC 2902 | 2 | LGG174 | 3 | … | … | … | |||||
| NGC 2950 | 0 | N | … | 1 | … | 1 | 0 | H97 | |||
| NGC 2986 | 0 | N | … | .. | … | 2 | … | G94 | |||
| NGC 3065 | 4 | Y | … | .. | … | 2 | … | BB87, R91 | |||
| NGC 3078 | 4 | Y | LGG185 | 9 | HG29 | 4 | 1.11 | TD91 | |||
| NGC 3193 | 0 | L2: | LGG194 | 13 | GH58 | 10 | 0.20 | H95, H97 | |||
| NGC 3226 | 3 | L1.9 | LGG194 | 13 | GH58 | 10 | 0.20 | H95, H97 | |||
| NGC 3266 | 0 | … | .. | GH63 | 4 | 0.41 | |||||
| NGC 3348 | 0 | Y | LGG224 | 3 | GH69 | 3 | 0.67 | H95 | |||
| NGC 3377 | 1 | Y | LGG217 | 9 | GH68 | 23 | 0.47 | G93, B00 | |||
| NGC 3414 | 1 | L2 | LGG227 | 6 | GH71 | 7 | 0.34 | H95, H97 | |||
| NGC 3595 | 0 | … | .. | … | 2 | … | |||||
| NGC 3613 | 0 | N | LGG232 | 4 | GH94 | 170 | 0.92 | G94, H97 | |||
| NGC 3640 | 0 | N | LGG233 | 6 | GH76 | 7 | 0.23 | H97 | |||
| NGC 4121 | 0 | … | 1 | … | 1 | 0 | |||||
| NGC 4125 | 4 | T2 | LGG274 | 3 | GH94 | 170 | 0.92 | H95, H97 | |||
| NGC 4128 | 0 | LGG272 | 3 | GH99 | 14 | 1.11 | |||||
| NGC 4168 | 2 | S1.9: | LGG285 | 25 | GH106 | 248 | 1.08 | R91, H95, H97 | |||
| NGC 4233 | 4 | Y | LGG278 | 8 | GH106 | 248 | 1.08 | KF89 | |||
| NGC 4291 | 0 | N | LGG284 | 11 | GH107 | 13 | 0.70 | H97 | |||
| NGC 4365 | 0 | N | LGG289 | 63 | GH106 | 248 | 1.08 | S91, TD91, H97 | |||
| NGC 4474 | 0 | LGG289 | 63 | GH106 | 248 | 1.08 | |||||
| NGC 4478 | 0 | N | LGG289 | 63 | GH106 | 248 | 1.08 | G93, H97 | |||
| NGC 4482 | 0 | LGG296 | 11 | GH106 | 248 | 1.08 | |||||
| NGC 4494 | 4 | L2:: | LGG294 | 3 | GH94 | 170 | 0.92 | H95, H97 | |||
| NGC 4503 | 0 | N | LGG289 | 63 | GH106 | 248 | 1.08 | H97 | |||
| NGC 4564 | 0 | N | LGG289 | 63 | GH106 | 248 | 1.08 | G94, H97 | |||
| NGC 4589 | 2 | L2 | LGG284 | 11 | GH107 | 13 | 0.70 | G94, H95, H97 | |||
| NGC 4621 | 0 | N | … | .. | GH106 | 248 | 1.08 | H97 | |||
| NGC 4648 | 4 | N | LGG303 | 7 | GH107 | 13 | 0.70 | H97 | |||
| NGC 5017 | 4 | LGG338 | 9 | … | … | … | |||||
| NGC 5077 | 2 | L1.9 | LGG343 | 3 | … | … | … | M96, H95, H97 | |||
| NGC 5173 | 3 | Y | LGG352 | 4 | H99 | 2 | 0.156 | BB87 | |||
| NGC 5198 | 0 | Y | LGG352 | 4 | H99 | 2 | 0.156 | R91 | |||
| NGC 5283 | 3 | S2 | … | 1 | … | 1 | 0 | HB92 | |||
| NGC 5308 | 0 | N | LGG360 | 8 | GH122 | 13 | 0.63 | H97 | |||
| NGC 5370 | 0 | … | .. | GH122 | 13 | 0.63 | |||||
| NGC 5557 | 0 | N | LGG378 | 3 | GH141 | 13 | 0.02 | H97 | |||
| NGC 5576 | 0 | N | LGG379 | 6 | GH139 | 6 | 0.12 | H97 | |||
| NGC 5796 | 1 | N | LGG390 | 3 | … | … | … | R91 | |||
| NGC 5812 | 4 | Y | … | .. | H99 | 2 | 0.209 | G93, M96 | |||
| NGC 5813 | 4 | L2: | LGG393 | 8 | GH150 | 11 | 0.39 | G93, H95, H97 | |||
| NGC 5831 | 0 | Y | LGG393 | 8 | GH150 | 11 | 0.39 | G93, M96 | |||
| NGC 5846 | 3 | Y | LGG393 | 8 | GH150 | 11 | 0.39 | BB87, B93, G93 | |||
| NGC 5898 | 1 | Y | LGG398 | 5 | … | … | … | R91, M96 | |||
| NGC 5903 | 1 | Y | LGG398 | 5 | … | … | … | M96 | |||
| NGC 5982 | 0 | L2:: | LGG402 | 4 | GH158 | 5 | 0.29 | H95, H97 | |||
| NGC 6278 | 0 | LGG409 | 3 | … | … | … | |||||
| UGC 4551 | 0 | … | 1 | … | 1 | 0 | |||||
| UGC 4587 | 1 | … | 1 | … | 1 | 0 | |||||
| UGC 6062 | 0 | … | 1 | … | 1 | 0 |
Note. — Column (1): Name of the galaxy.
Column (2): Absolute -band magnitude, from Paper I.
Column (3): Total apparent -band magnitude, from Paper I.
Column (4): Distance in Mpc, from paper I.
Column (5): Dust level: 0 = No dust, 1 = Filamentary low, 2 = Filamentary medium, 3 = Filamentary high, 4 = dusty disk.
Column (6): Presence of line emission: Empty entry denotes no observation or no information from literature; N = no line emission detected, Y = emission line detected. Wherever the type of activity has been determined by Ho et al. (1997a), this information is given (LINER: L1.9, L2; Transition object: T2; Seyfert: S1.9, S2). Colons denote uncertainty.
Column (7): Lyon Group of Galaxies (LGG) group number from Garcia (1993).
Column (8): Number of members in LGG group; = 1 if appeared isolated.
Column (9): CfA group number from Geller & Huchra (1983) and Huchra & Geller (1982), or H99 denoting that the galaxy is a member of a galaxy pair in Honma (1999).
Column (10): Number of members in CfA group, or if = 2, indicating that the galaxy is in an interacting pair or having another companion; = 1 if appeared isolated.
Column (11): Mean harmonic radius of the group in Mpc from Geller & Huchra (1983) and Huchra & Geller (1982); if a binary, the separation between the pair.
Column (12): References for emission lines: B93=Buson et al. (1993); B00=Bureau et al. (2000); BB87=Bettoni & Buson (1987); BM98=Bennett & Moss (1998); G93=Gonzalez (1993); G94=Goudfrooij et al. (1994); H95=Ho et al. (1995); H97=Ho et al. (1997a); HB92=Huchra & Burg (1992); KF89=Kollatschny & Fricke (1989); OD85=Osterbrock & de Robertis (1985); M96=Macchetto et al. (1996); R91=Roberts et al. (1991); S91=Shields (1991); TD91=Trinchieri & di Serego Alighieri (1991).
| Name | Morph | (opt) | ||||||
|---|---|---|---|---|---|---|---|---|
| (1) | (2) | (3) | (4) | (5) | (6) | (7) | (8) | (9) |
| ESO 437-15 | F3 | 0.17 | 3.70 | 41 | 42 | 1 | ||
| ESO 580-26 | F3 | 0.21 | 4.42 | 41 | 30 | 11 | ||
| NGC 2592 | D | 0.6 | 34 | 0.093 | 1.53 | 50 | 55 | 5 |
| NGC 2699 | D | 0.6 | 40 | 0.029 | 0.96 | 45 | 45 | 0 |
| NGC 2824 | F3 | 0.16 | 5.00 | 145 | 15 | |||
| NGC 2872 | D | 0.9 | 63 | 0.20 | 2.15 | 155 | 5 | |
| NGC 2902 | F2 | 0.061 | 2.06 | 10 | 112 | 78 | ||
| NGC 3065 | D | 0.5 | 0.10 | 1.28 | ||||
| NGC 3078 | D | 1.4 | 75 | 0.33 | 2.50 | 175 | 4 | |
| NGC 3226 | F3 | 0.13 | 3.35 | 43 | 15 | 28 | ||
| NGC 3377 | F1 | 0.047 | 2.13 | 41 | 50 | 9 | ||
| NGC 3414 | F1 | 0.034 | 1.78 | 01 | 93 | 88 | ||
| NGC 4125 | D | 3.3 | 90 | 0.11 | 3.90 | 72 | 10 | |
| NGC 4168 | F2 | 0.035 | 2.22 | 105 | 23 | |||
| NGC 4233 | D | 5.4 | 90 | 0.52 | 4.42 | 25 | 77 | 52 |
| NGC 4494 | D | 1.6 | 50 | 0.20 | 1.78 | 01 | 10 | 9 |
| NGC 4589 | F2 | 0.073 | 4.00 | 00 | 88 | |||
| NGC 4648 | D | 0.4 | 0.10 | 0.98 | 65 | |||
| NGC 5017 | D | 0.5 | 0 | 0.029 | 1.18 | 32 | ||
| NGC 5077 | F2 | 0.048 | 3.96 | 09 | 102 | 87 | ||
| NGC 5173 | F3 | 0.055 | 3.68 | 115 | 14 | |||
| NGC 5283 | F3 | 0.173 | 4.70 | 109 | 14 | |||
| NGC 5796 | F1 | 0.067 | 3.67 | 16 | 88 | |||
| NGC 5812 | D | 0.4 | 10 | 0.11 | 1.43 | 60 | ||
| NGC 5813 | D | 1.4 | 65 | 0.083 | 3.70 | 150 | 9 | |
| NGC 5846 | F3 | 0.030 | 3.41 | 52 | 27 | |||
| NGC 5898 | F1 | 0.035 | 2.74 | 00 | 70 | |||
| NGC 5903 | F1 | 0.063 | 3.16 | 10 | ||||
| UGC 4587 | F1 | 0.029 | 2.02 | 07 | 05 | 2 |
Note. — Column (1): Galaxy name.
Column (2): Morphology of the dust features: F = filaments, with a number denoting the level of dust as in Paper I; D = dusty disk.
Column (3): Diameter of the dusty disk in arcsec.
Column (4): Inclination of the dusty disk in degrees, derived from the ellipticity and the assumption that the disk is intrinsically circular.
Column (5): Mean visual extinction of the dust features in magnitude.
Column (6): Dust mass in units of log derived from visual extinction of the visible dust features.
Column (7): PA of the major axis of the galaxy measured at 10″.
Column (8): PA of the major axis of the main dust structure.
Column (9): Absolute value of the difference .
| Galaxy | This work | vD&F95aavan Dokkum & Franx (1995) | Tom00bbTomita et al. (2000) |
|---|---|---|---|
| NGC 3377 | 4.2 | 4.8 | |
| NGC 4494 | 3.9 | 4.0 | 5.0 |
| NGC 4589 | 6.1 | 5.8 | 7.0 |
| NGC 5813 | 5.8 | 4.8 | 6.5 |
Note. — The table lists gas mass in logarithmic solar mass units. Previous values were converted using distances adopted in this paper listed in Table 1. A gas-to-dust ratio of 130 has been assumed.
| aaDust temperature in Kelvin, derived from color ratio . When is not available, a temperature of 30K is assumed. | bbDust mass in units of log derived from flux densities and dust color temperature. | ||||||||
|---|---|---|---|---|---|---|---|---|---|
| ESO 437-15 | 0.0035 | 0.0006 | 0.83 | 0.068 | 1.16 | 0.094 | 0.72 | 44.5 | 5.18 |
| ESO 447-30 | 0.30 | 0.042 | 1.44 | 0.100 | 0.21 | 27 | 6.27 | ||
| ESO 580-26 | 0.0037 | 0.0007 | 0.98 | 0.074 | 1.83 | 0.110 | 0.54 | 39.5 | 5.73 |
| NGC 2549 | 0.26 | 0.048 | 0.37 | 0.131 | 0.70 | 44 | 4.07 | ||
| NGC 2634ccInfrared fluxes may likely be contaminated with emission from nearby sources (Knapp et al., 1989). | 0.28 | 0.032 | 0.98 | 0.165 | 0.29 | 30 | 5.77 | ||
| NGC 2778 | 0.00 | 0.041 | 0.51 | 0.096 | 0.00 | 30 | 5.34 | ||
| NGC 2824 | 0.0093 | 0.0005 | 0.94 | 0.074 | 1.51 | 0.100 | 0.62 | 42 | 5.83 |
| NGC 2872 | 0.0074 | 0.0026 | |||||||
| NGC 2902 | 0.16 | 0.040 | 1.04 | 0.183 | 0.15 | 24 | 6.06 | ||
| NGC 2950 | 0.16 | 0.033 | 0.20 | 0.115 | 0.80 | 48 | 3.87 | ||
| NGC 2986 | 0.00 | 0.025 | 0.40 | 0.123 | 0.00 | 30 | 5.25 | ||
| NGC 3065ccInfrared fluxes may likely be contaminated with emission from nearby sources (Knapp et al., 1989). | 0.0045 | 0.0006 | 1.51 | 0.025 | 2.00 | 0.100 | 0.76 | 46 | 5.25 |
| NGC 3078 | 0.3138 | 0.0109 | |||||||
| NGC 3226 | 0.0033 | 0.0005 | |||||||
| NGC 3348 | 0.0083 | 0.0005 | 0.13 | 0.029 | 0.30 | 0.139 | 0.43 | 35 | 5.14 |
| NGC 3377 | 0.14 | 0.045 | 0.35 | 0.065 | 0.40 | 34.5 | 3.98 | ||
| NGC 3414 | 0.0047 | 0.0005 | 0.25 | 0.025 | 0.56 | 0.185 | 0.45 | 36 | 4.73 |
| NGC 4125 | 0.70 | 0.044 | 1.67 | 0.069 | 0.42 | 35 | 5.32 | ||
| NGC 4168 | 0.0060 | 0.0015 | 0.00 | 0.036 | 0.66 | 0.157 | 0.00 | 30 | 5.55 |
| NGC 4233 | 0.0034 | 0.0006 | 0.19 | 0.037 | 0.48 | 0.087 | 0.40 | 34.5 | 5.14 |
| NGC 4365 | 0.00 | 0.044 | 0.65 | 0.131 | 0.00 | 30 | 4.99 | ||
| NGC 4494 | 0.19 | 0.049 | 0.00 | 0.170 | …. | 30 | 4.90 | ||
| NGC 4564 | 0.0025 | ||||||||
| NGC 4589 | 0.0378 | 0.0015 | 0.20 | 0.031 | 0.66 | 0.153 | 0.30 | 31 | 5.42 |
| NGC 5077 | 0.1608 | 0.0057 | |||||||
| NGC 5173 | 0.0032 | 0.0006 | 0.35 | 0.042 | 0.53 | 0.159 | 0.66 | 43.5 | 4.88 |
| NGC 5198 | 0.0040 | 0.0006 | |||||||
| NGC 5283 | 0.0134 | 0.0004 | |||||||
| NGC 5576 | 0.09 | 0.027 | 0.21 | 0.278 | 0.43 | 35 | 4.37 | ||
| NGC 5796 | 0.1100 | 0.0044 | |||||||
| NGC 5812 | 0.002 | ||||||||
| NGC 5813 | 0.0158 | 0.0011 | |||||||
| NGC 5846 | 0.0221 | 0.0014 | |||||||
| NGC 5898 | 0.13 | 0.036 | 0.23 | 0.072 | 0.56 | 40 | 4.46 | ||
| NGC 5903 | 0.0318 | 0.0021 | |||||||
| NGC 5982 | 0.00 | 0.033 | 0.37 | 0.035 | 0.00 | 30 | 5.54 | ||
| NGC 6278 | 0.00 | 0.023 | 0.32 | 0.100 | 0.00 | 30 | 5.43 | ||
| UGC 4587 | 0.14 | 0.028 | 0.94 | 0.061 | 0.15 | 24 | 6.50 |
Note. — (), (), () are the 1400 MHz, 60m and 100m flux densities (and their associated errors) in Jy, respectively.
| Relationship | |||
|---|---|---|---|
| log – log (opt) | 13aaExcluding NGC 3065 | 0.76aaExcluding NGC 3065 | 0.0032aaExcluding NGC 3065 |
| 10 | 0.80 | 0.0075 | |
| log – log (opt) | 13aaExcluding NGC 3065 | 0.57aaExcluding NGC 3065 | 0.044aaExcluding NGC 3065 |
| 11 | 0.63 | 0.040 | |
| log – log (opt) | 18 | 0.21 | 0.41 |
| 13 | 0.43 | 0.15 | |
| log – | 20 | 0.14 | 0.54 |
| 16 | 0.10 | 0.71 | |
| log – | 25 | 0.080 | 0.70 |
| 22 | 0.094 | 0.68 | |
| log – | 20 | 0.44 | 0.051 |
| 15 | 0.42 | 0.12 | |
| – log (opt) | 29 | 0.15 | 0.44 |
| 11bbExcluding NGC 4233 | 0.83bbExcluding NGC 4233 | 0.003bbExcluding NGC 4233 |
Note. — For each pair of variables, the number of data points (), the linear correlation coefficient (), and the probability of the null hypothesis (no correlation, ) are shown in the first line for all galaxies with dusty disks and filamentary dust. The second line shows the results for galaxies with filamentary dust only, except for – log (opt), where it shows the coefficients for galaxies with dusty disks.
| Dusty Disks (12, 15) | Fil Dust (17, 16) | All Dust (29, 31) | No Dust (38, 9) | All Gal (67, 40) | |
|---|---|---|---|---|---|
| EL – snapshot | 8 7 88 | 14 12 86 | 22 19 86 | 21 6 28 | 43 25 58 |
| – | 14 12 86 | 16 12 75 | 30 24 80 | 8 2 25 | 38 26 68 |
| Radio – snapshot | 12 6 50 | 17 13 76 | 29 19 66 | 38 3 8 | 67 22 33 |
| – | 13 8 62 | 16 8 50 | 29 16 55 | 9 2 22 | 38 18 47 |
| Far-IRaaBy definition, the far-IR detection rate for the sample is 100%. – snapshot | 10 4 40 | 15 11 73 | 25 15 60 | 37 11 30 | 62 26 42 |
| Group – snapshot | 12 12 100 | 16 13 81 | 28 25 89 | 36 31 86 | 64 56 88 |
Note. — Detection rate of emission lines (EL), radio emission from NVSS, far-IR emission from survey, and being in a group/cluster/binary pair. For each group, the first number indicates the total number of galaxies with available data, the second number denotes the number of galaxies with detections, and the last number gives the percentage relative to the number of galaxies with available data within that group. Values for the snapshot sample are given in the first line, and for the sample in the second line. The first and second number in parentheses in the heading give the total number of galaxies in each group for the snapshot and sample, respectively.
| Name | Dust | Radio | Line Emiss | Ref | ||
|---|---|---|---|---|---|---|
| (1) | (2) | (3) | (4) | (5) | (6) | (7) |
| ESO 208-G021 | 1037 | 12.19 | 4 | Y | P86 | |
| ESO 358-G059 | 1007 | 13.99 | 0 | N | ||
| IC 1459 | 1691 | 10.97 | 4 | Y | Y | B93, R91, G94 |
| NGC 205(M110) | 241 | 8.92 | 1 | N | N | H97 |
| NGC 404 | 48 | 11.21 | 3 | Y | L2 | R91, H97 |
| NGC 584 | 1875 | 11.44 | 1 | N | Y | M96 |
| NGC 821 | 1718 | 11.67 | 0 | N | N | G93, H97 |
| NGC 1052 | 1470 | 11.41 | 2 | Y | L1.9 | H97 |
| NGC 1339 | 1392 | 12.51 | 0 | N | N | R91 |
| NGC 1351 | 1511 | 12.46 | 0 | N | N | P86 |
| NGC 1399 | 1425 | 10.55 | 0 | Y | Y | G94, M96 |
| NGC 1400 | 558 | 11.92 | 2 | Y | N | M96 |
| NGC 1404 | 1947 | 11.92 | 1 | Y | N | G94 |
| NGC 1439 | 1670 | 12.27 | 4 | N | N | R91 |
| NGC 2768 | 1339 | 10.84 | 4 | Y | L2 | H97 |
| NGC 2778aaAlso in the snapshot sample. | 2032 | 13.35 | 0 | N | Y | G93 |
| NGC 2974 | 2072 | 11.87 | 3 | Y | Y | R91 |
| NGC 2986aaAlso in the snapshot sample. | 2329 | 11.72 | 0 | N | N | G94 |
| NGC 3156 | 1118 | 13.07 | 2 | N | Y | BB87 |
| NGC 3377aaAlso in the snapshot sample. | 692 | 11.24 | 1 | N | Y | G93, B00 |
| NGC 3610 | 1787 | 11.70 | 3 | N | Y | G94 |
| NGC 4125aaAlso in the snapshot sample. | 1356 | 10.65 | 4 | N | T2 | H97 |
| NGC 4168aaAlso in the snapshot sample. | 2284 | 12.11 | 2 | Y | S1.9 | R91, H97 |
| NGC 4261 | 2210 | 11.14 | 4 | Y | L2 | G93, H97 |
| NGC 4278 | 649 | 11.09 | 3 | Y | L1.9 | R91, H97 |
| NGC 4365aaAlso in the snapshot sample. | 1240 | 10.52 | 0 | N | N | S91, TD91, H97 |
| NGC 4374(M84) | 1000 | 10.09 | 4 | Y | L2 | H97 |
| NGC 4406(M86) | 227 | 9.83 | 4 | N | N | H97 |
| NGC 4476 | 1978 | 13.01 | 3 | N | N | R91 |
| NGC 4486(M87) | 1282 | 9.59 | 4 | Y | L2 | H97 |
| NGC 4552(M89) | 321 | 10.73 | 4 | Y | T2: | H97 |
| NGC 4589aaAlso in the snapshot sample. | 1980 | 11.69 | 2 | Y | L2 | G94, H97 |
| NGC 4649(M60) | 1413 | 9.81 | 0 | Y | N | H97 |
| NGC 4697 | 1236 | 10.14 | 4 | N | Y | G93 |
| NGC 4742 | 1270 | 12.12 | 3 | N | Y | R91 |
| NGC 5128(Cen A) | 547 | 7.84 | 4 | Y | Y | P86 |
| NGC 5322 | 1915 | 11.14 | 4 | Y | L2:: | H97 |
| NGC 5845 | 1450 | 13.50 | 4 | N | ||
| NGC 5898aaAlso in the snapshot sample. | 2209 | 12.49 | 1 | N | Y | R91, M96 |
| NGC 6861 | 2819 | 12.12 | 4 | Y | P86 |
Note. — Column (1): Name of the galaxy.
Column (2): Heliocentric velocity in km s-1.
Column (3): Total apparent -band magnitude.
Column (4): Dust level as in Table 1.
Column (5): Radio detection at 1.4 Ghz from NVSS or FIRST survey.
Column (6): Presence of line emission.
Column (7): References for emission lines as in Table 1; also P86=Phillips et al. (1986).