The Host Galaxy and the Environment of the z = 1.195 Quasar 3C 190111Based on observations made with the NASA/ESA Hubble Space Telescope, obtained from the data archive at the Space Telescope Science Institute, which is operated by the Association of Universities for Research in Astronomy, Inc., under NASA contract NAS 5-26555.
Abstract
We present deep imaging and spectroscopic observations of the quasar 3C 190 and its immediate environment. The quasar is surrounded by an asymmetric low-surface-brightness envelope in which there are also several galaxies with characteristic dimensions of 3–5 kpc. Some of these form a linear structure some 50 kpc long in projection, offset from the quasar and almost perpendicular to the radio axis. Spectroscopy of this feature indicates the presence of a starburst component as well as stars a few years old. Velocities of the emission-line gas associated with H II regions in the linear feature are difficult to reconcile with any reasonable model that is also consistent with the observed morphology. One possible scenario is an edge-on disk in an extremely massive () halo; another is two independent chain galaxies, with the apparent alignment being fortuitous. Taking into account all of the types of extended material we find in the vicinity of 3C 190, we appear to be witnessing a relatively brief phase in the development of a spheroidal galaxy, in which merging is proceeding nearly simultaneously in a variety of different regimes. This system may be one of the clearest examples yet found for the mechanism by which many elliptical galaxies and bulges of early-type spirals form in the early Universe.
1 Introduction
Strong radio sources at low redshift are invariably found in massive galaxies with dominant spheroidal components. At higher redshifts (), the observed optical/IR morphologies appear to be less regular: they often show elongations in the direction aligned with the radio axis (the “alignment effect”: Chambers et al., 1987; McCarthy et al., 1987; Chambers & Miley, 1990), and they tend also to be complex, comprising several discrete components. Nevertheless, there is little doubt that powerful radio galaxies and quasars at high redshifts are among the precursors of the elliptical-galaxy population at later epochs; in particular, the tight correlation between black hole mass and stellar velocity dispersion in bulge populations (Ferrarese & Merritt, 2000; Gebhardt et al., 2000) points strongly in this direction. Provided that the aligned structure and the multiple components are not simply effervescent froth in comparison to the galaxy as a whole, they may tell us something about the formation and evolution of elliptical galaxies.
The quasar 3C 190 has been classified as a compact-steep-spectrum (CSS) radio source; it is also a member of the class of “red” quasars, whose optical/IR continua fall steeply towards shorter wavelengths (Smith & Spinrad, 1980; Simpson & Rawlings, 2000). These two properties have each often been taken to indicate systems having high densities of gas and dust. We discuss here imaging and spectroscopic observations of 3C 190 that show that it lies in an unusually rich environment and that we may be witnessing one particular example of an important phase in the process of formation of massive spheroids.
2 Observations and data reduction
2.1 HST Imaging
The HST images were obtained with WFPC2, with the F702W filter. In the rest frame of the quasar, this filter covers the region from 2700 Å to 3580 Å (half-transmission points), which will generally be free of strong emission, except for broad Mg II emission in the quasar itself. The system response is about 20% of the peak at the wavelength of the [O II] doublet. The quasar was placed close to the center of WFC3, and 8 1000 s exposures were obtained in a 4-point dither pattern, moving the telescope after every pair of exposures. After standard pipeline reduction, the individual exposures were processed as described by Ridgway & Stockton (1997); final averaging of the images was done with the STSDAS task gcombine.
2.2 Groundbased Imaging
We have obtained imaging of 3C 190 with the Keck I telescope and the Near-Infrared Camera (NIRC; Matthews & Soifer, 1994), with the Keck II telescope and the Low-Resolution Imaging Spectrometer (LRIS; Oke et al., 1995), and with the Canada-France-Hawaii telescope (CFHT) and the Subarcsecond Imaging Spectrograph (SIS).
The NIRC imaging, with the filter, consisted of a total of 1080 s of exposure on 3C 190 and 72 s of exposure on a brighter PSF reference star. The observations were processed using standard IR reduction techniques. The flat-fielding was done using twilight-sky images, and the calibration was determined from observations of standard stars GD 71 and M 16-A14 (Casali & Hawarden, 1992).
The LRIS imaging observations used a Schott RG-850 filter, which, together with the Tektronix CCD cutoff, gave a bandpass ( Å, FWHM = 1000 Å) very similar to that of the Sloan band. A total of 4200 s of useful exposure was obtained. The CCD images were reduced via standard IRAF tasks, using a sky flat derived from a median average of the dithered exposures, with objects masked out. The calibration was determined from observations of the spectrophotometric standard star Feige 67 (Massey & Gronwall, 1990). The weighted mean flux density of the standard was found by integrating the flux density of the standard over the normalized filter profile.
The SIS imaging on CFHT used a filter with a FWHM of 35 Å centered at 8196 Å to isolate the [O II] emission doublet at the redshift of 3C 190. The total exposure was 9300 s. Again, standard CCD reduction procedures were used, with a flat-field determined from exposures on a tungsten-halogen source illuminating the inside of the dome and a calbration from images of the spectrophotometric standard star G191B2B (Massey & Gronwall, 1990). While we have not attempted to subtract off the continuum component, the narrow bandpass ensures that there is very little continuum contamination.
2.3 Keck LRIS Spectroscopy
On four occasions, we obtained spectroscopy either of 3C 190 or of material surrounding it with LRIS on Keck II. The detector was a Tektronix CCD. All spectroscopy was done using 1″-wide slits; the remaining details are given in Table 1.
| Object | PA | Offset | Dispersion | Integration | UT Date | |
|---|---|---|---|---|---|---|
| (deg) | (arcsec) | (Å pixel-1) | (s) | (Å) | ||
| Linear Feature | 1.6 W | 1.28 | 3600 | 8012 | 97 Oct 06 | |
| Galaxies to N | 2.2 N | 1.28 | 7200 | 7995 | 98 Feb 15 | |
| 3C 190 | 0.0 | 1.28 | 600 | 7995 | 98 Feb 15 | |
| Linear Feature | 1.6 W | 1.28 | 6000 | 7999 | 98 Feb 17 | |
| Linear Feature | 1.6 W | 2.44 | 4800 | 6351 | 98 Mar 21 | |
| 3C 190 | 0.0 | 2.44 | 173 | 6351 | 98 Mar 21 | |
| 3C 190 | 0.0 | 0.0 | 2.44 | 1200 | 6350 | 98 Apr 06 |
3 Results and Interpretation
3.1 Imaging
The results of both the HST and the ground-based imaging are shown in Fig. 1. The HST WFPC2 image and the Keck NIRC image have been described briefly by Stockton (1999).
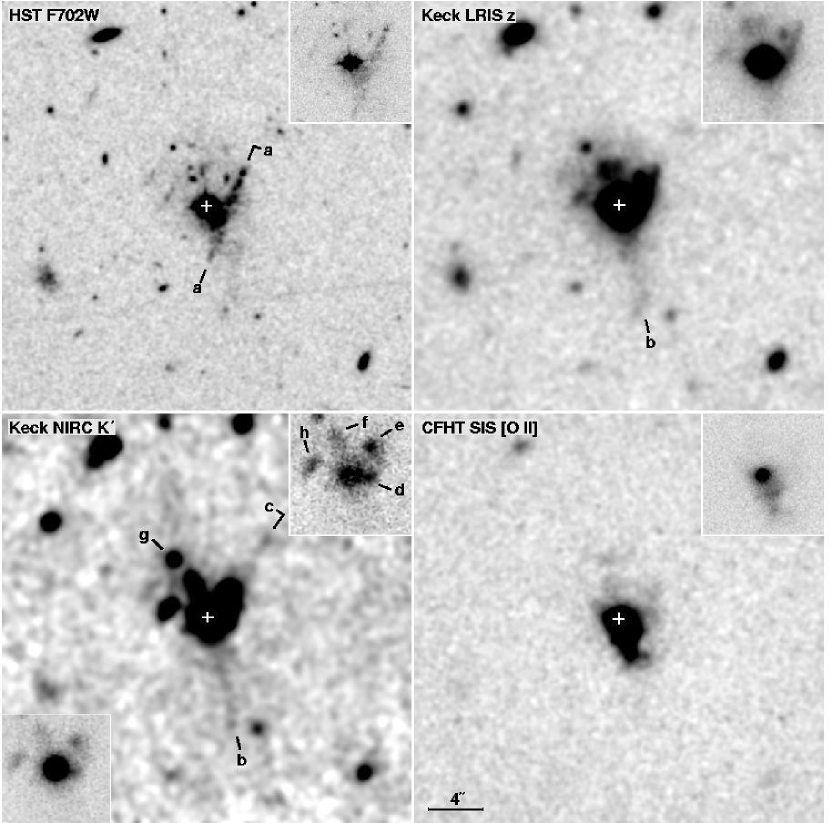
The most striking feature in the HST WFPC2 image is the linear alignment of luminous knots (), extending south-southeast to north-northwest. This feature does not pass through the quasar image, but its centerline comes within at its closest point on the southwest side of the quasar. The three “knots” apparent on the northwest end of the linear feature each have , corresponding to (we assume km s-1 Mpc-1, , and throughout this paper); if this light is due to stars, these objects each would have the luminosity of a substantial galaxy. There is also a close grouping of faint objects to the north of the quasar, seemingly embedded in a general extended low-surface-brightness haze, which also extends somewhat around to the west, culminating in a narrower finger to the south. The linear feature is also present in the Keck LRIS image, although it is of course not as clearly defined because of the lower resolution. However, the diffuse material to the north is quite clearly seen; the south-pointing “finger” appears here to extend directly towards the quasar, whereas, in the WFPC2 image, it seems to project back to the west side of the quasar. The NIRC image agrees with the image in this respect. It also shows a faint apparent extension () to the north-northwest of the linear feature. On the other hand, the linear feature itself near the quasar, so clearly defined in the WFPC2 image, is not present at all in the image, although the bright knot west of the quasar lies right in the middle of it. The diffuse material north of the quasar is still present at , and four of the faint objects projected on it (, , , and ) now dominate the others.
The extended material looks quite different in [O II] emission, although there are some connections with features seen on the continuum-dominated images. The strong extension to the south is aligned with the “finger” seen in the and images. The strongest off-nuclear [O II] emission occurs in the same region as the strong diffuse continuum emission seen southwest of the quasar in the WFPC2 image, which is also close to the tangent point of the linear feature. Faint diffuse emission is present to the north and northwest, some of which may be associated with discrete features seen in the continuum images.
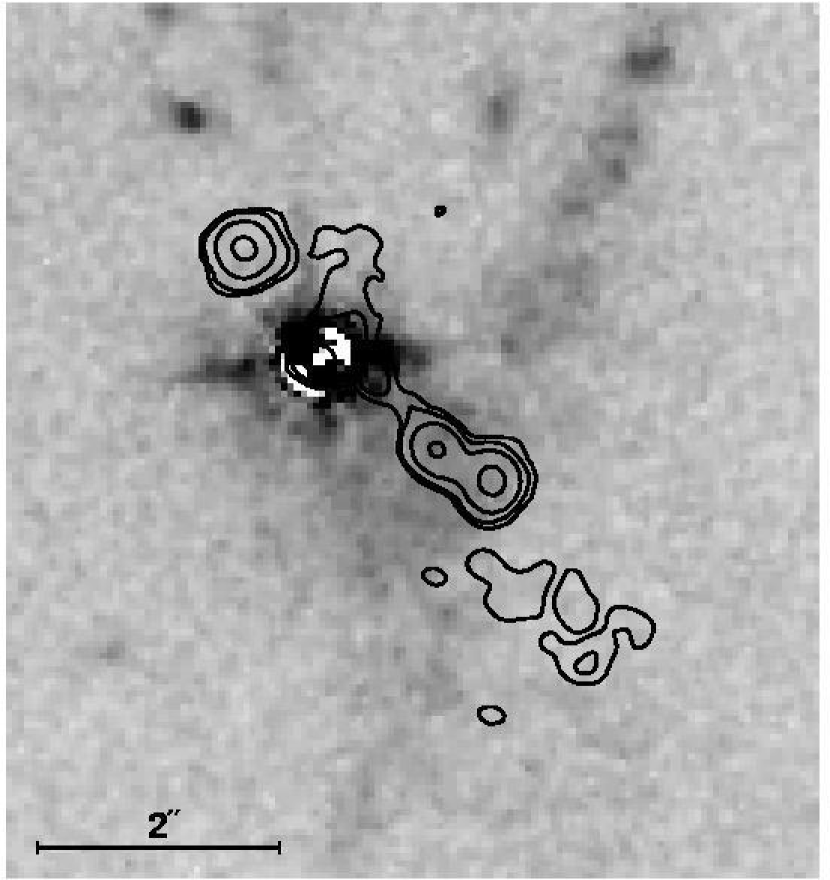
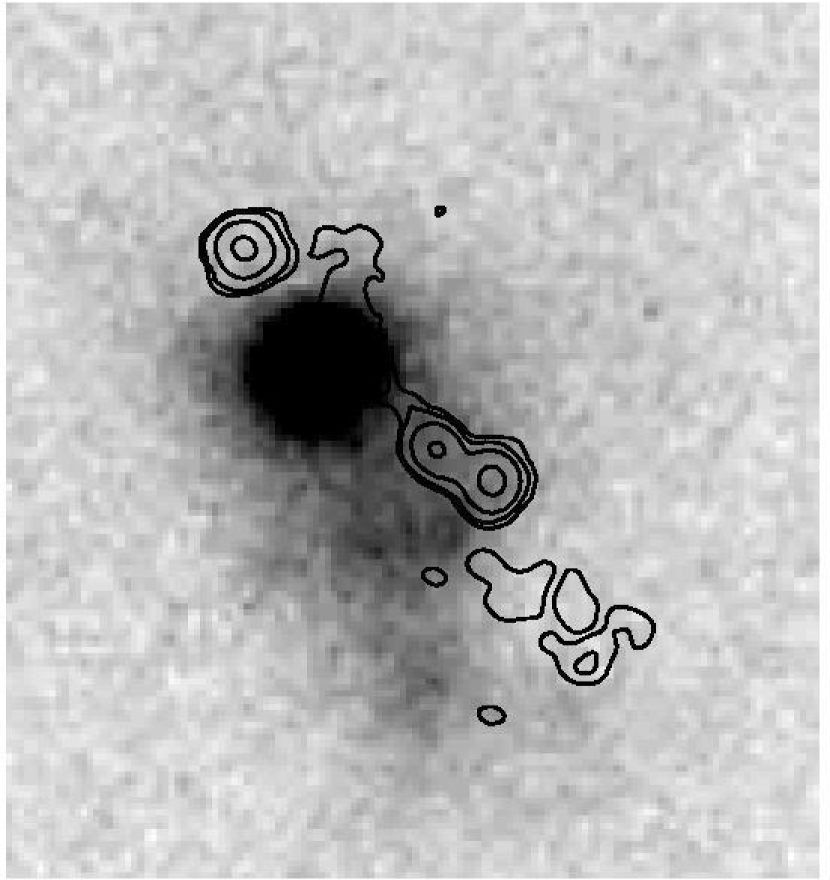
3C 190 is often regarded as a compact steep-spectrum (CSS) source (e.g., de Vries et al., 1999, and references therein); however, the radio morphology is that of well defined double source with a projected separation of 26 (Spencer et al., 1991), corresponding to kpc, so 3C 190 can be thought of as a small classical double source, especially considering likely projection effects. The radio contours are superposed on the WFPC2 and [O II] images in Fig. 2. While the southwest hotspot and associated radio jet fall in a region of diffuse emission near the point of closest approach of the linear feature to the quasar, there is no clear correlation between the radio and optical structure on the WFPC2 image. Some of the strong [O II] emission to the south of 3C 190 appears to fall along the south-eastern side of the radio jet, but the correlation is not so strong that a physical association between the two is compelling, at least from the imaging data alone.
The evidence from the images indicates that we may be seeing merging processes on at least two levels going on simultaneously. The luminous extension to the south, seen best in the and images, has the appearance of a major tidal tail, and the extension to the north-northeast may be a second such feature. In fact, the geometry of these possible tails, as seen on the image, bears a strong resemblence to the local merger NGC 7252 (Schweizer, 1982). However, in addition to this evidence for a major merger, the diffuse luminous material and many small galaxies to the north also appear to be poised to merge with the host galaxy of 3C 190.
There remains the 50-kpc-long linear feature seen in the WFPC2 and images, which comprises clumps having luminosities and dimensions similar to those of the many small galaxies in the vicinity. Is it truly a linear object, similar to the so-called “chain galaxies” (e.g., Cowie et al., 1995) found to be fairly common at high redshifts? Or could it be a large edge-on disk galaxy, where the peak seen in the image just to the west of the quasar is the nucleus, which is hidden by dust at shorter wavelengths? We turn now to the spectroscopic observations, from which we can hope to investigate both the nature and the kinematics of the emitting material.
3.2 Spectroscopy
The slit positions for all of the spectra except those of the quasar itself are shown in Fig. 3.

3.2.1 The quasar spectrum
The spectrum of the quasar is shown in Fig. 4.

The decline in the continuum towards the UV is apparent, consistent with the classification of 3C 190 as a “red” quasar (Smith & Spinrad, 1980). There are also a number of newly detected absorption lines in the spectrum, including a very strong Mg II pair at close to the quasar rest frame, which clearly may be produced by gas associated both with the dust that is responsible for reddening the quasar and with some of the extended structure we see in our images. From narrow [Ne III] , [O II] ,3729, and C III] , we obtain a quasar redshift of . The strong Mg II absorption has a redshift of , so it has a radial velocity of km s-1 in the quasar frame. Other prominent lines in this same system include Mg I and Fe II ,2382,2586,2599.
3.2.2 The linear feature
The region around the [O II] doublet in our best two-dimensional spectrum of the linear feature (that of UT 1998 Feb 17) was deconvolved using a kernel generated from the continuum of the quasar (for the spatial dimension) and the profile of a strong airglow line (for the spectral dimension). After deconvolution, the image was restored with a Gaussian profile with pixel. The result is shown in Fig. 5.
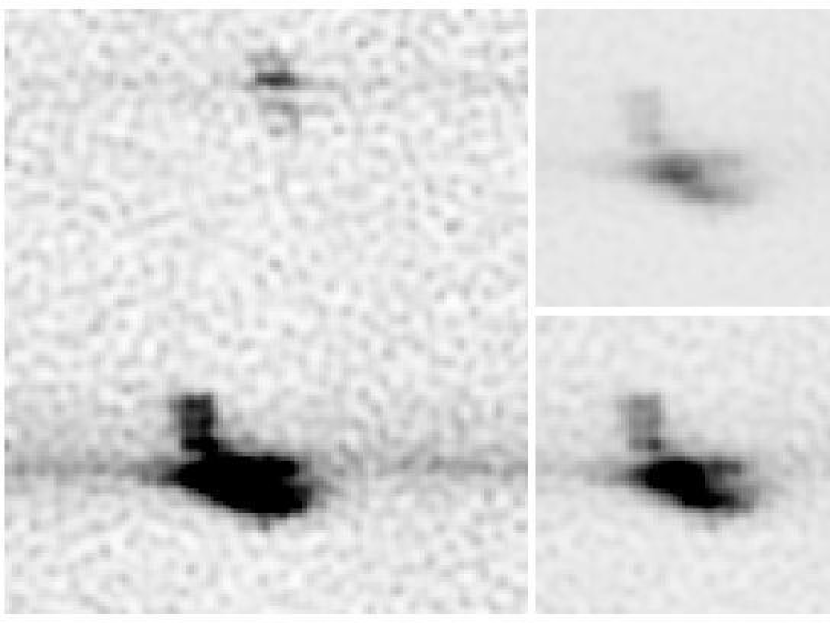

Figure 6 shows velocities derived from this spectrum. The line profiles divide into two groups: those with internal velocities with km s-1, which likely are due either to star formation or photoionization by the quasar of quiescent gas, and those with km s-1, which probably indicates gas that has been shocked in some way by interaction with the radio jet plasma. The low-velocity-dispersion gas shows an abrupt velocity dislocation at the position of the main gap in the linear feature, which corresponds to component in the image. The overall impression (as traced by the dashed lines in Fig. 6) is that of a disk rotation curve, but with a velocity amplitude twice that of typical giant disk galaxies in the local Universe. Alternatively, the velocities could represent bipolar outflow (or infall), or they could simply mean that the two parts of the so-called linear feature are distinct and separate objects.
The summed spectrum of the linear feature to the northwest of the gap is shown as the solid trace at the top of the left panel in Fig. 7. There are at least two remarkable features of this spectrum: the inflection in the slope of the continuum near the position of the [O II] doublet, and the absence of any evidence for H emission. We consider this second point first.

Although the only emission obvious in this spectrum besides the [O II] doublet is the [Ne III] line, the ratio of [Ne III] to [O II] intensities (0.14) is quite consistent with that found in moderately high ionization H II regions; e.g., the giant H II region in the LMC, 30 Doradus, has a ratio of 0.16 (Kennicutt et al., 2000). If we take 30 Doradus and two other H II regions listed by Kennicutt et al. (2000) as having [Ne III]/[O II] ratios similar to that we find for 3C 190, the average [O II]/H intensity ratio is . On the other hand, some H II regions in the sample of Kennicutt et al. (2000) have [O II]/H intensity ratios ranging up to (and even slightly beyond), so we use this value to calculate a rough lower limit to the expected H intensity. Taking this lower limit as the actual intensity, and assuming Case B recombination for a temperature of K, we can construct a template emission-line spectrum consisting of the Balmer lines, the [O II] ,3729 doublet, and the [Ne III] ,3967 lines (where we simply fit Gaussian profiles to the forbidden lines and use the fact that the ratio of the [Ne III] photon flux to that of the line is set by atomic parameters to be 1:3). We subtract this template from the original spectrum.
At this point we could attempt to fit this residual with some combination of scattered quasar radiation and stellar spectral synthesis models. Unfortuately, the broad Mg II line in the quasar spectrum does not prove to be a useful constraint on the amount of scattered light because of its relatively low equivalent width with respect to the S/N in the spectrum of the linear feature. A better constraint can be obtained by comparing the flux density from knots in the linear structure with that of direct radiation from the quasar. Assuming the depth along the line-of-sight is comparable to the characteristic diameter in the plane of the sky, and assuming 100% scattering efficiency of the incident quasar light, we find the contribution of scattered quasar light to be % of the total observed continuum. As the actual scattering efficiency is likely to be more like 20% at best, and projection effects may be important, we are almost certainly safe in ignoring this scattered contribution.
Assuming, then, that the residual continuum is dominated by stellar radiation, we obtain a fair fit over most of the range with a solar-metallicity stellar population with an age of years, but there remains a steep dropoff shortward of 2500 Å. We can do considerably better by using a two-component stellar population, as shown in the left panel of Fig. 7, but, if we optimize the fit over the 2500–4200 Å region, the residual still has too little flux below 2500 Å. This shortage is at least partly caused by an apparent dip between 2100 Å and 2400 Å, which can be seen at some level in the original data. This dip is very likely the 2175 Å dust extinction feature found in the Galactic extinction law, although Calzetti et al. (1994) found it to be generally absent in a sample of 39 starburst galaxies. We model the extinction by taking the Galactic extinction law, modified by including isotropic scattering (see Calzetti et al., 1994, Fig. 10), and then normalizing this curve to the Calzetti et al. (1994) effective extinction curve for wavelengths far from the 2175 Å feature. We then adjust the optical depth to achieve the best cancellation of the feature (in the spectrum as originally observed), as judged by eye. The resulting corrected spectrum is shown as the upper trace in the right panel of Fig. 7. We now repeat the fitting and subtraction of emission lines and nebular thermal continuum, as described above. We fit the remaining continuum as the sum of two spectral synthesis models: one with an age of 2 Myr, and one with an age of 360 Myr. The residual from subtracting the nebular component and the two stellar components from the extinction-corrected spectrum is shown in the bottom right panel of Fig. 7.
The many uncertainties of this exercise, particularly in estimating both the wavelength dependence and the amplitude of the extinction correction, prevent us from claiming any quantitative validity for the results. However, we believe that certain qualitative results are fairly robust: (1.) The inflection in the observed continuum indicates the presence of a few-hundred-Myr-old population, whose Balmer absorption lines are partially masked by emission lines. The inflection is present in the data before the extinction correction; while the age of this component is dependent on the amount of extinction and the modeling of any younger population, it almost certain has to be in the range 2– years. (2) There is a significant level of extinction. This conclusion is based on the difficulty of obtaining a satisfactory fit to the observed spectrum using spectral synthesis models and the evidence for a dip near 2200 Å. (3) A very young stellar component is present, consistent with current ongoing star formation. This component is required to obtain a decent fit to the spectrum, particularly if any significant extinction is included, and it would provide the most logical source of ionization for the observed emission-line spectrum. Nevertheless, (4) this actively starforming component comprises only a small fraction of the stellar mass (the formal value for our specific model is %). If our model is close to being accurate, we estimate a total stellar mass of for each of the three brightest regions.
3.2.3 Other galaxies associated with 3C 190
There are a number of galaxies clustered around 3C 190, mostly to the north. The brightest of these have . Three galaxies very close to 3C 190 are detected and well-resolved on all three of our broad-band images, and their SEDs are shown in Fig. 8.

Of these, galaxy comes close to fitting an essentially unreddened old stellar population at the quasar redshift, whereas galaxies and would be consistent with reddened younger populations.
One of our slit positions from 1998 February 15 covered two of the galaxies north of 3C 190 as well as the northern part of the linear feature (see Fig. 3). The eastern of these is seen on the HST image to be part of a close triplet, which is included within the diffuse object labeled in the Keck NIRC image (Fig. 1). This object shows [O II] emission at , on an extremely weak continuum. The other galaxy was in Fig. 1 (see also Fig. 8); it has a stronger continuum, with a slight slope upwards towards the red across the rest-frame UV range, and it shows [O II] and [Ne III] emission at . The faint emission-line galaxy ″ to the northwest and fortuitously on our slit placed through the linear feature (see Fig. 5) has . (It also has very high ionization, with [Ne V] as strong as [Ne III] .)
These observations indicate that we can safely assume that most of the dozen or so small galaxies within ″ ( kpc) radius of 3C 190 are associated, and it is likely that many at larger distances are as well. The galaxies in the immediate vicinity of the quasar host form a compact group which must almost certainly shortly merge with it.
We can make an estimate of the total stellar mass in all of the objects in the immediate vicinity of 3C 190 from the PSF-subtracted image. We use a 4″-radius aperture, centered 08 east and 16 north of the quasar, which includes the quasar host galaxy as well as objects –. If we assume that there is no significant extinction at this wavelength (restframe 9600 Å) and that the stellar population can be modelled as a single burst 5 Gyr old with a Salpeter initial mass function, we will have a fairly firm lower limit to the stellar mass. By scaling a Bruzual & Charlot (1996) model to the observed flux density, we obtain a mass of . The mass obtained is not too sensitive to the age of the stellar population for ages Gyr; e.g., if we assume an age of 1 Gyr, we only double the mass. Very little of the mass can be in stars much younger than 1 Gyr unless the extinction in regions containing such stars is extremely high. If our quasar PSF subtraction is reasonably accurate, the fraction of the stellar mass within 1″ (= 8 kpc) of the quasar (corresponding roughly to the quasar host galaxy) is .
4 Discussion
4.1 Summary and Interpretation of the Observations
There is a bewildering variety of phenomena found in the vicinity of 3C 190, and the manner in which each relates to the rest is not at all obvious. We summarize here the main features and what we take to be their most plausible interpretations.
The narrow, low-surface-brightness features and are seen best in the Keck image but are also visible in the image. If these are tidal tails, as seems possible, they indicate a past major merger.
The tight grouping of small galaxies, mostly on the north side, is projected on low-surface-brightness extended material (seen best on the HST and images). Our spectroscopy shows that at least two of these are associated with 3C 190, and the high local density of these objects suggests that most of the others are associated as well. The richness and compactness of this group indicates that the 3C 190 host galaxy is subjected to a continuing rain of minor (and some fairly major) mergers.
The high surface brightness, high-velocity-dispersion emission-line gas extends mostly to the south. It appears to start out in almost the same direction as the low-surface-brightness feature , but it is probably associated instead in some way with the radio emission, though it is only loosely correlated with it in position.
The long linear feature remains enigmatic, even though we have learned quite a bit about its stellar content and velocity structure. It is still well defined in our image, which is dominated by light longward of 4000 Å in the rest frame. This means that the stars a few years old that we find in our spectroscopy of the feature are dynamically associated with it, rather than being part of the general diffuse background seen around the quasar. At shorter wavelengths, the feature is dominated by the large star-forming complexes that provide the ionization for the low-velocity-dispersion (LVD) gas. It is the apparent velocity structure for this LVD gas that makes the interpretation of this feature difficult. The velocity curve is consistent with that of a disk embedded in an extremely massive halo ( within a 25 kpc radius); but the combination of the extreme rarity of such objects, the association with (but clear offset from) 3C 190, and the necessity that we would be observing the object almost exactly edge on, makes this interpretation difficult to accept. Collimated outflow makes even less sense, given the clear indication of a significant mass of stars and the fact that the supposed outflow would have to originate, not at the quasar, but at or near object . On the whole, a close connection with the “chain galaxies” seen frequently at high redshift (Cowie et al., 1995) seems most likely, although these are themselves poorly understood. Furthermore, this interpretation does nothing to explain the observed velocity structure. If the feature is interpreted as two separate chain galaxies at different velocities, then their alignment with each other would be fortuitous. A remaining, but remote, possibility is that the LVD [O II] emission at the northwest and southeast ends of the feature have independent physical origins, the former being the result of young stars, the latter perhaps being due to precursor ionization from shocks associated with the radio jet.
4.2 The Formation of Ellipticals
A prediction of the standard cold dark matter (CDM) scenario for galaxy formation is that small baryonic structures form first and then merge to form larger structures. But a persistent problem of the simplest “building-block” models, when applied to the formation of spheroids, is the observed correlation between luminosity and color in present-day ellipticals and bulges, implying a correlation between mass and metallicity (e.g., Bower, Lucey, & Ellis, 1992; Ellis et al., 1996). If, for example, most of the stars now in cluster ellipticals were already formed in dwarf-galaxy-sized systems, how would the stars acquire the metallicities characteristic of the mass of the galaxy into which they would eventually be incorporated? In fact, if the “building blocks” are both small and isolated at the time they form most of their stars, they will not easily retain the enriched gas needed to form the later generations of higher metallicity stars.
What we can see happening around 3C 190 is indeed the formation of a large number of galaxies with a range of sizes. Some, such as the emission-line galaxy fortuitiously found on our slit some 20″ from 3C 190 may simply indicate that 3C 190 is in a rich environment, possibly a cluster in formation. Others, closer in, appear to be in the process of merging with the 3C 190 host galaxy. But these latter are not isolated entities: some objects are incorporated into a coherent structure with a characteristic dimension of kpc (whether a disk, chain galaxy, or something else); others appear to be distributed more randomly, but they are still found within a common luminous envelope. This means that the star formation in these individual building blocks is likely taking place within an already established potential well sufficiently deep to retain the enriched gas for successive generations of star formation. Furthermore, we have observational evidence within the star-forming regions of the linear feature for at least one major previous generation of stars.
All of this means that the distinction between a monolithic picture of bulge or elliptical-galaxy formation à la Eggen, Lynden-Bell, & Sandage (1962) and the bottom-up CDM view may not be as clear cut as is sometimes supposed. In the objects within the immediate environment of 3C 190, processes of star formation and assembly into larger aggregates appear to overlap in time and to influence each other, leading to complex feedback processes during the formation of what almost certainly will become an elliptical or cD galaxy at the present epoch.
References
- Bower, Lucey, & Ellis (1992) Bower, R. G., Lucey, J. R., & Ellis, R. S. 1992, MNRAS, 254, 601
- Bruzual & Charlot (1996) Bruzual A., G. & Charlot, S. 1996, unpublished [ftp://gemini.tuc.noao.edu/pub/charlot/bc96]
- Calzetti et al. (1994) Calzetti, D., Kinney, A. L., & Storchi-Bergmann, T. 1994, ApJ, 429, 582
- Casali & Hawarden (1992) Casali, M. M., & Hawarden, T. G. 1992, UKIRT Newsletter, 4, 33
- de Vries et al. (1999) de Vries, W. H., O’Dea, C. P., Baum, S. A., & Barthel, P. D. 1999, ApJ, 526, 27
- Chambers et al. (1987) Chambers, K. C., Miley, G. K., & van Breugel, W. 1987, Nature, 329, 604
- Chambers & Miley (1990) Chambers, K. C., & Miley, G. K. 1990, The Evolution of the Universe of Galaxies, ed. R. G. Kron, (San Francisco: Astronomical Society of the Pacific), p. 373
- Cowie et al. (1995) Cowie, L. L., Hu, E. M., & Songaila, A. 1995, AJ, 110, 1576
- Eggen, Lynden-Bell, & Sandage (1962) Eggen, O. J., Lynden-Bell, D., & Sandage, A. R. 1962, ApJ, 136, 748
- Ellis et al. (1996) Ellis, R. S., Colless, M., Broadhurst, T., Heyl, J., & Glazebrook, K. 1996, MNRAS, 280, 235
- Ferrarese & Merritt (2000) Ferrarese, L., & Merritt, D. 2000, ApJ, 539, L9
- Gebhardt et al. (2000) Gebhardt, K., et al. 2000, ApJ, 539, L13
- Kennicutt et al. (2000) Kennicutt, R. C., Jr., Bresolin, F., French, H., & Martin, P. 2000, ApJ, 537, 589
- McCarthy et al. (1987) McCarthy, P. J., van Breugel, W., Spinrad, H., & Djorgovski, S. 1987, ApJ, 321, L29
- Massey & Gronwall (1990) Massey, P., & Gronwall, C. 1990, ApJ, 358, 344
- Matthews & Soifer (1994) Matthews, K., & Soifer, B. T. 1994, in Infrared Astronomy with Arrays: the Next Generation, ed. I. McLean (Dordrecht: Kluwer), p. 239
- Oke et al. (1995) Oke, J. B., et al. 1995, PASP, 107, 375
- Ridgway & Stockton (1997) Ridgway, S. E., & Stockton, A. 1997, AJ, 114, 511
- Schweizer (1982) Schweizer, F. 1982, ApJ, 252, 455
- Simpson & Rawlings (2000) Simpson, C., & Rawlings, S. 2000, MNRAS, in press [astro-ph/0005570]
- Smith & Spinrad (1980) Smith, H. E., & Spinrad, H. 1980, ApJ, 236, 419
- Spencer et al. (1991) Spencer, R. E., et al. 1991, MNRAS, 250, 225
- Stockton (1999) Stockton, A. 1999, in Galaxy Interactions at Low and High Redshift, IAU Symp. 186, eds. D. Sanders & J. Barnes (Dordrecht: Kluwer), p. 311