Central Matter Distributions in Rich Clusters of Galaxies from z0 to z0.5 ††thanks: Based on observations collected at the European Southern Observatory (La Silla, Chile) and at the CFH observatory (Hawaii), and on the POSS and the Cosmos Survey.
Abstract
We have analyzed the galaxy number density and luminosity density profiles of rich clusters of galaxies from redshifts z0 to z0.5. We show that the luminosity profile computed with bright galaxies (M) is significantly cusped in the center of the clusters, whatever the redshift. This is in agreement with the dark matter profiles predicted by numerical simulations. The galaxy number density profile for the bright galaxies is fitted equally well with a core model or a cusped model. In contrast, the luminosity and the galaxy number density profiles of the fainter galaxies are significantly better fitted by a core rather than a cusp model. We did not detect any statistically significant different fits when applied to data in range from z0 to z0.5. The difference in profile between faint and bright galaxies may be due to the rapid (relative to the age of the universe at z=0 versus z=0.5) destruction of the faint galaxies by tidal forces and merging events in the denser central regions of the clusters. This process could erase the cusp by turning faint galaxies into diffuse light. In this case, the galaxies (with a cusp visible in the bright galaxy number density and mainly in luminosity profiles) would trace the total mass distribution.
Key Words.:
Galaxies: clusters: general; Cosmology: large-scale structure of Universe1 Introduction
Clusters of galaxies are key cosmological probes. They are one of the main products of the hierarchical models and the largest virialized structures in the Universe. Recent studies (e.g. Navarro et al. 1997) argue that whatever the cosmological model, a universal profile (NFW profile) with a cusp at the center should describe the cluster dark matter profile, in contrast to the beta-model (King 1962) which has been used from many years (cf Sarazin 1986). The shape of the galaxy number and luminosity density profiles (and their dependence on redshift) relates directly to the physical processes acting at the center of the clusters and we propose to investigate in this way these processes. While the dark matter profile (close to the total mass profile) seems to be very concentrated (Navarro et al. 1997), the galaxy distribution is nearly flat in the center of the nearby clusters (Adami et al. 1998: ENACSVII). Furthermore, the X-ray gas distribution cannot be used to distinguish between a flat and a cusped model except for the nearby clusters (e.g. Durret et al. 1994) due to a lack of resolution with Rosat, Einstein and Asca and due to cooling-flows.
In this paper we contribute to the effort to solve this puzzle by studying the galaxy number density profile and the galaxy luminosity density profile (the sum of the luminosity inside the galaxies; we will consider the diffuse light only at the end of the paper). This approach is clearly not new (e.g. Mazure et al. 1986), but we used here very large, homegeneously analyzed, samples. The use of all the optical wave band galaxy light allows us to take into account merging events. This method enables us to recover ”erased” cusps as it is the light of merged galaxies which is counted, not the number of galaxies. The best way to investigate the mass profile would be to compute this profile via the velocity dispersion profile (e.g. Carlberg et al. 1997a and b, Biviano et al. 2001), the X-ray temperature profile, or gravitational lensing, but these techniques require large amounts of data, and therefore, it is very difficult to obtain large samples of clusters. Moreover, galaxy luminosity density profiles for early type galaxies are claimed (e.g. Kaiser 1999) to be similar to the mass profile in clusters. This is an important question as galaxies would be sufficient to trace the mass profile. We will use in this paper homogeneous samples of thousands of galaxies and tens of clusters to compare the projected galaxy number density and luminosity profiles, and the simulated dark matter profiles (e.g. Navarro et al. 1997).
In Section 2, we describe the samples. In Sections 3 and 4, we describe the methods we used and the profiles we generated. Section 5 discusses the results and Section 6 gives a summary of the results.
To relate values of z to distance and to be in agreement with Adami et al. (1998, ENACSVII), we have taken H0 = 100 km.s-1Mpc-1, q0 = 0 and .
2 Samples
2.1 Low redshift sample
We used the COSMOS composite cluster which is decribed in detail in ENACSVII, but we briefly enumerate the main points here: we compiled photometric COSMOS data (Heydon-Dumbleton et al. 1989) for 77 of the 107 ENACS clusters (z0.1). We have adopted a limiting magnitude of = 20.
We have selected the clusters with:
-
1.
a low level of substructure (both visually and with a Dressler-Shectman test) in a 10 core radii on a side square (1200 kpc h-1), with more than 10 known redshifts in the main group (to avoid superposition effects);
-
2.
a redshift lower than 0.1
-
3.
and a converging solution of the fit of analytical density profiles.
These selection criteria lead to a sample of 29 homogeneously selected clusters. With this sample we built a composite cluster with about 5000 galaxies. For each of the 29 clusters, we determined the center by a Maximum Likelihood fit and we confirmed the results with other estimators (X-Ray centers, cD galaxies, see also Ulmer et al. 1992). For each galaxy, the distance from the center has been scaled both with the core radius of the cluster and the r200 (radius where the density is equal to 200 times the critical density) in order to take into account that different clusters have different sizes (see ENACS VII for a discussion of this point). We have taken the elongation of the clusters into account by ’circularizing’ the individual galaxy distributions by increasing all projected distances orthogonal to the major axis, thus ’expanding’ the distribution parallel to the minor axis by a factor deduced from the ellipticities of individual clusters. This correction is important because the superposition of galaxy distributions with randomly distributed orientations will cause outer densities to be underestimated with respect to the inner ones, which is producing an artificial cusp (cf ENACS VII).
2.2 High redshift sample
We used a sample of 7 clusters from the COP (Adami et al. 2000a, Holden et al. 2000) and CNOC (e.g. Carlberg et al. 1996) surveys selected with the same conditions as the low redshift sample:
-
1.
low level of substructures in a 10 core radii square (1200 kpc) from visual analysis
-
2.
more than 10 redshifts in the main group
-
3.
converging solutions of the fit of analytical galaxy number and luminosity density profiles (this excludes 2 clusters: MS1008 and MS1224).
This sample is described in Table 1: the redshift range of this sample of distant clusters is [0.33;0.55] (mean redshift = 0.42). We have built a composite cluster of 459 galaxies with these 7 clusters, correcting for ellipticity and orientation of each real cluster, in a similar manner as we did for the nearby sample.
We note that MS1358 is regarded in the CNOC papers as a complex cluster. However, we used in this paper only the central regions of this cluster in order to focus on the central cluster shape: we limited this cluster to a region of 160” radius. With this restriction, MS1358 can be included in our sample. We stress, however, that using larger areas will induce significant levels of substructures.
3 Methods and Results
3.1 Low redshift galaxy number density and luminosity profiles
The individual parameters (with individual clusters) of the low redshift sample profiles are described in Adami et al. (1998: ENACSIV). They have been computed with a Maximum Likelihood fit. We can easily generalized the same code to fit a luminosity profile for the composite clusters. We have weighted each galaxy with its luminosity (assuming all the galaxies at the cluster redshift): . Similarly to ENACSVII, the probability that the assumed profile ‘produces’ a galaxy in position (xk,yk) is (with k=1…N). The combined probability that the assumed profile will produce galaxies in the positions (xk,yk) that they actually have is:
L=
The best fit model is found from a maximization of L. We have chosen, instead, to compute -ln(L) with:
ln L =
The best model (which produces the best fit) is found from a minimization of -ln(L). We minimize this value by using the MINUIT package (e.g. ENACSVII for details).
To be able to quantify the degree of cuspiness at the center of the clusters, we fitted in ENACSVII both a projected beta-model:
and a cusped profile:
For the luminosity profiles, is the surface brightness, which replaces the surface density of the formulae in ENACSVII. These models, fitted to the individual clusters, have 7 free parameters: two parameters for the position of the center (x0,y0), two parameters to describe deviations from symmetry (ellipticity e and position angle , included in r), two parameters that specify the profile (rc and ) and the background density (assumed constant within the aperture of each cluster).
To be able to compare the fit quality of the two models (cusped profile and beta-model), we use the logarithm of the ratio of the Maximum Likelihood values for each fit as explained in ENACSVII. This value has a distribution (Meyer 1975) which we then use to determine the statisticial significance level of the best fit of one profile type versus the other.
Moreover, we have checked the consistency between the center of the clusters determined by using the galaxies (see ENACSVII) and the center determined by using the galaxies weightened with their luminosity. We find a shift of only (32 21) kpc. This shift is not large enough to erase a cusp (e.g. ENACSVII Fig. 8) and we have assumed the centers using only the galaxy number density.
3.2 High redshift galaxy number density and luminosity profiles
We used a similar approach as for the low redshift sample, but with an additional step to take into account the high background level. This is because it is nearly impossible to measure redshifts for all galaxies of all the clusters in our high redshift sample due to the large amount of observing time needed. Therefore we used the red sequences in the Color Magnitude Relations (CMR hereafter) to reject many of the field galaxies along the lines of sight (e.g. Yee et al. 1999).
| Name | Selection | z | ||
|---|---|---|---|---|
| dens. gal. beta-model | dens. gal. beta-model | dens. gal. cusped | dens. gal. cusped | best fit dens. gal. |
| dens. lum. beta-model | dens. lum. beta-model | dens. lum. cusped | dens. lum. cusped | best fit dens. lum. |
| MS0302 | g-R: [1.00,1.80] | 0.42 | ||
| 6312 kpc | 0.930.06 | 9332 kpc | 0.520.04 | beta-model: not significant |
| 6212 kpc | 0.940.09 | 9429 kpc | 0.520.05 | beta-model: not significant |
| MS0451 | g-R: [1.25,1.85] | 0.54 | ||
| 12132 kpc | 0.870.17 | 209108 kpc | 0.530.07 | beta-model: not significant |
| 11729 kpc | 0.880.16 | 210120 kpc | 0.530.08 | beta-model: not significant |
| MS1358 | redshift | 0.33 | ||
| 11726 kpc | 0.980.09 | 45597 kpc | 0.810.05 | cusped: not significant |
| 11929 kpc | 0.990.08 | 46995 kpc | 0.810.05 | cusped: not significant |
| MS1358 | g-R: [1.02,1.50] | 0.33 | ||
| 9522 kpc | 0.910.07 | 516172 kpc | 0.830.06 | cusped: not significant |
| 10113 kpc | 0.920.04 | 509151 kpc | 0.830.05 | cusped: not significant |
| MS1621 | g-R: [0.85,1.85] | 0.43 | ||
| 67 kpc | 0.80 | 735 kpc | 0.86 | beta-model: not significant |
| 68 kpc | 0.81 | 737 kpc | 0.85 | beta-model: not significant |
| PDCS16 | V-I: [1.35,2.11] | 0.40 | ||
| 29939 kpc | 0.990.20 | 882 kpc | 0.68 | beta-model: not significant |
| 30336 kpc | 0.980.18 | 885 kpc | 0.67 | beta-model: not significant |
| PDCS30 | V-I: [1.10,1.90] | 0.33 | ||
| 189 kpc | 1.04 | 30267 kpc | 0.530.04 | beta-model: 85 level |
| 189 kpc | 1.01 | 22769 kpc | 0.460.03 | beta-model: 85 level |
| PDCS62 | V-I: [1.24,2.20] | 0.46 | ||
| 19610 kpc | 1.010.26 | 28473 kpc | 0.530.04 | beta-model: 85 level |
| 192 kpc | 1.02 | 28271 kpc | 0.530.03 | beta-model: 85 level |
The color intervals we used are given in Table 1. We chose these intervals manually in order to match the prominent structures in the CMR of each line of sight. We have confidence that we made good choice of intervals as these intervals are very similar to the theoretical predictions of Kodama Arimoto (1997).
We give in Table 1 the best fit values of and for the 7 high redshift clusters, the 2 analytical models (beta-model and cusped profile) and the galaxy number and luminosity density profiles parameters ( is ranging from 63 to 299 kpc and from 0.8 to 1.04 for a beta-model). We give also the fit quality: which analytical model fits best, core or cusp?
We now examine whether that these values could have been affected by the following bias: the CMR rejects not only field galaxies but also the late type galaxies that are cluster members. Since these galaxies are preferentially located in the outskirts of clusters (e.g. Adami et al. 1998a), this could affect the density profiles.
– At low redshift, this is not a serious concern as more than 75 of the cluster galaxies in a 1200 kpc square are early type objects (Adami et al. 1998a).
– For the higher redshift clusters, however, the spiral fraction increases (e.g. Dressler et al. 1997) and can contribute for up to 60 in the outer parts of the clusters (Ellingson et al. 2000). As we want to focus on the central cluster shape, we limited ourselves to a region of 0.5 (5 core radii). In this region, the field-like galaxy contribution is lower: 30. We have tested, however, the significance of the effect by removing these galaxies when we fit the density profiles. We used the CNOC cluster MS1358 because redshifts are available for nearly all the galaxies along the line of sight. We can, therefore, select the cluster member galaxies on a firm basis. We see in Table 1 that using the CMR or the redshift selection does not affect in a significant manner the fitted parameters: these parameters are similar at the 1- level: for a beta-model is ranging from 117 to 95 kpc and from 0.91 to 0.98. This is not a definitive test as we are using a single cluster, but the results are still very suggestive.
Using the CMR seems, therefore, a good way to remove field galaxies in order to discriminate between cusped profiles and profiles with a core. However, as we go to faint magnitudes, the uniform field contribution becomes stronger and stronger. This field contribution is between 50 and 75 for the clusters in our sample (estimated from the redshift catalogs of these cluster lines of sight). This could have the effect that the cluster density profiles will flatter for faint galaxies.
–This does not affect our results for nearby clusters (we do not sample the clusters at magnitudes fainter than R=19, where the CMR becomes to be less contrasted compared to the field contribution: Adami et al. 2000b).
–This does not affect our results for distant clusters (z0.4) for the brightest bin of Table 3 (magnitudes brighter than R=19).
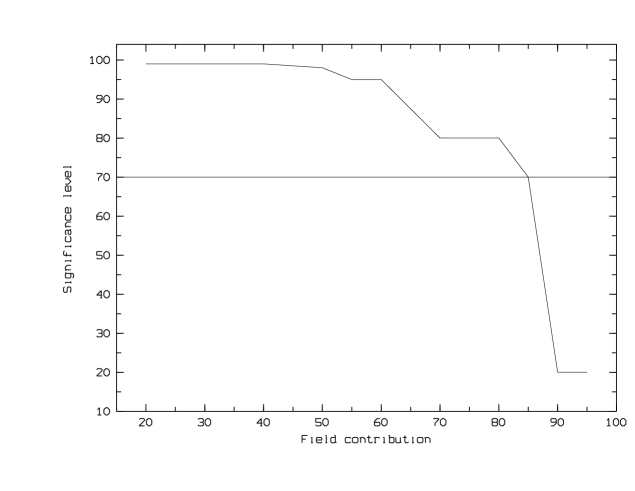
–This could have an influence for the 3 faintest bins of the distant composite cluster. However, the goal of this paper is to discriminate between density profiles with a cusp or with a core. In order to quantify the probability to have a cusped profile mis-interpreted as a profile with a core due to a high field contribution, we performed simulations. We generated a circular artificial cluster profile with a cusp in the center (as described in Section 3.1 with =200kpc and =0.67) and we added to this cluster a uniform field contribution with various galaxy densities. We computed finally the relative fit quality between a profile with a core and with a cusp. For field contributions as high as 80 of the total number of galaxies along the line of sight, a model with a cusp is prefered at the 80 significance level. For contributions equal to 85, a model with a cusp is prefered at the 70 significance level. For higher field contributions, we are not able to discriminate between a profile with a core or with a cusp (a model with a cusp is still prefered but with significance levels lower than 65, which is not significant). The results are plotted in Fig. 1. This means that even with a high field contribution, we are still able to discriminate between profiles with a core or with a cusp because the field contribution along the lines of sight we used is not higher than 80. Our results are, therefore, valid regarding the core/cusp discrimination.
3.3 Analysis of the results
| DENSITY | beta-model | cusped | beta-model | cusped | best fit |
|---|---|---|---|---|---|
| Nearby sample (z0.07) | 12888 kpc | 292191 kpc | 1.020.08 | 0.610.05 | beta-model |
| (Individual clusters) | Not significant | ||||
| Distant sample (z0.4) | 14779 kpc | 431268 kpc | 0.940.08 | 0.640.14 | beta-model |
| (Individual clusters) | Not significant | ||||
| Nearby sample (z0.07) | 895 kpc | 31834 kpc | 1.000.02 | 0.560.01 | beta-model |
| (Composite cluster) | 99 level | ||||
| Distant sample (z0.4) | 1198 kpc | 2159 kpc | 1.080.05 | 0.650.04 | beta-model |
| (Composite cluster) | 85 level | ||||
| LUMINOSITY | beta-model | cusped | beta-model | cusped | best fit |
| Nearby sample (z0.07) | 1017 kpc | 28141 kpc | 1.010.03 | 0.580.03 | beta-model: not significant |
| Distant sample (z0.4) | 1199 kpc | 232 kpc | 1.080.04 | 0.66 | beta-model: 85 level |
–We compare the characteristic parameters and of the distant clusters with those of the nearby sample (ENACSVII). The results are summarized in Table 2 and we give the description of these results: we used first the individual clusters. We do not see a statistically significant evolution with redshift: the agreement between z0 and z0.4 fits is consistent at the level (for a beta-model, individual clusters and galaxy number density, and ). If we compare now the fitted parameters and of the galaxy number and luminosity density profiles (regardless of the redshift), they also agree at the 2- level (for a beta-model, composite clusters and luminosity profiles, and ).
–As for the nearby sample (e.g. ENACSVII), the cluster galaxy distribution of the distant cluster sample is better fitted with beta-models than with cusped profiles. Although the fit is better, it is not significantly better than a 75 significance level.
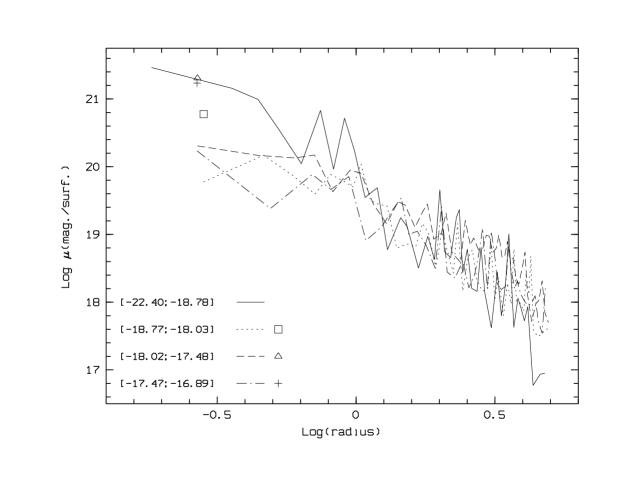
–To improve the statistical significance of the fits in order to distinguish between cusped profile and beta-profile fits, we used also composite clusters. The method used to build these composite clusters is described in Section 2.1. We found that the behavior of the fits was similar for the distant and nearby samples: the bright galaxies better followed a cusped luminosity profile, while the faint galaxy luminosity and galaxy number density profiles were better fitted with beta-models. This is also illustrated for the nearby sample with Fig. 2. We see that the bright galaxy luminosity density profile seem to be more peaked than for the fainter galaxies.
4 Cores or Cusps: Comparison with Literature
We have analyzed in this paper a very large sample of clusters and we have shown that we have a better fit for the galaxy number density if we used a model with a core rather than with a cusp (except for the bright galaxies). This is apparently contrary to the study of Carlberg et al. (1997a) which favored a model with a cusp for the galaxies of the CNOC clusters. We have shown in ENACSVII, however, that the results of Carlberg et al. are probably explained because Carlberg et al. did not correct for ellipticity of the cluster profiles, and more importantly, they only considered bright galaxies.
We have shown that if we limit ourselves to bright galaxies only (see Tab. 3), there is no statistically significant difference between a model with a cusp or with a core for the galaxy number density. This result is in good agreement, for example, with the work of Biviano et al. (1996) on the Coma cluster.
For another comparison we remark that Durret et al. (1994) showed that, using the X-Ray surface brightness profile of 12 clusters (based on ROSAT data), a model with a core does not fit significantly better the observations than a model with a cusp.
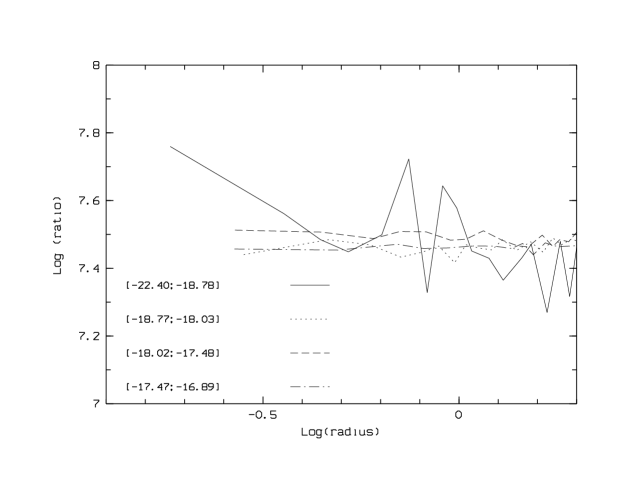
If we fit the luminosity density profiles for all galaxies with a beta-model and a cusped model, the core model is still preferred, but the difference is not significant over the redshift range from 0 to 0.5. For a comparison, we have plotted in Fig. 3 the ratio of the galaxy luminosity density to the galaxy number density (for the 4 luminosity bins). We see that the ratio is constant for the faintest bins, while we have an increasing ratio for the brightest bin close to the center, inside 50 kpc. As we have noted in previous sections, there seems to be a difference between the distribution of bright and faint galaxies and also between galaxy number density profile and the luminosity density profile.
| Nearby composite cluster | Luminosity density profile | Galaxy number density profile |
|---|---|---|
| All galaxies, scaled | beta-model better than cusp: not significant | beta-model better than cusp 99 level |
| All galaxies, scaled | beta-model better than cusp: not significant | beta-model better than cusp 99 level |
| [-22.4;-18.78], scaled | cusp better than beta-model 95 level | beta-model better than cusp: not significant |
| [-18.77;-18.03], scaled | beta-model better than cusp 95 level | beta-model better than cusp 95 level |
| [-18.02;-17.48], scaled | beta-model better than cusp 75 level | beta-model better than cusp 95 level |
| [-17.47;-16.89], scaled | beta-model better than cusp 75 level | beta-model better than cusp 75 level |
| Distant composite cluster | Luminosity density profile | Galaxy number density profile |
| All galaxies, scaled | beta-model better than cusp 85 level | beta-model better than cusp 85 level |
| R [-22.;-21.], scaled | cusp better than beta-model 95 level | beta-model better than cusp: not significant |
| R [-21.;-20.5], scaled | beta-model better than cusp 95 level | beta-model better than cusp 95 level |
| R [-20.5;-20.], scaled | cusp better than beta-model: not significant | cusp better than beta-model: not significant |
| R [-20.;-19.], scaled | beta-model better than cusp 70 level | beta-model better than cusp 70 level |
It seems that two different shapes apply. The faint galaxies exhibit a core. They have a distribution in agreement with a beta-model. The bright galaxies (at least for the luminosity profile) show a cusp. This would be in agreement with the dark matter profiles of the simulations of Navarro et al. (1997). As suggested by Kaiser (1999), the bright galaxies would, therefore, trace the cluster mass.
5 Discussion
We have presented different arguments favoring either a core or cusp in the last sections. The galaxy number density profiles do not exhibit a cusp, and the bright galaxies cannot be used to distinguish between core and cusp models. On the contrary, the luminosity profiles can be used to produce a cusp or a core depending on whether just bright or faint galaxies are used to generate the luminosity density profile. This leads to suggest different scenarios for the evolution of the bright and faint objects:
- the bright galaxies luminosity profile could be cusped at the formation epoch of the clusters. It could also become cusped via evolutionary processes, such as a segregation process (bright galaxies in the center of the clusters).
- the faint galaxies, which exhibit a core, could originally have been in a cusped distribution, but this distribution erased by environmental effects like tidal disruption or merging events. Galaxies near the cluster center and on radial orbits with low angular momentum would have to pass right through the giant ellipticals and would be eventually swallowed up or disrupted in the process. This can lead to a lower density of faint galaxies near the cluster center.
5.1 Segregation effects.
We examine if the luminosity profile cusp for bright galaxies is due to a segregation effect. In Adami et al. (1998a) it was shown that the elliptical galaxies are the brightest objects in a cluster. Moreover, they are more concentrated in the cluster centers than the other morphological types. This explains probably why we are not able to distinguish between a core and a cusp when we examine the galaxy number density profile of the bright galaxies (ENACSVII): bright galaxies are mainly elliptical and elliptical galaxies are mainly in the cluster centers.
To confirm this effect, we have removed the galaxies brighter than b from the brightest bin of the nearby sample (28 galaxies). This removes the cD-like galaxies. When re-doing the fit of a beta-model and a cusped profile for the bright galaxy bin with the cDs removed, we still prefer a model with a cusp, with, however, at a lower significance level of 90 (instead of 95 ). This effect does not appear, however, to be dominant.
We now discuss the difference between the galaxy number density and the luminosity profiles. A cusp in the galaxy number density profile could be erased by merging events, leading to a core. However, the luminosity profile of the bright galaxies has a cusp, but the same profile for the faint galaxies has a core. We discuss a scenario that would explain this result in the next subsection.
5.2 Destruction of the faint galaxies in the center of the clusters?
Suppose that the formation mechanism of the clusters does not initially produce a core, but only a cusp for both bright and faint galaxies, as in the simulations (e.g. Navarro et al. 1997). This cusp could be ”erased” in the galaxy number density profile by merging events and ”revealed” in the luminosity profile for the bright galaxies. We must now explain why the luminosity profile for the faint galaxies has no cusp. This could be explained if we consider the other sources of galaxy destruction, beside the merging events: the tidal disruptions. Tidal forces in the cluster center disrupt part of the faint galaxies, turning them into diffuse light, while the bright ones (more massive and more robust) are conserved. This explanation was, for example, proposed by Merrit (1984). By using simulations of the dynamical evolution of the cluster core, he predicted a tidal radius (lowest value for the size of a not tidally disrupted galaxy) of about 15 kpc. The bright galaxies, like cD galaxies, are significantly larger. The cusp could be erased in this way only for the faint galaxies which are generally smaller. More recent simulations by Moore et al. (1998) show the same trend for the dwarf galaxies to be disrupted in the center of the clusters. Such a destruction of the faint galaxies has been also proposed on observational bases for example by Secker et al. (1997) or Gregg West (1998). These last authors, using deep photometry of the Coma cluster, propose the disruption of the faint galaxies as an explanation of the lack of dwarf galaxies in the core of this cluster (e.g. also Adami et al. 2000b).
A way to investigate this possibility is, for example, to search for cusped profile in the diffuse light. Gregg West (1998) give an approximation of the total luminosity lost for the galaxies by disruption and turned into diffuse light in the center of the Coma cluster. This value is about 20 of the luminosity of a cD galaxy. This contribution is around 50 of the luminosity sum of all galaxies fainter than in the central bin (where the cusp is significant for the bright galaxies) of our nearby composite cluster. After rescaling to the total luminosity to get units coherent with Fig. 2, we see on this figure that such a contribution is large enough to enhance the three faint luminosity profiles, consistently with a cusped model.
A more quantitative study has been done for this same cluster by Bernstein et al. (1995). Using very deep images of a cluster-central area of 7’7’, they conclude that the faint galaxy luminosity profile is flat or decreasing in the central 40 kpc (see also Adami et al. 2000b for a spectroscopic survey of this area), while the luminosity profile of the brighter galaxies is peaked. Moreover, considering now the diffuse luminosity profile (not associated with visible galaxies), they also found a peaked profile. If we argue that the cusp of the faint galaxy luminosity profile is erased by tidal disruption of part of these galaxies, we should recover at least partially this shape in the diffuse light profile. It is exactly what Bernstein et al. saw in the Coma cluster.
5.3 Destruction time scale?
We demonstrated that the cluster profiles have the same central shape from z0 to z0.5. This would imply that the time scale of the destruction processes described above (merging + disruption) would be relatively short. This is because all the faint galaxies accreted between z0 and z0.5 do not contribute to the reconstruction of a cusp. The in-falling galaxies seem to be continuously destroyed, in a time close to the virialization time which is approximately 1.5 Gyear (e.g. Sarazin, 1986) for faint galaxies. This estimate is, for example, in good agreement with the estimates of the time needed to disrupt a low surface brightness galaxy in the simulations of Calcaneo-Roldan et al. (2000). An alternative explanation in agreement with the observations is that the accretion rate could be already very low at z=0.5 (e.g. Ellingson et al. 2000).
6 Summary
We have shown in this article that, on one hand, the galaxy luminosity density profile is cusped for the bright galaxies from z0 to z0.5 and exhibits a core for the faint galaxies. On another hand, the galaxy number density profile has a core (not significant for the bright galaxies). This could be understood if we assume a cusped profile for all the galaxies in agreement for example with the simulations of Navarro et al. (1997). The cusp could be erased for the galaxy number density profiles by merging effects and for the luminosity profile of the faint galaxies with the destruction of these galaxies by tidal forces. This seems to be confirmed by two observational studies of the Coma cluster (Gregg West 1998 and Bernstein et al. 1995).
If this model is confirmed, this would imply that clusters of galaxies mass profiles are well traced by the bright galaxy luminosity density profiles.
Acknowledgements.
AC acknowledges the Dearborn Observatory staff for their hospitality during his postdoctoral fellowship and J. Mohr for useful discussions.References
- (1) Adami C., Holden B.P., Castander F.J., et al., 2000, AJ 120, 1 (a)
- (2) Adami C., Ulmer M.P., et al., 2000, AA 353, 930 (b)
- (3) Adami C., Biviano A., Mazure A., 1998, AA 331, 439 (a)
- (4) Adami C., Mazure A., Biviano A., Katgert P., Rhee G., 1998, A&A 331, 493: ENACSIV
- (5) Adami C., Mazure A., Katgert P., Biviano A., 1998, A&A 336, 63 ENACSVII
- (6) Bernstein G., Nichol R., Tyson J., Ulmer M., Wittman D., 1995, AJ 110, 1507
- (7) Biviano A., et al., 2001, A&A in preparation
- (8) Biviano A., Durret F., Gerbal D., et al, 1996, A&A 311, 95
- (9) Calcaneo-Roldan C., Moore B., Bland-Hawthorn J., Malin D., Sadler E.M., 2000, MNRAS 314, 324
- (10) Carlberg R., Yee H., Ellingson E., et al, 1997, ApJ 485, L13(a)
- (11) Carlberg R., Yee H., Ellingson E., 1997, ApJ 478, 462(b)
- (12) Carlberg R., Yee H., Ellingson E., et al, 1996, ApJ 462, 32
- (13) Dressler A., Smail I., 1997 Conf. Proc. ”HST and the High Redshift Universe”
- (14) Durret F., Gerbal D., Lachieze-Rey M., et al, 1994, AA 287, 733
- (15) Ellingson E., Lin H., Yee H.K.C., Carlberg R.G., 2000, ApJ, in press: astro-ph: 0010141
- (16) Gregg M., West M., 1998, Nature 396, 549
- (17) Heydon-Dumbleton N., Collins C., MacGillivray H., 1989, MNRAS 238, 379
- (18) Holden B.P., Adami C., Castander F.J., et al., 2000, AJ 120, 23
- (19) Kaiser N., 1999, Conf. Rev., astro-ph: 9912569
- (20) King I., 1962, AJ 67, 471
- (21) Kodama T., Arimoto N., 1997, A&A 320, 41
- (22) Mazure A., Gerbal D., Proust D., Capelato H., 1986, A&A 157, 159
- (23) Merritt D., 1984, ApJ 276, 26
- (24) Meyer S., 1975, ”Data Analysis for Scientists and Engineers”, p.352, John Wiley & Sons, New York
- (25) Moore B., Lake G., Katz N., 1998, ApJ 495, 139
- (26) Navarro J., Frenk C., White S.D.M., 1997, ApJ 490, 493
- (27) Sarazin C.L., 1986, Rev. Mod. Phys. 58, 1
- (28) Secker J., Harris W., Cote P., Oke J., 1997, Proc. ”A New Vision of an Old Cluster: Untangling Coma Berenices”, Marseille 1997, ,Eds. Mazure et al, Astro-ph 9709053
- (29) Ulmer M., Wirth G., Kowalski M., 1992, ApJ 397, 430
- (30) Yee H.K.C., Gladders M.D., 1999, ASP Conf. Series, vol 191, astro-ph: 9908001