Public Imaging Surveys: Survey Systems and Scientific Opportunities
*
Abstract
The start of operation of several large-aperture telescopes has motivated several groups around the world to conduct deep large imaging surveys, complementing other wide-area but shallower surveys. A special class of imaging surveys are the public ones such as those being conducted by the ESO Imaging Survey (EIS) project established with the primary objective of providing to the ESO community large datasets from which samples can be drawn for VLT programs. To date several surveys have been carried out providing multi-passband optical data over relatively large areas to moderate depth, deep optical/infrared surveys of smaller fields as well as observations of a large number of selected stellar fields. These surveys have produced a large amount of well-defined datasets with known limits from which a variety of data products have been extracted and distributed. The goal of the present contribution is to give an overview of the EIS project, to present the end-to-end survey system being developed by this program and to highlight the effort being made to standardize procedures, to build software tools to assess the quality of the derived products and to explore the available datasets in a systematic and consistent way to search for astronomical objects of potential scientific interest.
1 Introduction
The start of regular operations of several 8-m class telescopes has created a new demand for large imaging surveys. However, in contrast to other ongoing all-sky surveys, there is a pressing need for customized surveys designed in support of programs to be conducted using large-aperture telescopes. These surveys should be capable of providing data sets from which samples suitable to the instrumentation available on these telescopes can be drawn, in particular reaching magnitudes comparable to their spectroscopic limit. Currently, most of the major observatories are involved in large optical/infrared imaging surveys using either dedicated 2-m class telescopes or generous amounts of time on 4-m telescopes. These surveys are being carried out either by individual groups or in the form of public surveys, thereby serving a broader community and increasing the scientific yield of the accumulated data.
The need for imaging data is especially acute for the ESO community at large, considering the four telescopes of VLT and the large array of spectrographs, some lacking imaging capabilities. Foreseeing this need, ESO established in 1997 the ESO Imaging Survey (EIS) project with the primary purpose of conducting public imaging surveys in support of VLT science. Over the past three years EIS has carried out several surveys providing the ESO community with multi-passband optical data over relatively large areas to moderate depth, deep optical/infrared surveys of smaller fields as well as observations of a large number of selected stellar fields. Some of these programs cover sky regions being observed from the ground and space in other wavelengths (e.g. Chandra and HDF-S fields). Combined, they provide valuable multi-wavelength datasets from which statistical samples can be extracted and searches for rare population of objects can be conducted. In fact, the imaging surveys driven by 8-m class telescopes sample a region of parameter space significantly different from that accessible by shallower, all-sky optical/infrared surveys, thus offering new scientific opportunities for a broad range of areas.
In this paper the requirements for establishing a framework for conducting long term ground-based, optical/infrared public surveys and for designing a robust end-to-end survey pipeline are reviewed. The broad range of issues that impact the architecture of a survey system are identified in section 2. In section 3, the EIS project is briefly reviewed and used as a concrete example of an ongoing public survey. This experience has served to set more specific requirements on the EIS survey pipeline software presented in section 4. This system was specifically designed to meet the needs of long-term, multi-instrument public imaging surveys carried out by a small team. In this section some of the main features of the new EIS pipeline architecture are described as well as some other important components of the system and its current status. A more detailed discussion of some of the issues involved in the preparation of derived products is presented in section 5, followed by a brief summary in section 6.
2 Public Imaging Surveys
The need for imaging surveys is of course not new - what has dramatically changed in the past few years is the rapid increase in the rate digital images are being collected, and consequently the volume of data to be processed, and the time pressure to convert these data into input samples for follow-up observations. The challenge is now to build efficient systems to store, process, access, visualize, analyze and scientifically exploit the resulting large data sets. The basic reduction steps are well-known and include: removal of instrument signature; astrometric and photometric calibration; source detection and measurement of flux and structural parameters; and object classification (star/galaxy). Less standard steps include the combination of information obtained using different passbands and/or telescopes, stacking and mosaicing of images, preparation of color catalogs and use of multi-wavelength information for object classification.
Depending on the duration of the specific program it is desirable to consolidate these various steps into a pipeline enabling the efficient and un-supervised reduction of the data. The need for pipelined operations is particularly strong for long-term programs for which a greater degree of autonomy and a more complex data flow model are essential to ensure efficiency, uniformity and consistency in the production of deliverables. The pipeline requirements may vary considerably depending on the nature (public/private) and the size of the survey program. It is important to emphasize that not all pipelines are or need to be alike. In fact, the design of a survey pipeline depends on a variety of factors including: the specific goals of the survey and its strategy (number of passbands, area, depth, type of fields, dithering pattern, mosaic geometry); expected input data rate and total data volume; the number of telescope/detector configurations involved; the variety of derived products; and how frequently intermediate and final products should be made available. One must also consider the desired level of uniformity of the data in terms of photometric accuracy and seeing, which may vary depending on the specific scientific application. All of these points translate into requirements for the design of the survey software which must be able to store and administrate all this information and process the data according to their specifications. Of course, the larger the set of requirements is the more complex the pipeline needs to be, something not fully appreciated. It must be emphasized that the development of a survey system only pays dividends in the long-run.
To be successful a public survey depends not only on the design of the associated survey pipeline but also on the context in which it is inserted, as it must rely on the infrastructure available and the level of support granted to the program. A public survey must rely on a variety of interfaces and a balance must be reached between the specific responsibilities of the survey team and the institute at large. Some important points to consider are: whether the telescope used is a survey-dedicated or a general-purpose one; the nature of the telescope/survey team interface; the availability of tools to prepare and monitor observations; the availability of calibration data; how efficiently raw data can be accessed by the survey team as well as their overall uniformity.
Since the main goal of a public survey is to have data reach the interested users, one must also make sure that tools and resources are available to distribute final products and to provide some level of on-line service. The latter is particularly important since the present technology precludes the widespread distribution of pixel maps. In the short-term the next best alternative is to provide as many derived products as possible in the form of source catalogs, while allowing users to at least retrieve image sections to assess by themselves the quality of the delivered products for their scientific goals. This also provides the opportunity for independent verification of the data and a possible way to obtain an important feed-back from the users, leading to further improvements in the preparation of final products. Another mid-term alternative is to distribute the data to national/regional data centers which can then further distribute them to individual institutes and university research groups.
An additional complication for ground-based optical/infrared surveys is that they are, in contrast to surveys carried out from space, sensitive to weather and atmospheric conditions. This implies that the survey data have always to be supplemented with information regarding seeing and photometric quality. For this purpose, tools must be built to automatically monitor the progress of the survey not only in terms of its completeness but also of the quality of the data. More importantly, this has to be done quickly to enable the preparation of new observations, including repeat observations, and to prepare periodic updates to inform the general public of the status of the survey. In addition, when a dataset is released this information should be properly summarized in supporting publications to fully characterize the block of data being distributed. This is particularly problematic when releasing incomplete data sets, which may be the case when a pre-defined schedule of data releases is adopted.
Careful consideration of the several issues mentioned above are essential to establish the requirements for a survey pipeline software and the general framework within which a long-term, sustainable public survey can be carried out.
3 The EIS Project
The EIS project was established by ESO with the short-term goal of providing the ESO community different samples for the scientific verification of the first unit telescope of the VLT and its first year of operation. It was an attempt to coordinate and maximize the return of foreseen preparatory imaging programs at the NTT by consolidating them into a single survey and making the data immediately available to the ESO community. Besides this short-term goal, the EIS project was also viewed as an important first step to: establish a framework for conducting public surveys at ESO; drive the development of software to be consolidated into a survey system; create mechanisms to tap on the expertise spread throughout the ESO community; disseminate know-how by training students and post-docs and by making available survey software and tools; and create an environment for testing and bench-marking survey system software using real data.
From the organizational point of view, the first step was to appoint a Working Group assembled from scientists, representing a broad range of scientific interests, drawn from the community and in charge of: designing and supervising the progress of the surveys; preparing proposals and progress reports to the time allocation committee; proposing to the ESO management policies regarding data distribution and timetables; acting as representatives of the scientific interests of the ESO community at large. In parallel, a special Visitor Program was created to fund short- and long-term visits to ESO of known experts in the field as well as students and post-docs to form the Survey Team. The responsibilities of the team include: 1) preparation and execution of observations; 2) data reduction; 3) production and verification of calibrated images, object catalogs and targets; 4) maintenance of supporting database; 5) maintenance of web pages; 6) periodic reports describing the progress of the observations and papers accompanying each data release describing the data, the methodology adopted in the reduction and in the preparation of derived products. In the particular case of EIS, all these tasks have been carried out in parallel.
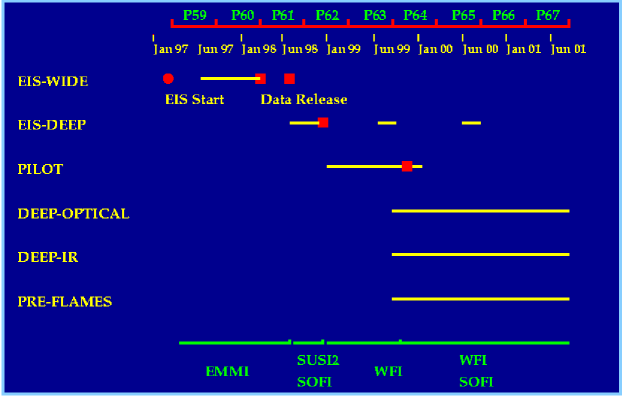
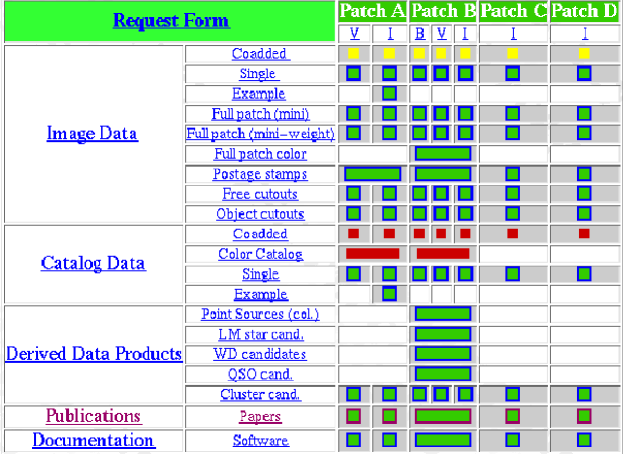
As pointed out above, EIS started as a short-term experimental project and in its early phase a pragmatic approach was adopted to develop a basic pipeline. The main effort was to assemble and interface existing software (e.g. IRAF, Drizzle, LDAC, SExtractor) to enable raw images to be processed and astrometrically calibrated, mosaics created and object catalogs produced under a minimum of supervision for the specific instrument and survey strategy adopted in the first survey. Due to time limitations much of the administrative tasks, photometric calibration, data verification and archiving remained external to the pipeline proper and required human intervention. This first implementation of the pipeline was effective for the input data rate and the total volume of survey data expected at the time. However, the pipeline could not match the requirements imposed by the rapidly evolving goals of the imaging survey, as can be seen in Figure 1 where the timeline of project is shown. This figure shows: at the top the dates and ESO’s observing periods; on the left side the various surveys conducted by EIS; and at the bottom the different detectors (telescopes) used. Also shown in the figure are the periods of observations of each survey and the dates of previous data releases. For reference, the science verification observations of VLT UT1 were carried out in December 1998, and included targets provided by EIS. The public nature of EIS requires a wide range of data products to be made publicly available periodically in the form of incremental and complete data releases [1]. This is illustrated in Figure 2 which shows the web page from which EIS data products can be requested. This particular example corresponds to the complete data release of the EIS-WIDE survey. Given the large variety of products that are made available it is critical to have in place standard and automatic procedures to prepare these releases, to ensure the quality and consistency of the products. These requirements have a strong bearing on the scope of the EIS survey system and on its design.
From Figure 1 one can see that over the past three years six different surveys have been conducted (more information on the EIS project can be found at the URL www.eso.org/science/eis):
-
1.
EIS-Wide: a moderately deep, wide-angle survey conducted at the NTT. The survey covers 17 square degree in -band as well as smaller areas in and .
-
2.
EIS-DEEP: a multi-passband optical/infrared deep survey of the HDF-S and Chandra (AXAF) fields.
-
3.
Pilot Survey: a wide-angle survey covering over 14 square degrees, conducted with the wide-field imager (WFI) mounted on MPG/ESO telescope, to complement the -band survey.
-
4.
Deep Optical Survey: a deep optical survey intended to cover three, one square degree strips (four WFI pointings) over a range of right ascensions. Even though it can be considered as an extension of EIS-DEEP it is based on observations being carried out with WFI.
-
5.
Deep Infrared Survey: designed to cover two areas of 450 square arcmin in two patches also observed in the optical.
-
6.
Pre-flames: a multi-passband, relatively shallow survey, of selected stellar fields to be used for observations with the FLAMES/Giraffe combination.
In summary, the various EIS surveys were designed to provide datasets for a wide range of science: multi-passband data over a relatively wide-area to moderate depth to search for rare objects (e.g. high-redshift clusters, quasars), deep surveys for the selection of statistical samples of galaxies for high-redshift studies (e.g. LBG) and imaging data with accurate astrometry ( arcsec) for multi-object spectroscopy using the high-resolution Giraffe spectrograph, lacking imaging capabilities. The selected pointings have also been obvious choices. The wide-angle surveys consisted of four distinct patches covering a wide range of right ascensions, to provide targets almost year-round, in a declination range suitable for VLT observations. Two of the selected regions are located at high-galactic latitudes: one near the South Galactic Pole, of interest for studies of quasars and absorption systems, and the other overlapping with ESO Slice Project redshift survey and the associated deep ATESP radio survey [2]. The other two regions surveyed by EIS-WIDE were selected at lower galactic latitudes to provide data of potential interest for galactic studies. Three of the selected regions have also been covered by radio surveys such as ATESP, NVSS and WISH. The deep surveys have included regions where considerable work is under way in other wavelengths such as HDF-S and Chandra.
While from the scientific point of view the EIS strategy has been quite sensible, from the technical point of view it has been very demanding as they have involved observations using different telescope/detector combinations (EMMI, SUSI2, SOFI at the NTT and WFI at the 2.2m MPG/ESO telescope), a variety of filters, different surveying strategies, and fields at high- and low-galactic latitudes, representing different challenges for the astrometric calibration. To complicate matters even further EIS observations were conducted in visitor mode and started right after the commissioning of these instruments, before their operation had matured.
The short-comings of the first EIS pipeline implementation became evident when: different telescope/detectors were used (e.g. infrared; CCD mosaics); the data volume greatly increased due to the use of a wide-field imager; and the status of the program changed from a short-term experimental program to a long-term one. Using different telescope/detector combinations and survey strategies entailed the need to handle: optical and infrared data, requiring different reduction strategies; detectors with different characteristics; different types of images and headers; and different combination of optics, CCDs and filters. The large data volume required the installation of DLT juke-boxes and hence the need for the dynamical administration of the machine resources and for procedures to efficiently store/retrieve data. Finally, the long-term status of the program combined with the large turnover of visitors (over 25 in three years, averaging 5-6/year) demonstrated the necessity of simplifying operations, eliminating as much as possible the need for human intervention. Clearly, the operational requirements and the timetable of the program forced the development of a more sophisticated survey system in order to make the EIS effort sustainable in the long-term.
4 EIS Survey System Design
4.1 Basic Requirements
Over the past year the EIS team has concentrated its efforts on designing and implementing a new survey system matched to the requirements discussed above and building on the hands-on experience accumulated from the previous surveys . The main goal has been to achieve a stable and reliable operation by building a close-loop system providing the tools required for preparing, monitoring and reporting the progress of the observations, reducing data, preparing and verifying survey products and releasing them following standard procedures to ensure efficiency, consistency and quality of the data. A top requirement has been to make the survey system capable of handling data from different telescope/detector configurations, as required by EIS, and of administrating the system resources automatically.
In addition, the desire to make the system more widely accessible also required the survey software to: 1) support different users (e.g. survey/guest); 2) support multi-users and multi-sessions; 3) allow the user to customize the processing steps and the configuration files associated to these processes; 4) hide from the user details of where the data are stored in the system and how they are retrieved; 5) allow for the installation of the pipeline in other locations; 6) allow for the easy installation of user-developed algorithms.
In response to this challenge a new fully integrated, end-to-end, user-friendly pipeline has been designed to make it possible for a small team to conduct public surveys on a routine basis satisfying the wide range of requirements outlined above. While the public surveys conducted by ESO have so far been relatively modest in size, with VST and VISTA the trend is for the flow of data to increase significantly. Therefore, the implementation of a more comprehensive survey system is essential not only to deal with the present surveys but also a key element in the long-term plan to ramp-up the system to cope and fully exploit these new facilities.
4.2 EIS Graphic Interface
Taking all the requirements mentioned above into consideration a graphic user interface was created, consolidating under it all the functionalities of the pipeline software, making them easily accessible and their operation simple. To that end all the EIS pipeline processes have been wrapped by Python scripts which are launched through this multi-layered graphic interface. Though still under development a preview of the functionalities of the pipeline is presented below and illustrated by a development version of the graphic interface.

Basically, the pipeline, represented by different sets of panels, consists of three layers reflecting the level of complexity of the processes available. At the top level there are master-processes that work as black-boxes, wrapping together all the steps involved in the production of a given final product. These processes are started by pressing one of the buttons displayed on the left side of the window shown in Figure 3, the first to appear after a new pipeline session is started. This opens a new window from which these high-level operations are controlled. The main processes shown in the panel of Figure 3 drive: the reduction of raw images all the way to the production and verification of single passband catalogs on a run basis; the preparation of final images by stacking or mosaicing pre-reduced images on a survey/passband basis; the production of either single passband or color catalogs from pre-reduced images; and the identification and classification of objects from the analysis of multi-color catalogs. Under normal circumstances most survey operations are executed from this layer of the pipeline.
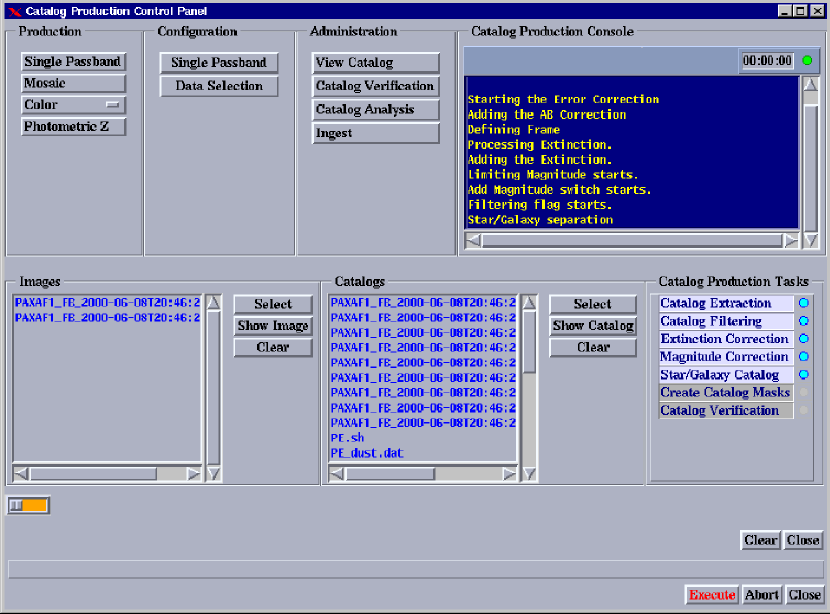
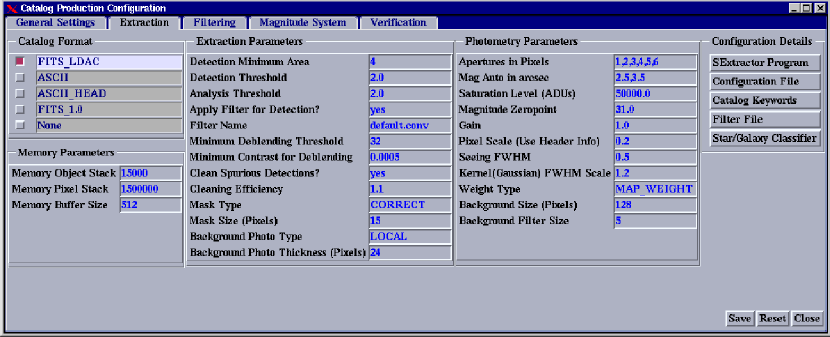
As an example, Figure 4 shows the control panel for catalog production. This panel provides the environment for the preparation of single or multiple catalogs of different types. It enables the user to configure the processing steps, the configuration parameters for each process and to select the appropriate input data (images or catalogs). The choices include the production of single passband catalogs, catalogs extracted from an image mosaic, color catalogs from available single passband catalogs or images, and photometric redshift catalogs created from color catalogs. This panel is used after final image products have been produced.
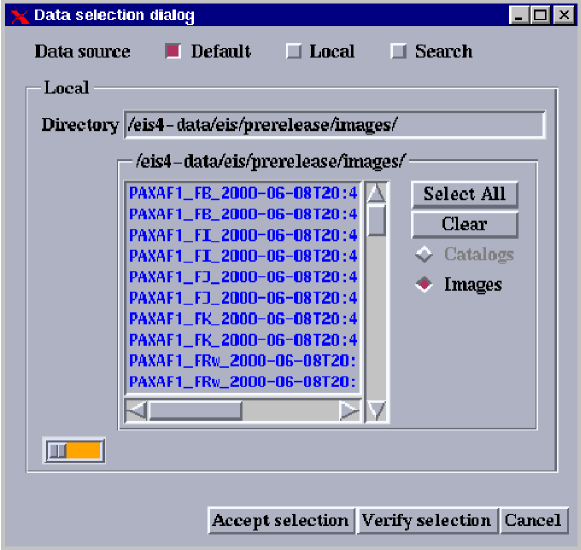
Once the end-product type is selected the bottom-half of the panel is displayed with a layout that depends on the selection made, and the appropriate links to a so-called data access layer (Figure 5) and to a configuration panel (Figure 6) are set. The data access layer enables the retrieval of input files from default, user-specified directories or via the search engine, which are set for the appropriate type of input data (catalogs or images). The retrieved data are then displayed in the list box on the left of the panel, while the one to the right lists intermediate and final products. The process can be executed in its entirety or by selecting the steps listed on the right side of the panel, right below the console (see section 5). The steps to be executed, the parameters for the different processes and where the results should be stored can all be set by using the catalog production configuration window. A console is also available for monitoring in real-time the progress of the execution. Process logs, error reports and diagnostic plots are also created and can be viewed either interactively or at a later time. While the design of these graphic interfaces is not final, this example serves to illustrate the underlying philosophy being adopted throughout the pipeline. It also underscores some general features of the pipeline among which are the freedom it gives the user to configure processes and parameters, the ability of running un-supervised or interactively and to inspect the results of a process during or after its execution.
The second layer of the pipeline allows the user to execute step by step the various processes wrapped together in the first-layer. This layer is useful for development, testing, training and for setting up suitable default configuration files. It is also used for the administration of the pipeline and survey. The main panel is divided into three major sections: administration, image analysis and catalogs & targets which can be accessed individually, using the appropriate buttons on the right of Figure 3 or all at once as shown in Figure 7. This figure gives a global view of the functionalities available in the EIS pipeline. Altogether this panel integrates over 200 processes ranging in functionality and complexity.
The top set of sub-panels are used for the administration of the pipeline and its database (the three sub-panels on the left) and surveys (three sub-panels on the right). The administration of the survey system requires information about users, incoming tapes, software packages used and their versions, definition of environment variables, logical devices and paths, and default settings for the pipeline. This information is stored in the database via graphic interfaces to forms that guide the user for the required information. Also available is a set of graphic interfaces to the database which is used for development and maintenance. The main survey database currently consists of over 100 tables. A replica of these tables are also available for guest users. Finally, disk space, juke-boxes, processing status of all the EIS machines, logs and error reports can be monitored and examined directly from the panels.
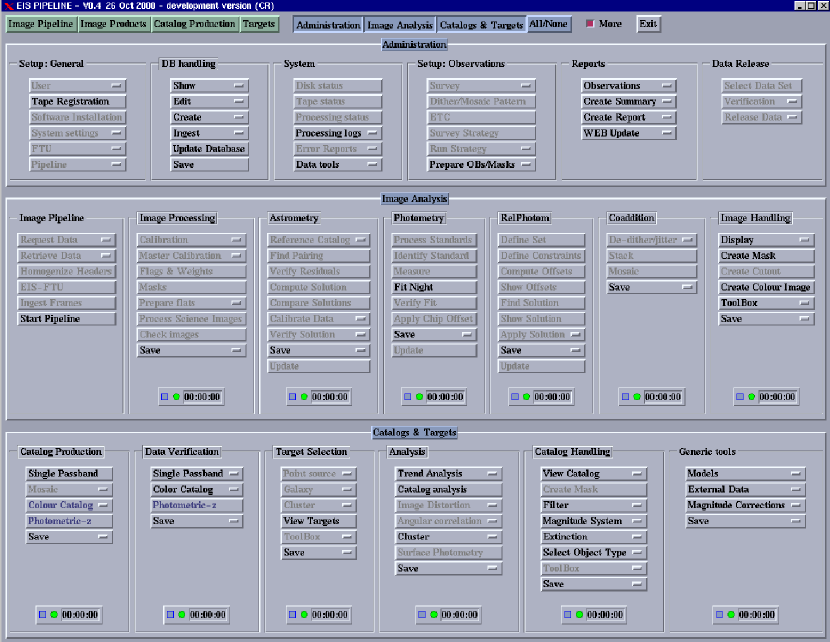
The three sub-panels on the right are used to administrate long-term surveys. These sub-panels are used to store in the database information regarding the instrumental setup (telescope, detectors, filters) used in a particular survey and their physical characteristics which are used consistently throughout the pipeline. They are also used to store information about the regions of sky to be observed, the pointings and the sequence of exposures required by the adopted survey strategy. In addition, observing logs are ingested and night/run summaries and reports are prepared even before the data are processed. This information is then stored in the database and used by the system to request data from the archive and to select runs to be reduced. It is also used to monitor the progress of the survey and to prepare new observations based on the results of previous ones. Finally, the procedure to prepare a data release is also foreseen to be consolidated in this panel. The steps include the selection of data to be released, final verification of the products, backup of the particular set of data being released, update of the database with information about the release, transfer of the data to the ESO archive and the update of data request page on the web. The main goal has been to establish standard procedures for all the tasks of the survey team, hence facilitating their execution.
The middle panel provides access to the different stages of the image analysis pipeline assembled together in the top layer described above. The various sub-panels represent different possible breakpoints of the process, which also correspond to places where data in different stages can enter the pipeline. This is useful when re-processing of the data is required. This feature has been extensively used in the development and test phase. From each sub-panel the specific type of input data can be retrieved through the data access layer described earlier. Although this layer of the pipeline is not expected to be used in routine survey operations, it is very useful for diagnostics, debugging and bench-marking.
The bottom panel handles the preparation of derived products including catalog production, target identification and their verification as well as other analysis algorithms and preparation of simulated data. A variety of tools are also available to manipulate, visualize and compare catalogs, correlate objects with information available in other databases, compute transformations to other photometric systems, compute extinction corrections, and compare derived results with model predictions and empirical data.
Finally, at the lowest level, not shown here, tools to handle images and catalogs in a variety of ways are available individually. These tools can be found in the sub-panels image and catalog handling as well as in their respective “toolboxes”. These toolkits are a collection of specific software developed over the years to manipulate pixel maps and catalogs and include the most basic tasks used to build more complex routines. Their inclusion into the panels is important for debugging and testing new versions, before making upgrades.
4.3 Other Developments and Current Status
Since a survey system comprises innumerous components the pipeline software development involved the participation of a large number of people with different backgrounds and expertises to develop the variety of algorithms required and to address the vast range of technical issues involved. Besides the overall framework presented above other critical areas which required considerable effort have included: 1) a control system to administrate the flow of the data through the pipeline and the system resources, to ingest information into the database and to handle the DLT juke-boxes; 2) a comprehensive graphic interface to Sybase, the commercial database being used by the pipeline; 3) the implementation of a search engine, supporting different combinations of queries; 4) an interactive graphic facility created by interfacing Python and IDL; 5) a graphic user interface for the administration of the observed standard stars, the photometric calibration of the nights and storage of this information; 6) a new strategy for reducing optical/infrared images, coadding and astrometrically calibrating them; and 7) algorithms and tools to verify the data products (see next section).
Other features of the survey system are worth mentioning. First, when a new session of the pipeline is started, temporary directories associated to each sub-panel are created and assigned to a session/user. However, in order to preserve the available disk space, these directories are automatically removed at the end of the session. Therefore, the results stored on the directories must be explicitly saved on permanent directories, tape and database. Second, all configuration files are identified by a session/user/process/instrument attribute thus allowing each user to have its own set of customized configuration files. Third, all processes have a common data access layer which can retrieve/store data from tape/disk and access different databases depending on the privileges of the user. This ensures the integrity of the survey data at all times. Finally, the open nature of the system enables the system to evolve, making it easy to integrate new tools developed either by the survey team or by other users.
In summary, the framework provided by the graphic user interface represents the consolidation of the experience accumulated over the past few years. the integration of all functions of the survey system into a single environment and the standardization of the procedures involved in the execution, reduction, verification and release of data from a public imaging survey. Currently, the challenge is to integrate and interface the various pieces of software described above into the overall pipeline framework. While nearly all the tools have already been developed and tested their integration into the pipeline is still in progress.
5 EIS Products
Given the nature of the EIS project and the fact that current technology makes the widespread distribution of pixel maps very difficult, EIS was charged to prepare source catalogs and to select astronomical objects of potential interest for VLT observations [3],[4]. In order to do that in a well-defined and consistent way, standard procedures and tools have been developed to prepare and to verify: single passband catalogs; catalogs extracted from large area mosaics; color catalogs, produced either by association of single passband catalogs or by using a reference image [5], [6]; and photometric redshift catalogs. These procedures have been extensively tested and potential problems identified based on the vast experience gained in processing large amounts of data.
Even in the simplest case of single passband catalogs the procedures developed extend well beyond the simple extraction of sources and measurement of flux and structural parameters. The catalog production includes the standard removal of sources flagged by SExtractor, trimming of the catalog according to the weight map of its associated image, extinction correction, conversion of instrumental magnitudes into a standard system consistent with the filter used in the observations, automatic masking of regions surrounding bright stars, and proper consideration of noise properties of the image. The same is true for color catalog production where proper monitoring of multiple associations and the accuracy of the relative astrometry are monitored, depending on the method chosen for its production (association- or -method). It is also possible to select the data for a given passband to serve as the astrometric reference and redo the astrometric calibration on-the-fly to further ensure a good relative astrometric solution. Catalogs with photometric redshifts have also proven to be a valuable tool to identify potential problems with multi-color data and are produced whenever possible.
In order to validate the derived catalogs a suite of algorithms and visualization tools have been developed to examine the catalogs produced by the pipeline. These tools include: projected distribution, galaxy and stellar counts, counts-in-cells, angular correlation function, PSF analysis, color distribution, color-magnitude diagrams, color-color diagrams, and photometric redshift distribution. Tools are also available for comparison with other empirical data and/or with model predictions. To ensure consistency a library of stellar, galaxy and quasar spectra is available which allows the stellar and evolutionary tracks to be computed based on information available in the database regarding the setup used for obtaining the particular combination of data being verified.
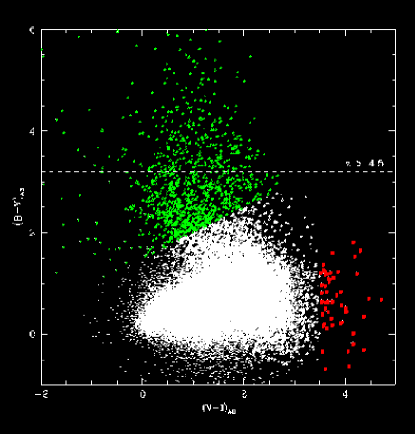
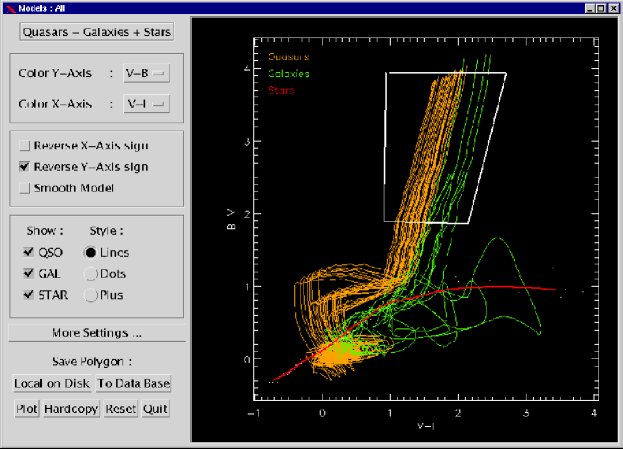
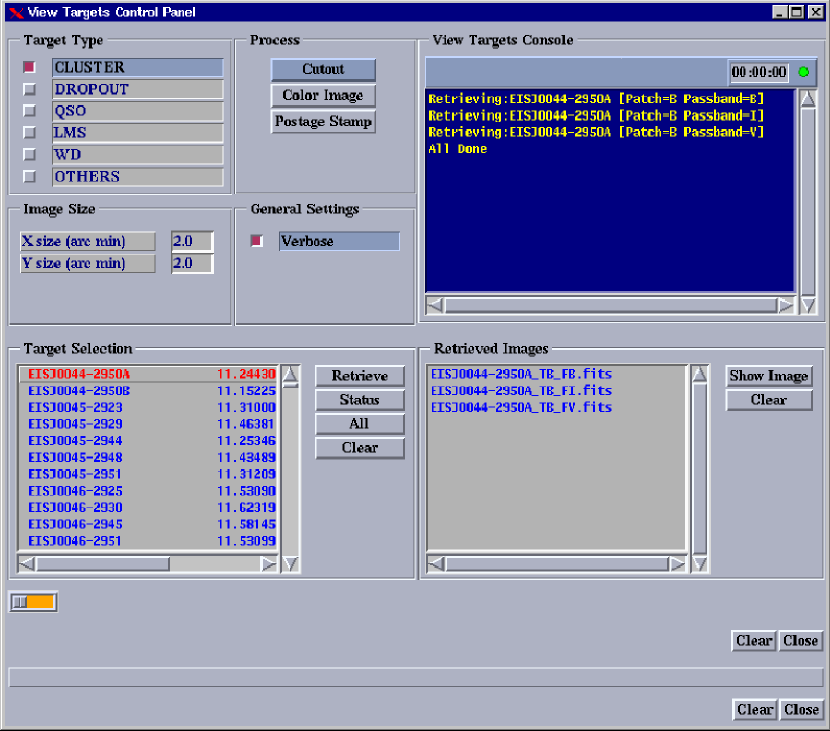
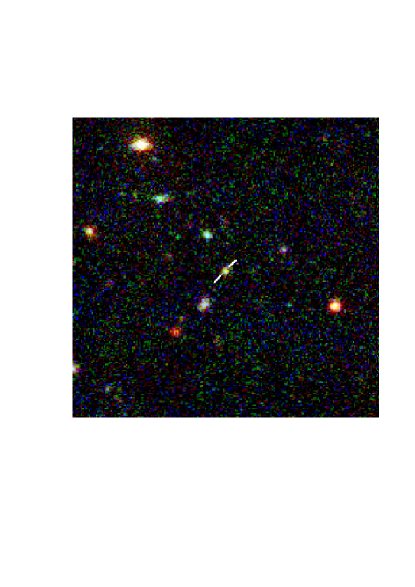
Tools are also available to search for subsets of objects of potential interest using selection criteria adopted by other authors or defined on-line using tools available in the pipeline which allow to define particular regions of interest, as illustrated in Figure 8. The selected regions can then be stored in the database and applied to the appropriate color catalogs to locate and produce a list of low-mass stars, white-dwarfs and high-redshift objects candidates as well as outliers in the color-color diagram. Figure 9 shows the final result of this analysis for faint sources within a region of 4 square degrees covered by EIS-WIDE and the Pilot Survey in . Besides the expected cloud of points corresponding to the locus of low-redshift galaxies of different morphological types, one finds potentially interesting populations in different parts of the diagram. Note the large number of high-redshift objects with estimated . Comparing the number of identifications with those predicted by models one may roughly assess the consistency of the catalog. Furthermore, by examining the location of outliers in the color image it may be possible to identify either objects of real scientific interest or possible problems in the production of the catalog. These selected objects can be stored in the database and visually inspected using the tool shown Figure 10, which allows the user to display the data in different ways such as: cutouts extracted from the images available in each passband; a composite of postage stamps from all the available images; a color composite image marking a specific (Figure 11) or a set of objects of a given type. The panel shown in Figure 10 also allows comments to be appended and to flag dubious objects. This information can also be stored in the database and can be used to eliminate objects in the preparation of final lists of candidates. By examining the objects in their image context it is possible to detect gross errors in the preparation of the color catalogs as well as cases where the colors of the object are likely to be affected by nearby objects.
6 Summary
By now the need for public surveys is generally recognized both as a scientific tool in its own right and as the means to produce a database of astronomical targets for the increasing number of large-aperture telescopes already in operation. Perhaps what is not yet fully appreciated is the magnitude of the effort required to produce an end-to-end survey system satisfying all the requirements for a stable and reliable operation of high-throughput running un-supervised for long stretches of time and making the data and information available to the community in a timely manner. Building a proper framework for carrying out such programs is essential to meet the expectations of the community and win their continuing support. The survey system presented here provides a solid basis from which one can ramp-up to handle the significantly larger data rates expected from future imaging surveys using larger CCD mosaics. On the short-term it represents a major step towards the ultimate goal of making the ongoing public surveys at ESO a routine operation, producing a steady stream of images and derived products that can be used to prepare statistical samples for VLT programs. Furthermore, in order to validate these products tools have been developed to handle, visualize and analyze multi-color data, to compare results with models or other empirical data and to correlate the derived catalogs with other databases. These tools are a modest first step towards the implementation of a more comprehensive archival research environment, along the lines envisioned by the ongoing effort to build virtual observatories, as required for the full scientific exploitation of the data from ongoing and future public surveys.
Acknowledgments
I would like to thank all the people involved in the EIS project, in particular those in the present team that have made significant contributions to the software development: S. Arnouts, C. Benoist, C. Rite, M. Schirmer, R. Slijkhuis and B. Vandame. Special thanks to E. Deul, R. Hook, R. Rengelink and A. Wicenec for their contributions over the years.
References
- [1] Renzini, A. & da Costa, L. 1999, The Messenger, 98, 33
- [2] Prandoni, I. et al., 2000, (astro-ph/0007395)
- [3] Olsen, L. et al.1999, A&A, 345, 681
- [4] Zaggia, S. et al., 1999, A&A Supp., 137, 75
- [5] da Costa, L. et al.1998, (astro-ph/9812105)
- [6] Benoist, C. et al.2001, in preparation