Search for an Near-IR Counterpart to the Cas A X-ray Point Source
Abstract
We report deep near-infrared and optical observations of the X-ray point source in the Cassiopeia A supernova remnant, CXO J232327.9584842. We have identified a mag and mag source within the 1- error circle, but we believe this source is a foreground Pop II star with –2800 K at a distance of kpc, which could not be the X-ray point source. We do not detect any sources in this direction at the distance of Cas A, and therefore place 3- limits of mag, mag, mag and mag (and roughly mag) on emission from the X-ray point source, corresponding to mag, mag, mag, mag, and mag, assuming a distance of 3.4 kpc and an extinction mag.
1 Introduction
Cassiopeia A (Cas A) is the youngest Galactic supernova remnant (SNR) with an age of yr, as according to Ashworth (1980) it is associated with the explosion observed by Flamsteed (1725) in 1680. Hughes et al. (2000) have found that the elemental abundances in Cas A are consistent with those expected from the remnant of a massive star, possibly a Wolf-Rayet star (Fesen et al. 1987), and therefore Cas A is considered to have been a Type II supernova. One therefore expects a compact central remnant, such a neutron star or black hole, based on the initial mass function of Type II supernovae (e.g. de Donder & Vanbeveren 1998). From the first-light images of the Chandra X-ray Observatory (CXO), Tananbaum (1999) reported detection of a compact source located at the apparent center of Cas A. The detection of this source, CXO J232327.9584842 (hereafter the X-ray point source or XPS), was later confirmed in archival ROSAT (Aschenbach 1999) and Einstein (Pavlov & Zavlin 1999) data.
The XPS is located within of the expansion center of Cas A (van den Bergh & Kamper 1983), and given the space density of AGN the chance of finding one within this distance of the center is quite small. We convert the count rates from Chakrabarty et al. (2001) to the 0.5–2.4 keV band, and get an absorbed flux of . Comparing this with the AGN - relation from Georgantopoulos et al. (1996), we would expect , or AGN of this flux at the center of Cas A. It is thus extremely improbable that the XPS is an AGN, a fact further confirmed by its relatively steep spectrum (Chakrabarty et al. 2001).
Therefore, it is generally believed that the XPS is associated with the remnant of the Cas A progenitor (Chakrabarty et al. 2001). The X-ray spectrum of the XPS, as determined by Pavlov et al. (2000) and Chakrabarty et al. (2001), can be fitted by a power-law with a photon index . Other acceptable fits include thermal bremsstrahlung ( keV), blackbody ( keV, km), or neutron star atmospheres ( keV, km for the model of Heyl & Hernquist 1998; keV, km for the model of Zavlin et al. 1996).
The nature of the XPS is unclear. However, we have an idea as to what it is not. The spectral index of the XPS is significantly steeper than those typical for young X-ray pulsars, its luminosity is times less than those of young X-ray pulsars, and there is no evidence for a synchrotron nebula (McLaughlin et al. 2001). The spectrum is similar to that of an anomalous X-ray pulsar (AXP; see Mereghetti 2000), but the X-ray luminosity is at least several (if not 10–100) times fainter than that typical for AXPs. The XPS is cooler but much more luminous than isolated neutron stars (Motch 2000).
Furthermore, there have not been any detections of optical (van den Bergh & Pritchet 1986; Ryan et al. 2001) or radio (McLaughlin et al. 2001, and references therein) emission from the XPS, nor have X-ray pulsations been detected (Chakrabarty et al. 2001), though the current limits are not very constraining. Therefore, the XPS is almost certainly not a young pulsar similar to the Crab. Theories as to its identity range from a cooling neutron star emitting from polar caps to an accreting black hole (Umeda et al. 2000; Pavlov et al. 2000).
From measures of line ratios in the Cas A remnant, Searle (1971) finds the extinction to be mag in the direction of one filament. Later radio studies found significant variations of on scales of , and overall values ranging from 4–5 mag for the north and northeastern rim and –6 mag for the rest of the SNR (Troland et al. 1985). Similarly, Hurford & Fesen (1996) find extinction values of 4.6–5.4 mag across the northern portion (assuming ). We will therefore adopt a middle value of mag. We assume that Cas A and the XPS are at a distance of kpc (Reed et al. 1995), which we parameterize as kpc.
In this letter we report on optical/near-IR searches for a counterpart to the XPS. We believe that given the unknown nature of XPS, searches at all wavelengths are warranted and even upper limits may constrain the nature of this enigmatic source. The paper is organized as follows: in Section 2 we detail our observations and reduction techniques. Section 3 contains a description of the results, while Section 4 presents an analysis of these results. Finally, a discussion and conclusions are in Section 5.
2 Observations
2.1 Cas-A Central Point Source Position
The SNR Cas A was observed several times with the CXO. After the initial detection in the first-light images (Tananbaum 1999), a long HRC-I observation was obtained on 1999 December 20, and a third observation with the HRC-S in imaging mode was taken on 2000 October 5. A discussion of the results from this observation is in preparation (Murray et al. 2001); here we provide only the source location information. Table 1 gives the point source locations and estimated uncertainties (including estimates of systematic errors). We estimate that the overall positional uncertainty for all of these observations is (1-).
2.2 Optical and Near-IR Observations
The observations were carried out primarily with the Near Infrared Camera (NIRC; Matthews & Soifer 1994) mounted on the 10-m Keck I telescope, augmented with archival HST/WFPC2 images. We also took auxiliary optical and infrared calibration images with the COSMIC imager on the Palomar 5-m telescope (P200), the PFIRCAM (Jarrett et al. 1994) infrared imager on the P200, and the P60CCD optical imager on the Palomar 1.5-m telescope (P60). A summary of the instruments, filters, exposures, and conditions is listed in Table 2.
The optical data were reduced with the standard IRAF ccdred package. The images were bias subtracted, flat-fielded, registered, and co-added. The infrared data were reduced with custom IRAF software. The images were dark subtracted, flat-fielded, and corrected for bad pixels and cosmic rays. We then made object masks, which were used in a second round of flat-fielding to remove holes from the flats. The data were then registered, shifted, and co-added. The HST images were processed using the standard drizzling procedure (Fruchter & Mutchler 1998).
The data from the P60CCD were used as the astrometric reference. We matched 36 non-saturated stars to those from the USNO-A2.0 catalog (Monet 1998). Using the task ccmap we computed a transformation solution, giving residuals (all astrometric residuals are 1- for each coordinate unless otherwise indicated). We then used this solution to fit stars on the COSMIC images. Using 37 stars, we again obtained residuals.
We then used 15 stars on the COSMIC images to fit the HST image, getting residuals. This solution was then used for the infrared images, fitting 10 stars on the NIRC images with residuals. This gives position uncertainties relative to the ICRS, assuming the uncertainties intrinsic to the USNO-A2.0 are (for each axis; Monet 1998) We then transfered this solution to the PFIRCAM images ( residuals), but as this is only a photometric reference the absolute position is not important.
For the optical photometry, we used , , and observations of the standard fields111http://cadcwww.dao.nrc.ca/cadcbin/wdb/astrocat/stetson/query/ Landolt 110, NGC 7790, and PG 1657 (Landolt 1992; Stetson 2000) carried out with the P60CCD. We fit the observations over the whole night using airmass corrections and first-order color terms, and measured the zero-point magnitude. We then examined 25 stars on the Cas A images common to both the P60CCD and COSMIC images, and from this determined the zero-point for the photometric night. From these data we also determined the limiting magnitude to be mag.
For the infrared photometry, we used 3 observations of the faint UKIRT standard stars FS 29 and FS 31 (Casali & Hawarden 1992) taken with the PFIRCAM. These observations were used to determine , , and zero-points (we assumed the magnitudes were the same as the magnitudes, as the correction is typically mag: much smaller than our uncertainties; Persson et al. 1998). From these images we then found 5 stars common to the PFIRCAM and NIRC images, and determined zero-point magnitudes for NIRC.
3 Results
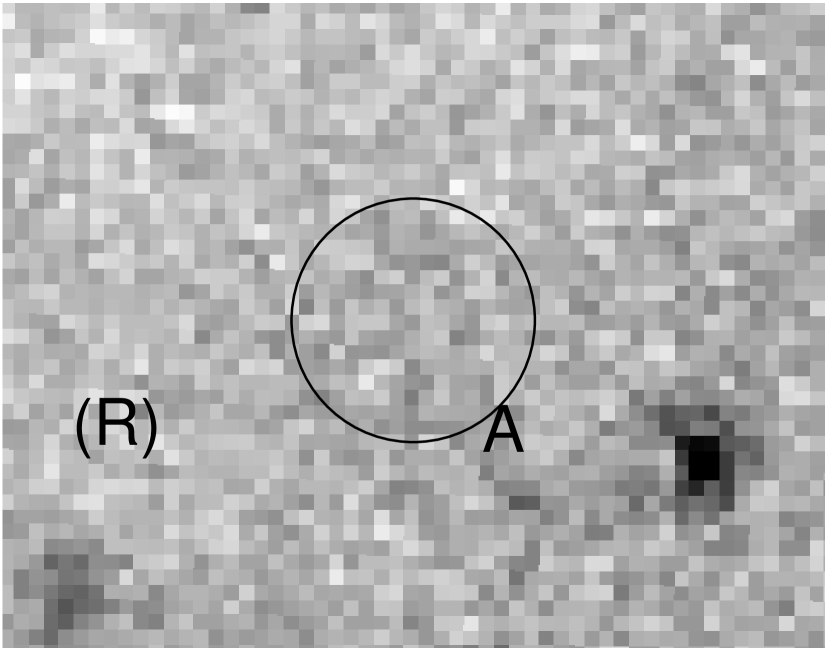
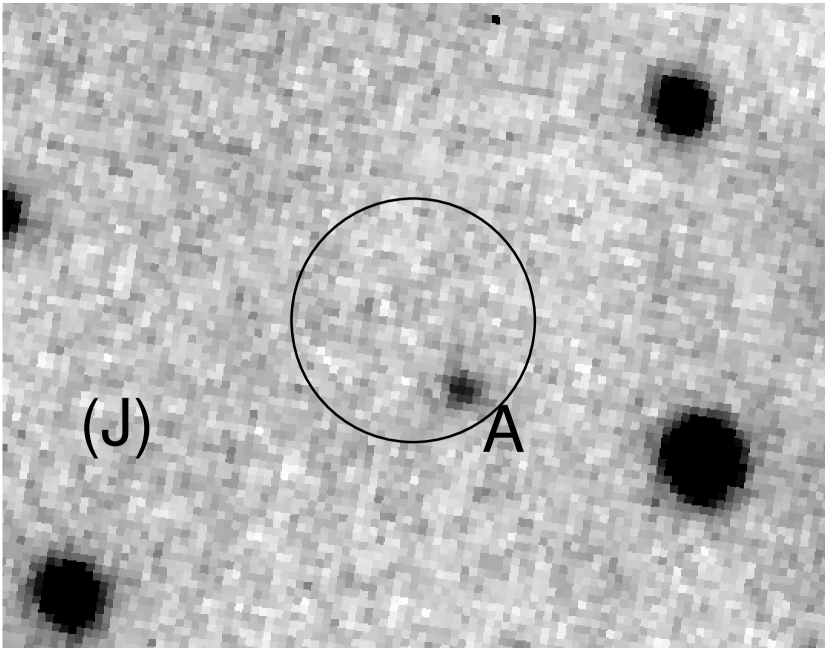
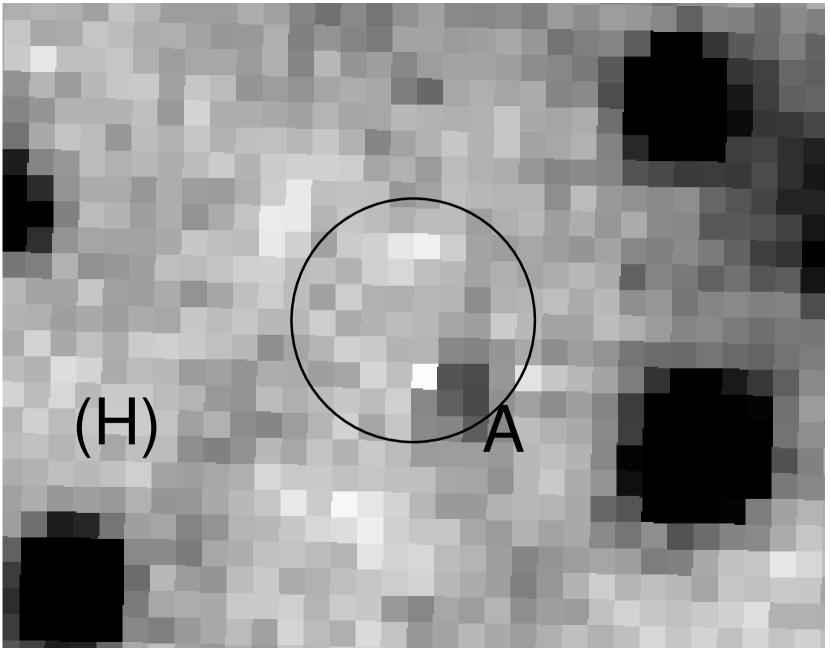
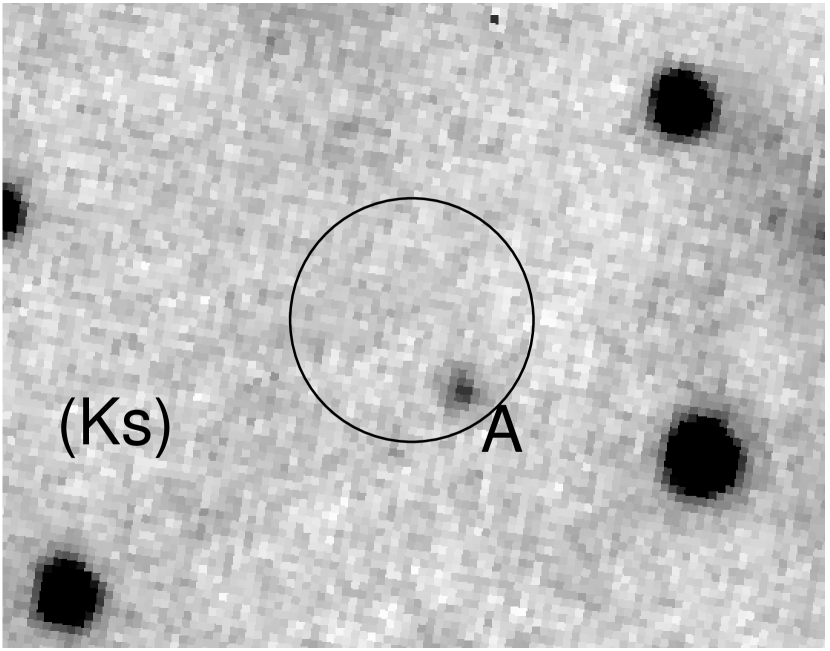
We searched for a counterpart to the X-ray point source, at position , , with uncertainty (Table 1). See Figure 1 for the separate optical/IR images. There was no source on COSMIC images, giving mag (3- limit) for any possible counterpart (this agrees with the previous limit of mag and mag; van den Bergh & Pritchet 1986). On the NIRC, PFIRCAM, and HST images there was a source away from the X-ray position, at , ( in each coordinate). Given the astrometric uncertainties, the overall position uncertainty is in each axis, so this source is 1.5- away from the nominal position. We label this source A, and consider it as a potential candidate counterpart or companion to the X-ray source. The magnitudes of source A are mag, mag, mag, and mag. There are no other sources within the radius 90% confidence circle.
4 Analysis
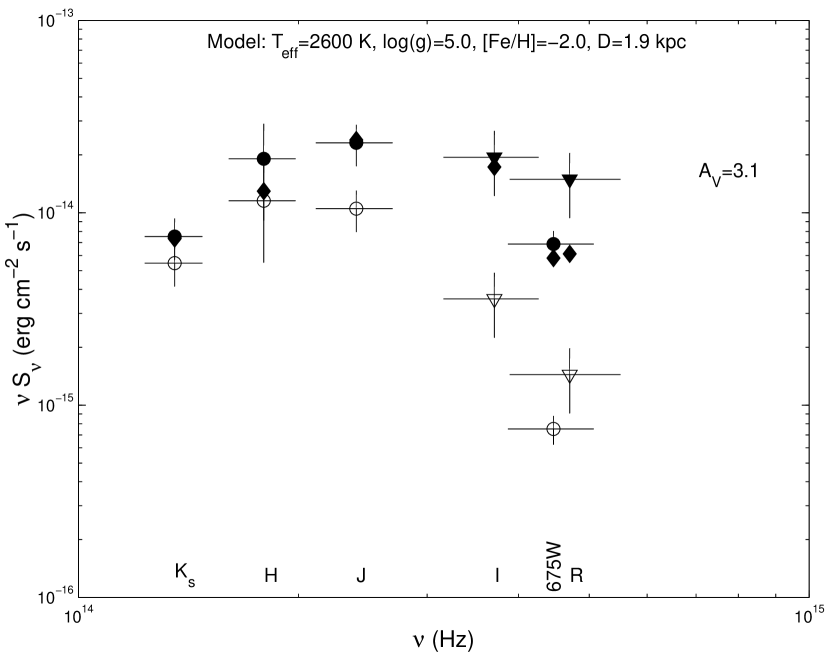
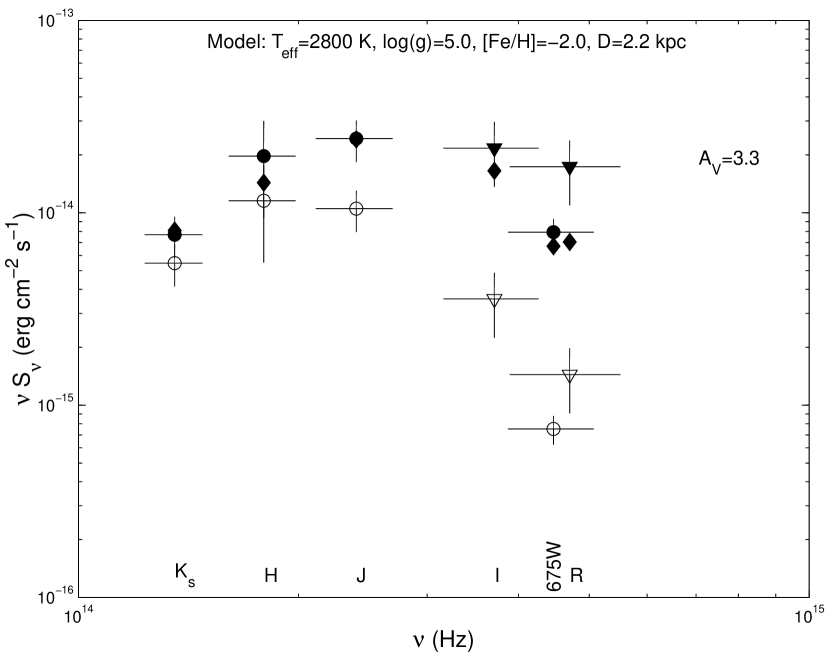
Using the reddening and zero-point calibration data from Bessell et al. (1998), we plot the spectral energy distribution (SED) for source A in Figure 2. This incorporates both the detections and limits.
To determine if source A could be a star, we compared model stellar colors from Bessell et al. (1998) with our data. We fitted for three parameters: the visual extinction , the distance in kpc , and the stellar model (which includes the effective temperature , the surface gravity , and the metallicity [Fe/H]). We assumed that the star would be a zero-age main-sequence star such that (Habets & Heintze 1981), and used the bolometric corrections and reddening from Bessell et al. (1998) to find the expected magnitudes. To account for the upper limits in our fitting, we minimized a modified statistic, such that
| (1) |
Here, runs over the different filters, is the observed magnitude or limit for that filter, is the model magnitude, and is the uncertainty. The model uses standard Vega-based magnitudes, where the HST data do not. Therefore we converted the HST magnitude to the Vega-based system using mag, appropriate for sources of this color222http://www.stsci.edu/instruments/wfpc2/Wfpc2_phot/wfpc2_cookbook.html. We do not incorporate model uncertainties into this statistic. Minimizing this seeks the best model that comes close in magnitude to the detections while remaining fainter than the non-detections. A full-fledged Bayesian analysis (e.g. Gregory & Loredo 1992; Cordes & Chernoff 1997) would be more accurate, but we only wish to demonstrate the plausibility of model fits, not assign specific probabilities to different models.
Given the number of variables, this fit is somewhat unconstrained. We restrict the extinction and distance to reasonable values ( mag, ), and fit for (appropriate for late M stars; Habets & Heintze 1981). In addition, we require that roughly scale with , excluding models that are very distant but have almost no extinction. We find that our detections and limits are entirely consistent with a cool (M6–8), Pop II, main-sequence star, which is between the Earth and Cas A. Good fits are obtained for stars with –2800 K, [Fe/H], –2.0 kpc, and –3.2 mag (see Figure 2 for examples). We do not give the value or formal confidence regions, as the in Equation 1 is somewhat contrived and the models for stars this cool are not well determined (Bessell et al. 1998), but Figure 2 demonstrates the plausibility of the fits. That there is a star within of the XPS is quite believable: the theoretical star-count models of Nakajima et al. (2000) give of the appropriate colors with mag, leading to a false coincidence rate of 1.0. The best-fit star has , , and . Slightly deeper band observations should be able to verify the classification of source A.
As one might expect, there is a significant anti-correlation in the fits between values of and , with kpc and mag variations giving reasonable fits, but the fits for the range of likely extinctions for Cas A (4–6 mag) at 3.4 kpc are definitely poor.
Assuming that source A is a late-type star, we examine whether it could be associated with the XPS, implying that both are in the foreground and that the XPS is not associated with Cas A. From Katsova & Cherepashchuk (2000), we see that for a star with (from the model for source A), the X-ray luminosity is 0.1–2.4 keV (also James et al. 2000; Marino et al. 2000), giving unabsorbed (denoted by superscript U) X-ray-to-infrared flux ratios of and for such a star. Converting the flux of the XPS to the ROSAT passband (using W3PIMMS333http://heasarc.gsfc.nasa.gov/Tools/w3pimms.html), it has ratios of , , which are drastically different. In addition, Pavlov et al. (2000) and Chakrabarty et al. (2001) did not observe any variability from the XPS, unlike late-type stars that can vary by factors of on small time scales (Marino et al. 2000). Source A therefore could not emit the X-rays observed from the XPS.
We conclude that the XPS was not detected, and add mag, mag and mag (3-), along with a rough limit of mag, to the previously mentioned limits.
5 Discussion & Conclusions
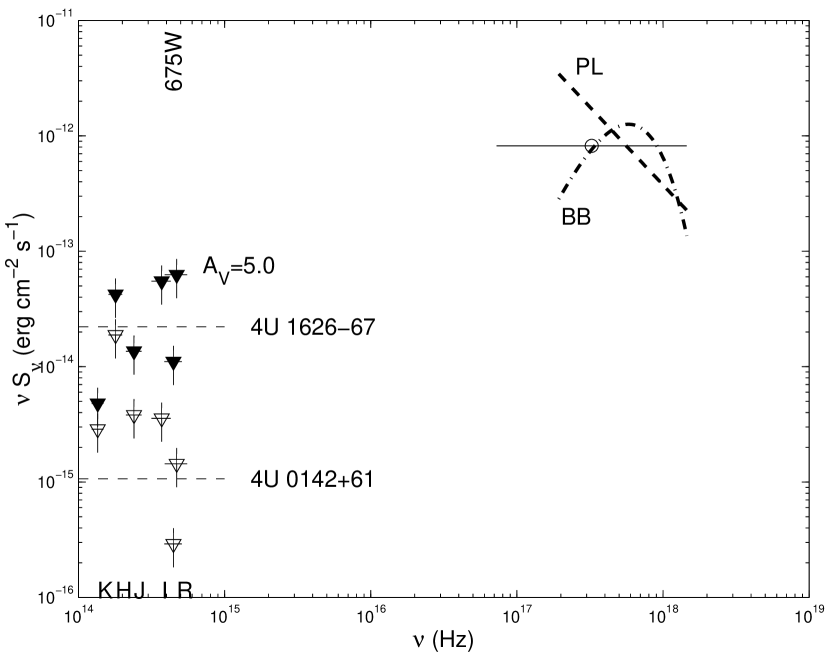
Based on a synthesis of CXO, ROSAT, and Einstein data, Pavlov et al. (2000) fit the X-ray spectrum of the XPS. The absorbed flux is in the 0.3–6.0 keV range (Pavlov et al. 2000). Power-law and pure blackbody models give good fits to the absorption-corrected data, and are plotted as representative X-ray spectra in Figure 3. These results are similar to those from Chakrabarty et al. (2001). Pavlov et al. (2000) prefer the results of a H/He polar-cap model with a cooler Fe surface, but all we wish to illustrate is that blackbody models are consistent with the optical limits, while power-law models require a break between the X-ray and optical bands.
In Figure 3 we also plot the expected optical magnitudes of representative X-ray sources (an AXP and a tight X-ray binary) for comparison. These magnitudes are derived by taking the X-ray-to-optical flux ratios for these objects and scaling them to the X-ray flux of the XPS. We can likely reject sources like 4U 162667 (Chakrabarty 1998) from consideration, but the extrapolation of the AXP 4U 014261 (Hulleman et al. 2000) is consistent with the current limits.
Giving the presumed distance and reddening, our limits translate to mag, mag, mag, mag, and mag. We find the observed X-ray-to-infrared flux ratios to be , , (the X-ray flux is in the 0.3–6.0 keV band). If we correct for interstellar absorption, we find unabsorbed ratios of , and , using the X-ray flux from Chakrabarty et al. (2001). These flux ratios, larger than those inferred previously, tighten constraints on the identity of the XPS (e.g. Umeda et al. 2000; Pavlov et al. 2000).
References
- Aschenbach (1999) Aschenbach, B. 1999, IAU Circ., 7249, 1
- Ashworth (1980) Ashworth, W. B. 1980, Journal for the History of Astronomy, 11, 1
- Bessell et al. (1998) Bessell, M. S., Castelli, F., & Plez, B. 1998, A&A, 333, 231
- Casali & Hawarden (1992) Casali, M. & Hawarden, T. G. 1992, UKIRT Newsletter, 4, 33
- Chakrabarty (1998) Chakrabarty, D. 1998, ApJ, 492, 342
- Chakrabarty et al. (2001) Chakrabarty, D., Pivovaroff, M. J., Hernquist, L. E., Heyl, J. S., & Narayan, R. 2001, ApJ, 548, 800
- Cordes & Chernoff (1997) Cordes, J. M. & Chernoff, D. F. 1997, ApJ, 482, 971
- de Donder & Vanbeveren (1998) de Donder, E. & Vanbeveren, D. 1998, A&A, 333, 557
- Fesen et al. (1987) Fesen, R. A., Becker, R. H., & Blair, W. P. 1987, ApJ, 313, 378
- Flamsteed (1725) Flamsteed, J. 1725, HISTORIA Coelestis Britannicae, tribus Voluminibus contenta (1675-1689), (1689-1720), vol. 1, 2, 3 (London : H. Meere; in folio; DCC.f.9, DCC.f.10, DCC.f.11)
- Fruchter & Mutchler (1998) Fruchter, A. & Mutchler, M. 1998, Space Telescope Science Institute Memo, 28 July
- Georgantopoulos et al. (1996) Georgantopoulos, I., Stewart, G. C., Shanks, T., Boyle, B. J., & Griffiths, R. E. 1996, MNRAS, 280, 276
- Gregory & Loredo (1992) Gregory, P. C. & Loredo, T. J. 1992, ApJ, 398, 146
- Habets & Heintze (1981) Habets, G. M. H. J. & Heintze, J. R. W. 1981, A&AS, 46, 193
- Heyl & Hernquist (1998) Heyl, J. S. & Hernquist, L. 1998, MNRAS, 298, L17
- Hughes et al. (2000) Hughes, J. P., Rakowski, C. E., Burrows, D. N., & Slane, P. O. 2000, ApJ, 528, L109
- Hulleman et al. (2000) Hulleman, F., van Kerkwijk, M. H., & Kulkarni, S. R. 2000, Nature, 408, 689
- Hurford & Fesen (1996) Hurford, A. P. & Fesen, R. A. 1996, ApJ, 469, 246
- James et al. (2000) James, D. J., Jardine, M. M., Jeffries, R. D., Randich, S., Collier Cameron, A., & Ferreira, M. 2000, MNRAS, 318, 1217
- Jarrett et al. (1994) Jarrett, T. H., Beichman, C. A., van Buren, D., Gautier, N., Jorquera, C., & Bruce, C. 1994, in Infrared Astronomy with Arrays, The Next Generation, ed. I. S. McLean (Dordrecht: Kluwer Academic Publisher), 293
- Katsova & Cherepashchuk (2000) Katsova, M. M. & Cherepashchuk, A. M. 2000, Astronomy Reports, 44, 804
- Landolt (1992) Landolt, A. U. 1992, AJ, 104, 340
- Marino et al. (2000) Marino, A., Micela, G., & Peres, G. 2000, A&A, 353, 177
- Matthews & Soifer (1994) Matthews, K. & Soifer, B. T. 1994, in Infrared Astronomy with Arrays, The Next Generation, ed. I. S. McLean (Dordrecht: Kluwer Academic Publisher), 239
- McLaughlin et al. (2001) McLaughlin, M. A., Cordes, J. M., Deshpande, A. A., Gaensler, B. M., Hankins, T. H., Kaspi, V. M., & Kern, J. S. 2001, ApJ, 547, L41
- Mereghetti (2000) Mereghetti, S. 2000, in The Neutron Star - Black Hole Connection, ed. V. Connaughton, C. Kouveliotou, J. van Paradijs, & J. Ventura (NATO Advanced Study Institute), (astro-ph/9911252)
- Monet (1998) Monet, D. E. A. 1998, in The PMM USNO-A2.0 Catalog (U.S. Naval Observatory, Washington DC)
- Motch (2000) Motch, C. 2000, preprint (astro-ph/0008485)
- Nakajima et al. (2000) Nakajima, T., Iwamuro, F., Maihara, T., Motohara, K., Terada, H., Goto, M., Iwai, J., Tanabe, H., Taguchi, T., Hata, R., Yanagisawa, K., Iye, M., Kashikawa, N., & Tamura, M. 2000, AJ, 120, 2488
- Pavlov & Zavlin (1999) Pavlov, G. G. & Zavlin, V. E. 1999, IAU Circ., 7270, 1
- Pavlov et al. (2000) Pavlov, G. G., Zavlin, V. E., Aschenbach, B., Trümper, J., & Sanwal, D. 2000, ApJ, 531, L53
- Persson et al. (1998) Persson, S. E., Murphy, D. C., Krzeminski, W., Roth, M., & Rieke, M. J. 1998, AJ, 116, 2475
- Reed et al. (1995) Reed, J. E., Hester, J. J., Fabian, A. C., & Winkler, P. F. 1995, ApJ, 440, 706
- Ryan et al. (2001) Ryan, E., Wagner, R. M., & Starrfield, S. G. 2001, ApJ, 548, 811
- Searle (1971) Searle, L. 1971, ApJ, 168, 41
- Stetson (2000) Stetson, P. B. 2000, PASP, 112, 925
- Tananbaum (1999) Tananbaum, H. 1999, IAU Circ., 7246, 1
- Troland et al. (1985) Troland, T. H., Crutcher, R. M., & Heiles, C. 1985, ApJ, 298, 808
- Umeda et al. (2000) Umeda, H., Nomoto, K., Tsuruta, S., & Mineshige, S. 2000, ApJ, 534, L193
- van den Bergh & Kamper (1983) van den Bergh, S. & Kamper, K. W. 1983, ApJ, 268, 129
- van den Bergh & Pritchet (1986) van den Bergh, S. & Pritchet, C. J. 1986, ApJ, 307, 723
- Zavlin et al. (1996) Zavlin, V. E., Pavlov, G. G., & Shibanov, Y. A. 1996, A&A, 315, 141
| OBSID | Date | CXO | Exposure | RAaaThe individual source positions were calculated as centroids of the event distributions taken within a radius circle about the location and iterated until the centroid location shifted by less than . | DecaaThe individual source positions were calculated as centroids of the event distributions taken within a radius circle about the location and iterated until the centroid location shifted by less than . |
|---|---|---|---|---|---|
| Instrument | (ks) | (J2000) | (J2000) | ||
| 214 | 1999 Aug 20 | ACIS S3 | 6 | ||
| 1505 | 1999 Dec 20 | HRC-I | 50 | ||
| 1857 | 2000 Oct 05 | HRC-S | 50 | ||
| Average | |||||
| Uncertaintybbfootnotemark: |
| Date | Telescope / | Observer | Band | Exposure | Conditions |
|---|---|---|---|---|---|
| Instrument | (s) | ||||
| 2000 Jan 22 | HST/WFPC2 | R. Fesen | F675W | 4000 | |
| 2000 Jun 27 | Keck I/NIRC | S. Kulkarni | 1600 | slight cirrus | |
| 2364 | |||||
| 2000 Jul 04 | P200/COSMIC | P. Mao | 1010 | photometric | |
| 2000 Jul 05 | P200/COSMIC | P. Mao | 1000 | high cirrus | |
| 2000 Jul 24 | P60/P60CCD | D. Kaplan | 150 | photometric | |
| 150 | |||||
| 2000 Sep 06 | P200/PFIRCAM | D. Kaplan / | 1680 | photometric | |
| J. Cordes | 1680 | ||||
| 1120 |