Pinpointing the massive black hole in the Galactic Center with gravitationally lensed stars
Abstract
A new statistical method for pinpointing the massive black hole (BH) in the Galactic Center on the IR grid is presented and applied to astrometric IR observations of stars close to the BH. This is of interest for measuring the IR emission from the BH, in order to constrain accretion models; for solving the orbits of stars near the BH, in order to measure the BH mass and to search for general relativistic effects; and for detecting the fluctuations of the BH away from the dynamical center of the stellar cluster, in order to study the stellar potential. The BH lies on the line connecting the two images of any background source it gravitationally lenses, and so the intersection of these lines fixes its position. A combined search for a lensing signal and for the BH shows that the most likely point of intersection coincides with the center of acceleration of stars orbiting the BH. This statistical detection of lensing by the BH has a random probability of . It can be verified by deep IR stellar spectroscopy, which will determine whether the most likely lensed image pair candidates (listed here) have identical spectra.
Submitted to ApJL.
1 Introduction
SgrA⋆, the unusual radio source in the Galactic Center (GC), which was long suspected to be the central massive black hole (BH) of the Galaxy, is now securely identified with the dark compact mass that was detected dynamically by IR observations of stars following a Keplerian velocity field (Eckart & Genzel Eck97 1997; Ghez et al. Ghe98 1998). The identification is based on the non-thermal spectrum of SgrA⋆ (e.g. Serabyn et al. Ser97 1997), on its compactness (Rogers et al. Rog94 1994), on its lack of detected motion (Backer & Sramek Bac99 1999; Reid et al. Rei99 1999) and on its position within ( in the GC) of the dynamical center of the Galaxy (Eckart & Genzel Eck97 1997; Ghez et al. Ghe98 1998). The nominal position of SgrA⋆ relative to the stars was established by aligning the radio and IR grids to within ( error) using 4 maser giants in the inner of the GC (Menten et al. Men97 1997). Recent measurements of the acceleration vectors of three stars very close to the BH provide another dynamical method for localizing the BH and constrain the center of acceleration to be inside an elongated ( error) region offset by from the nominal position of SgrA⋆ (Ghez et al. Ghe00 2000). Neither of these positions coincide with any observed IR point source. The extreme under-luminosity of the BH across the spectrum poses a challenge to theoretical accretion models (e.g. Narayan et al. Nar98 1998) and motivates the continuing effort to detect, localize and measure the flux of the BH in bands other than the radio.
A precise determination of the BH position is also relevant for solving the orbits of stars near the BH, which can be used to measure the BH mass and the distance to the GC (Jaroszynski Jar99 1999; Salim & Gould Sal99 1999) and to search for general relativistic effects (Jaroszynski Jar98 1998). The BH will not lie exactly at the dynamical center of the stellar cluster due to its Brownian motion. A detection of this offset, which is expected to be of order few mas (Bahcall & Wolf Bah76 1976), can be used to estimate and to probe the stellar potential and the formation history of the system.
Gravitational lensing of background stars by the BH offers another, independent way for localizing the BH, which is free of assumptions about , or the distribution of stars around the BH. The BH lies on the line connecting the two images of any background source it gravitationally lenses, and so the intersection of these lines fixes its position. The most reliable way to identify lensed image pairs is by their spectra, which should be identical up to differences caused by non-uniform extinction. At present spectra are available for all stars brighter than mag, but only for a few stars fainter than mag. No spectral identification of lensing has been reported yet. However, it is possible to use astrometric and photometric data to search statistically for the signature of lensing. This is motivated by rough estimates that suggest that there are several hundreds of distant background stars within of SgrA⋆ (Alexander & Loeb Ale01 2001).
A point mass lens is assumed here since the total stellar mass around the BH on the scale of interest is very small compared to . The possibility of one of the images being amplified by a star near the BH (Alexander & Loeb Ale01 2001) is neglected.
2 Method
The two gravitationally lensed images of a background source lie on one line with the point mass lens and the source, one on either side of the lens. The angular distances of the images from the lens, , and that of the source, , are related by ( by definition), where is the Einstein angle, , is the mass of the BH and , and are the lens-source, observer-lens and observer-source distances, respectively. The images are magnified by (e.g. Schneider, Ehlers & Falco Sch92 1992). It then follows that the ratios of the angular distances, the projected radial and transverse velocities and the fluxes of the two images obey the relations
| (1) |
where the velocities are measured relative to the lens. These constraints can be used to test whether two point sources are a pair of lensed images using astrometric and photometric data. The challenge lies in detecting a small number of true image pairs among the observed stars against the combinatorial background of the possible pairs in the presence of measurement errors.
The constraints on the lensed image pair can be expressed more robustly in terms of the projections
| (2) |
where and stands for the two-component vectors similarly constructed from , and , with the signs chosen so that for a lensed image pair. The definition of utilizes the fact that stellar positions are the best measured quantity in the data analyzed here. In the presence of measurement errors Eq. 2 is replaced by a score function,
| (3) |
where is the error in due to the measurement errors. The smaller the score, the more likely it is that the two stars are a lensed image pair.
It is not known how many lensed image pairs there are among the stars observed near the BH, if any, and so the search for the position of the BH and for the lensed image pairs has to be conducted simultaneously by looking for deviations from a random (unlensed) stellar field. This proceeds by enumerating over all possible locations for the BH around the nominal origin within a specified search field, which is very small compared to the entire stellar field; recalculating , and relative to the trial BH location; calculating for each of the possible pairs ; sorting the scores; calculating the likelihood for the best scores under the assumption of a random distribution; and finally, identifying the position of the BH as that with the minimal likelihood (ML) in random. The choice of the best scores minimizes the number of dependent pairs in random draws. Dependent pairs, such as and , increase the noise because they cannot both be lensed image pairs. Formal confidence limits on the ML position are calculated in the same way as for maximal likelihood parameter estimation.
The probability distribution function (PDF) of the best scores and their likelihood in unlensed data are estimated directly by Monte-Carlo (MC) simulations. The simulations consist of re-shuffling the actual data by rotating each stellar position and velocity vector by random angles and by randomly permuting the fluxes among the stars. In addition, the entire data is randomly shifted within the search field to avoid biases with respect to the nominal origin. This procedure conserves the averaged radial density distribution, velocity field and luminosity function while randomizing any angular correlations.
Some of the pairs are filtered out to further suppress the combinatorial noise. A fraction of the stars have spectral type identification and line-of-sight velocity measurements. Pairs whose stellar types (early or late type) are discrepant are not compared, and so are stars whose line-of-sight velocities are discrepant by more than . In addition, only pairs with are considered. This is necessary for avoiding pairs whose distance from the center is too small relative to the astrometric errors to allow a reliable test of co-linearity, or pairs whose Einstein angle clearly exceeds the upper limit for a source at infinity, based on estimates of the BH mass, (Genzel et al. Gen00 2000) and the distance to the GC, kpc (Reid Rei93 1993). In practice, the results do not depend strongly on the exact filtering criteria as long as the search field is not too large.
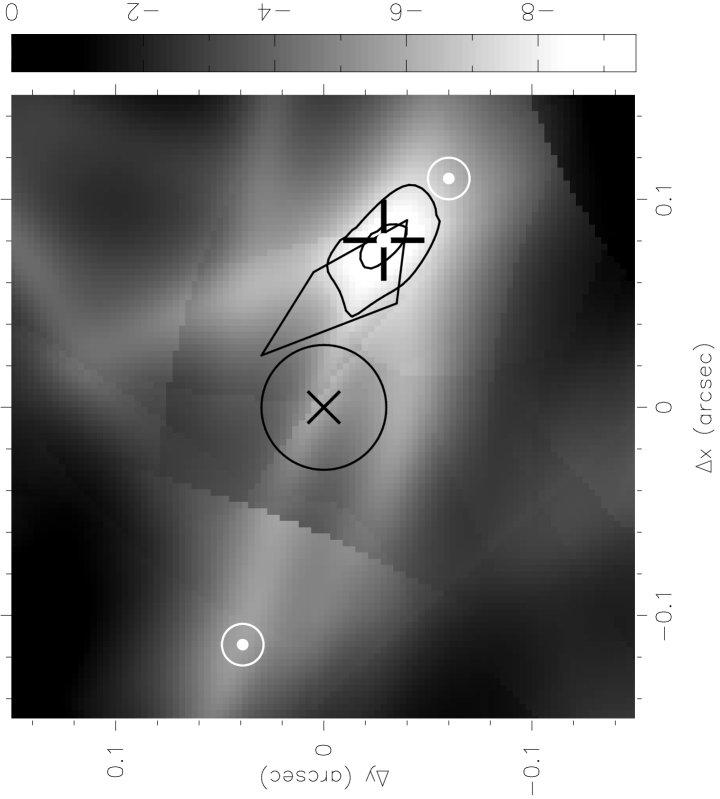
The random probability for finding a ML smaller than that found in the data is , where is the probability of any given position in the search field to have a likelihood , which is calculated from the random PDF, and where is the size of the enumeration over the BH position. The actual value of is much smaller than the search field grid size (here ) because nearby locations are not independent due to the smoothing effect of the measurement errors (Fig. 2). However, it can be estimated by , the MC median of the likelihood probabilities in randomly re-shuffled fields constructed from the data. Inspection of the likelihood plot in Fig. 2 suggests that there are of order resolution elements in the search field, in agreement with the MC estimate .
3 Results
The analysis is based on the compilation of Genzel et al. (Gen00 2000), which includes all available astrometric observations of stars in the inner of the GC. The compilation lists the stellar positions at a common epoch, proper and radial velocities, when available (error weighted averages if more than one measurement exists), K-band magnitudes and spectral types, when known. The positions are the best measured quantity. Individual errors are quoted only for the velocities. Genzel et al. (Gen00 2000) estimate a typical astrometric error of mas (random and systematic). Magnitudes are accurate to better than mag for stars with mag, while fainter magnitudes are listed without errors to mag precision. A magnitude uncertainty of mag is assumed here for all stars. The sample is augmented by 20 stars observed by Ghez et al. (Ghe98 1998) that were not included in the compilation because of their uncertain velocity measurements, bringing the total to 295 stars. Of these, 116 stars have a complete set of measurements (position, proper velocity and magnitude) and are used in the analysis.
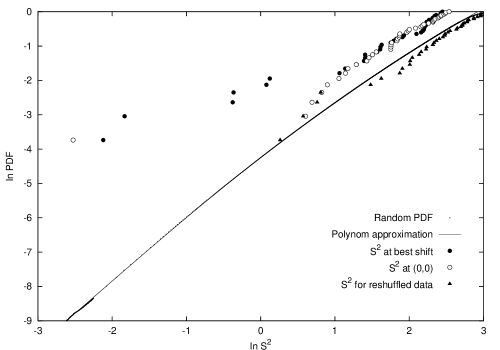
The results presented here are based on MC runs with filtering criteria (a margin above the maximal value of ) and . The latter corresponds to a chance co-linearity probability of (hence the importance of using the additional constraints on the velocities and fluxes). Figure 1 compares the random PDF with the approximating polynom that is used for calculating the likelihood, with the distribution of the best scores in one of the randomly re-shuffled realizations, with the scores at the nominal origin and with those at the most likely BH location. Figure 2 shows the likelihood across the search field. The position of the ML at , relative to the nominal origin lies within the error region on the center of acceleration (Ghez et al. Ghe00 2000) and is away from the nominal origin. The ML has a random probability of . The position of the ML is insensitive to moderate changes in , , or to whether the three innermost stars are included in the data set or not, or to higher assumed values of up to mag, which may better describe the errors in the flux ratio given the patchy nature of the extinction in the inner GC (Blum, Sellgren & DePoy Blu96 1996). However, increases when larger errors are assumed. The results are sensitive to the values adopted for the velocities. 90 stars of the compiled data were observed with the Keck telescope at high resolution ( mas) over a baseline of 2 yr (Ghez et al. Ghe98 1998). The ML analysis of the original Keck data has a global minimum at the edge of the search field and only a weak local minimum near . The difference is due to the compiled velocities, which are the average of the high resolution, short baseline astrometry and of lower-resolution, longer baseline astrometry.
|
|
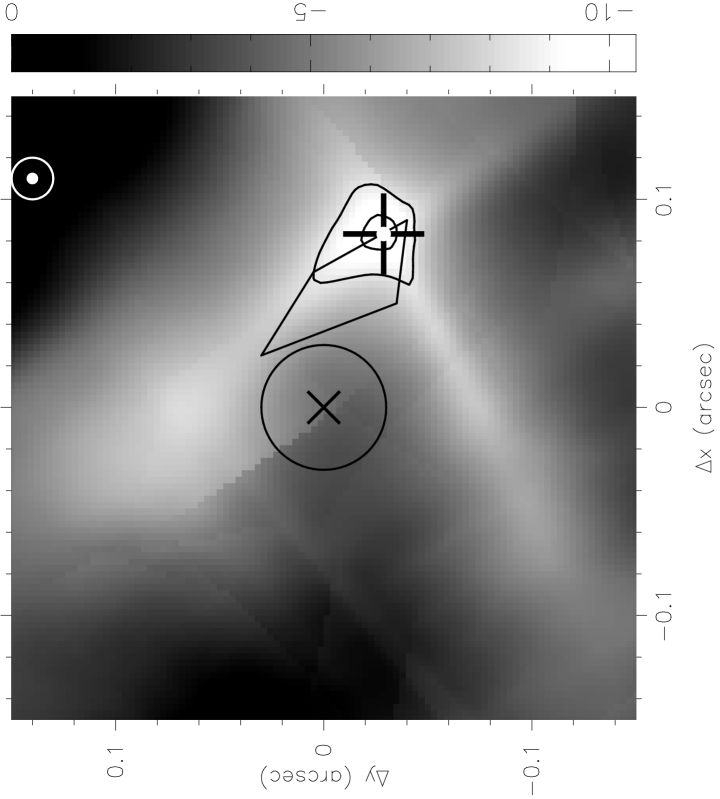
Table 1 lists the ten most-likely image pair candidates. At present none of them have spectra for both images. The results of simulations with mock stellar fields with properties similar to those of the data (Fig. 2) confirm that the ML analysis has a high rate of success in finding the position of the BH with as few as 3 image pairs in the data. The simulated image pairs are usually ranked very close to the top of the list, but some highly ranked candidates are false identifications.
| a | b | a | a | c | c | d | d | d | d | #1e | #2e | |
| 0.12 | 1.09 | 1.05 | 2.29 | 0.51 | 11.6† | 14.8 | -253 | -118 | +127 | +53 | 58 | 13 |
| 0.14 | 1.61 | 3.82 | 1.73 | 1.49 | 13.4† | 13.9 | -118 | -129 | -94 | +11 | 44 | 34 |
| 0.71 | 1.23 | 1.03 | 2.94 | 0.51 | 11.4† | 14.8 | -176 | -118 | -73 | +53 | 70 | 13 |
| 0.72 | 2.00 | 2.29 | 2.31 | 1.73 | 12.5† | 13.3 | -314 | -191 | -152 | -57 | 64 | 39 |
| 1.11 | 1.29 | 1.04 | 2.98 | 0.56 | 11.9 | 15.0 | +121 | +71 | +131 | -227 | 72 | 12 |
| 1.14 | 1.09 | 2.15 | 1.28 | 0.94 | 12.5 | 12.9 | +345 | -49 | -39 | +202 | 28 | 20 |
| 2.82 | 1.73 | 2.21 | 2.01 | 1.49 | 12.9 | 13.9 | -75 | -129 | +134 | +11 | 49 | 34 |
| 3.18 | 1.73 | 1.03 | 4.25 | 0.71 | 11.2 | 14.0 | +146 | +104 | -24 | +104 | 93 | 15 |
| 3.57 | 1.07 | 1.03 | 2.61 | 0.44 | 12.4† | 15.0 | +444 | -248 | -335 | +384 | 67 | 9 |
| 3.59 | 1.21 | 1.05 | 2.61 | 0.56 | 12.4† | 15.0 | +444 | +71 | -335 | -227 | 67 | 12 |
| aEinstein angle and radial distances in arcseconds, relative to best fit BH position. | ||||||||||||
| bThe amplification of the brighter image. For the second image . | ||||||||||||
| cK-band magnitudes. A spectrum also exists if marked by (). | ||||||||||||
| dRadial and transverse velocities in , relative to best fit BH position. | ||||||||||||
| eRow number of source in table 1 of Genzel et al. (Gen00 2000). | ||||||||||||
4 Discussion and summary
The results of the combined search for a lensing signal and for the BH are intriguing because the most likely BH position coincides with the center of acceleration and because of the low random probability of the lensing signal. However, spectroscopic confirmation of the lensed image pair candidates is essential since the statistical significance of this result is sensitive to uncertainties in the measurement errors and because the location of the ML depends on the values adopted for the stellar velocities. More generally, a comprehensive spectroscopic search for sources with matching spectra is the best method for detecting lensing since it does not assume any specific mass distribution for the lens. Many of the lensed image pair candidates listed in Table 1 have small amplifications, , with a 2 mag average difference between the two images, and so none of the second images have spectral identifications. Until deeper stellar spectroscopy is available, the statistical analysis could be improved if individual errors were made available for all the measured quantities. It should be noted that the 4 maser giants used for aligning the radio and IR grids are themselves not stationary (the closest to the center, IRS7, has a proper motion of , Genzel et al. Gen00 2000). Uncorrected, this could lead to small systematic shifts between astrometric observations taken at different epochs. Such shifts are unimportant for determining the dynamical center, but could introduce errors in astrometric lensing searches in heterogeneous compilations, especially for very high resolution data.
To summarize, astrometric and photometric observations of stars very near the BH in the GC can be used to pinpoint the BH on the IR grid with as few as 3 lensed image pairs in the field to an accuracy comparable with that of dynamical methods. An analysis of all available astrometric data indicates that the most likely position of the BH coincides with the center of acceleration of stars orbiting the BH. Lensing by the BH has been detected statistically with a random probability of . This result can be verified by deep stellar spectroscopy.
References
- 1 Alexander, T. & Loeb, A., 2001, ApJ, in press (astro-ph/0009404)
- 2 Backer, D. C., & Sramek, R. A., 1999, ApJ, 524, 805
- 3 Bahcall, J. N., & Wolf, R. A., 1976, ApJ, 209, 214
- 4 Barlow, R. J., 1989, Statistics, (Wiley: Chichester), Sec. 5.3
- 5 Blum, R. D., Sellgren, K., & DePoy, D. L., 1996, ApJ, 470, 864
- 6 Eckart A., & Genzel, R., 1997, MNRAS, 284, 576
- 7 Fragile, P. C., & Mathews, G. J., 2000, ApJ, 542, 328
- 8 Ghez, A. M., Klein, B. L., Morris, M., & Becklin, E. E. 1998, ApJ, 509, 678
- 9 Ghez, A. M., Morris, M., Becklin, E. E., Tanner, A. & Kremenek T., 2000, Nature, 407, 349
- 10 Genzel, R., Pichon, C., Eckart, A., Gerhard, O. E., & Ott, T., 2000, MNRAS, 317, 348
- 11 Jaroszynski, M. 1998, Acta Astron., 48, 653
- 12 Jaroszynski, M. 1999, ApJ, 521, 591
- 13 Menten, K. M., Reid, M. J., Eckart, A., & Genzel, R., 1997, ApJ, 475, L111
- 14 Narayan, R., Mahadevan, R., Grindlay, J. E., Popham, R. G., & Gammie, C., 1998, ApJ, 492, 554
- 15 Reid, M., 1993, ARA&A, 31, 345
- 16 Reid, M. J., Readhead, A. C. S., Vermeulen, R.C., & Treuhaft, R. N., 1999, ApJ, 524, 816
- 17 Rogers, A. E. E., et al., 1994, ApJ, 434, L59
- 18 Salim, S., & Gould, A., 1999, ApJ, 523, 633
- 19 Schneider, P., Ehlers, J., & Falco, E. E., 1992, Gravitational Lenses, (Springer: New York)
- 20 Serabyn, E., et al., 1997, ApJ, 490, L77