Comparing Optical and Near Infrared Luminosity Functions
Abstract
The Sloan Digital Sky Survey [SDSS] has measured an optical luminosity function for galaxies in 5 bands, finding 1.5 to 2.1 times more luminosity density than previous work. This note compares the SDSS luminosity density to two recent determinations of the near infrared luminosity function based on 2MASS data, and finds that an extrapolation of the SDSS results gives a 2.3 times greater near infrared luminosity density.
1 Introduction
The current luminosity density of the Universe is an important input into estimates of both the chemical evolution of the Universe due to nuclear burning in stars, and the extragalactic background light or cosmic optical and infrared background. The luminosity density is found by an integral over the luminosity function of galaxies, and estimating the luminosity function of galaxies requires both photometric measurements of galaxies and redshifts for distances. The recent release by 2MASS (Cutri et al., 2000) of near infrared photometric data covering one-half the sky has led to two recent estimates of the near IR luminosity function: Kochanek et al. (2001) measured redshifts or used existing redshifts for a bright sample over a large [ sr] region on the sky, while Cole et al. (2001) analyze a deeper sample over an effective area of sr using redshifts from the 2 Degree Field Galaxy Redshift Survey [2dFGRS]. The massive optical photometric and spectroscopic Sloan Digital Sky Survey [SDSS] has also estimated the luminosity function of galaxies in five bands between 0.3 and 1 m (Blanton et al., 2001). The SDSS luminosity density is 1.5 to 2.1 times higher than previous estimates of the optical luminosity density. Blanton et al. (2001) go through the exercise of evaluating galaxy fluxes in the ways identical to the methods previously used, and found that the larger flux seen by the SDSS was due to the larger apertures employed by the SDSS.
This paper extrapolates this luminosity density comparison of the SDSS to other determinations into the near infrared.
2 Luminosity Density
| 0.354 | 0.477 | 0.623 | 0.763 | 0.913 | 1.25 | 2.20 | |
| [Mpc-3] | 0.0400 | 0.0206 | 0.0146 | 0.0128 | 0.0127 | 0.0104 | 0.0108 |
| -1.35 | -1.26 | -1.20 | -1.25 | -1.24 | -0.93 | -0.96 | |
| -18.34 | -20.04 | -20.83 | -21.26 | -21.55 | -21.40 | -21.57 |
While luminosity functions can be defined in many ways, using either parametric models or non-parametric estimators, this paper only compares the parametric Schechter (1976) luminosity function fits. The Schechter luminosity function is given by
| (1) |
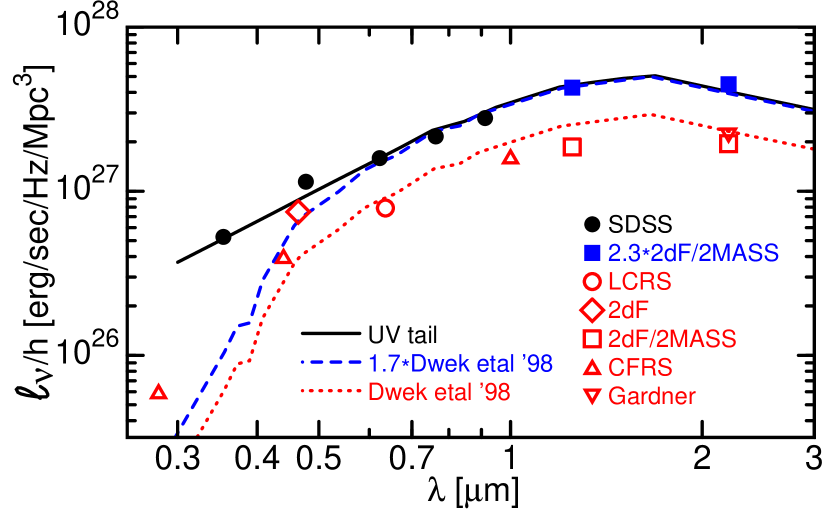
and it gives a luminosity density . This luminosity density is plotted as function of wavelength for the five SDSS bands from Blanton et al. (2001) and the near infrared J and K bands from Cole et al. (2001) in Figure 1 along with results from earlier optical and near infrared studies. Table 1 lists the parameters of the Schechter fits used to compute the luminosity density. Note that the measured luminosity densities scale like the Hubble constant , so the plotted densities have been divided by a factor of . It is clear that there is a large discontinuity between the optical SDSS bands and the near infrared bands. Also shown on Figure 1 is the mean spiral galaxy spectrum from Dwek et al. (1998). A least sum of absolute errors fit to a model that allowed different scaling factors in the optical and near infrared, and also allowed for an tail to the spectrum at short wavelengths, gave the heavy curve in Figure 1. The relative scaling between the SDSS and the 2MASS results was a factor of 2.3. The overall scaling was a factor of increase to get the Dwek et al. (1998) luminosity density to match the level of the SDSS data.

In order to study the source of the discrepancy between the SDSS and the 2MASS luminosity function, Figure 2 plots both the luminosity density and the three factors that go into the luminosity density as a function of wavelength. This plot clearly shows that the majority of the effect is caused by differences in . This plot also shows the Kochanek et al. (2001) “all galaxy” fit at 2.2 m, which is quite consistent with the Cole et al. (2001) fits.
3 Discussion
The local luminosity density difference of a factor of 1.5 between the SDSS and the 2dF (Folkes et al., 1999), and a factor of 2.1 between the SDSS and the LCRS (Lin et al., 1996), extends into the near infrared where an extrapolated SDSS luminosity density is a factor of 2.3 higher than recent determinations using 2MASS (Cole et al., 2001; Kochanek et al., 2001). The cause of the discrepancy between the SDSS and the LCRS and 2dF optical luminosity density determinations is the use of larger apertures by the SDSS (Blanton et al., 2001), but the cause of the difference in the near infrared has not been determined. If in fact the optical and near infrared luminosity density has been underestimated by a factor of about 2, this provides a partial explanation for the high extragalactic background levels seen by Bernstein (1999) in the optical; and Gorjian et al. (2000), and Wright & Reese (2000) in the near infrared. The background is given by
| (2) |
and while the luminosity functions discussed here only determine at , one expects that an increase in at low redshift would propagate smoothly to higher redshifts as well leading to an increased background.
The existing number counts , where is the number of sources per steradian brighter than flux , do not give a background as large as the observed backgrounds: at from counts (Madau & Pozzetti, 2000) vs. from DIRBE (Wright, 2001). The number counts for bright sources, in the Euclidean regime with , are related to the local luminosity function by
| (3) |
The bright end of the Madau & Pozzetti (2000) number counts at do agree with the Cole et al. (2001) determination of the luminosity function. Increasing the flux of each galaxy by using the larger SDSS apertures would increase at constant and thus explain the observed optical and near infrared backgrounds. The integral under the solid curve in Figure 1 gives a NIR-optical luminosity density of . This value is based on the SDSS data and the extrapolation of the SDSS data into the near infrared shown in Figure 1.
In a private E-mail, Shaun Cole suggested that the optical to near infrared colors of galaxies in common between the SDSS and 2MASS samples are normal and agree with the shape of the Dwek et al. (1998) curve in Figure 1; and that he did not expect that the 2MASS magnitudes missed a significant fraction of the flux - certainly not a factor of 2.3. If the SDSS luminosity densities are correct, this would suggest that a significant fraction of the galaxies in the SDSS catalog that should have been detectable in the near infrared were missed by 2MASS.
On the other hand, the SDSS luminosity densities could be too high. If so, the optical and near infrared background determinations could be too high, or an exotic source such as a decaying elementary particle [see the “DP” curve in Figure 1b of Bond, Carr & Hogan (1986)] could provide part of the background. If the background determinations are too high, the most likely cause of the error would be the zodiacal light modeling. In the near IR, replacing the “very strong no-zodi” model (Wright, 1997, 1998; Gorjian et al., 2000) with the Kelsall et al. (1998) model would increase the background, making the discrepancy larger. For example, Cambresy et al. (2001) use the Kelsall et al. (1998) model and get at .
At least some – if not all – of the luminosity function and background determinations discussed in this note are incorrect. In order to find out the true luminosity density from galaxies one will have to measure the total flux from galaxies in large apertures that include the low surface brightness fuzzy fringes.
References
- Bernstein (1999) Bernstein, R. 1999, in ‘The Hy-Redshift Universe: Galaxy Formation and Evolution at High Redshift’, eds. A. J. Bunker and W. J. M. van Breugel, ASP Conference Proceedings Vol. 193, 487
- Blanton et al. (2001) Blanton, M. et al., 2001, submitted to AJ[astro-ph/0012085]
- Bond, Carr & Hogan (1986) Bond, J. R., Carr, B. & Hogan, C. 1986, ApJ, 306, 428
- Cambresy et al. (2001) Cambresy, L., Reach, W., Beichman, C. & Jarrett, T. 2001, ApJ in press [astro-ph/0103078]
- Cole et al. (2001) Cole, S. et al., 2001, submitted to MNRAS[astro-ph/0012429]
- Cutri et al. (2000) Cutri, R. et al., 2000, “Explanatory Supplement to the 2MASS Second Incremental Data Release,” http://www.ipac.caltech.edu/2mass/releases/second/doc/explsup.html, viewed 28 March 2000.
- Dwek et al. (1998) Dwek, E. et al. 1998, ApJ, 508, 106
- Gorjian et al. (2000) Gorjian, V., Wright, E. & Chary, R. 2000, ApJ, 536, 550
- Folkes et al. (1999) Folkes, S. et al.. 1999 MNRAS, 308, 459
- Gardner et al. (1997) Gardner, J., Sharples, R., Frenk, C., & Carrasco, B. 1997, ApJ, 480, L99
- Kelsall et al. (1998) Kelsall, T. et al. 1998, ApJ, 508, 44
- Kochanek et al. (2001) Kochanek, C., Pahre, M., Falco, E., Huchra, J., Mader, J., Jarrett, T., Chester, T., Cutri, R. & Schneider, S. 2001, submitted to ApJ [astro-ph/0011456]
- Lilly et al. (1996) Lilly, S., Le Fèvre, O., Hammer, F. & Crampton, D. 1996, ApJ, 460, L1
- Lin et al. (1996) Lin, H., Kirshner, R., Shectman, S., Landy, S., Oemler, A., Tucker, D. & Schechter, P. 1996, ApJ, 464, 60
- Madau & Pozzetti (2000) Madau, P. & Pozzetti, L. 2000, MNRAS, 312, L9
- Schechter (1976) Schechter, P. 1976, ApJ, 203, 297
- Wright (1997) Wright, E. 1997, BAAS, 29, 1354
- Wright (1998) Wright, E. 1998, ApJ, 496, 1
- Wright & Reese (2000) Wright, E. & Reese, E. 2000, ApJ, 545, 43
- Wright (2001) Wright, E. 2001, ApJ in press [astro-ph/0004192]