From infall to rotation around young stellar objects: A transitional phase with a 2000 AU radius contracting disk?
Abstract
Evidence for a transitional stage in the formation of a low-mass star is reported, intermediate between the fully embedded and the T Tauri phases. Millimeter aperture synthesis observations in the HCO+ =1–0 and 3–2, HCN 1–0, 13CO 1–0, and C18O 1–0 transitions reveal distinctly different velocity fields around two embedded, low-mass young stellar objects. The 0.6 M⊙ of material around TMC 1 (IRAS 04381+2517) closely follows inside-out collapse in the presence of a small amount of rotation ( km s-1 pc-1), while L1489 IRS (IRAS 04016+2610) is surrounded by a 2000 AU radius, flared disk containing 0.02 . This disk shows Keplerian rotation around a star and infall at km s-1, or, equivalently, sub-Keplerian motions around a central object between 0.65 and . Its density is characterized by a radial power law and an exponential vertical scale height. The different relative importance of infall and rotation around these two objects suggests that rotationally supported structures grow from collapsing envelopes over a few times yr to sizes of a few thousand AU, and then decrease over a few times yr to several hundred AU typical for T Tauri disks. In this scenario, L1489 IRS represents a transitional phase between embedded YSOs and T Tauri stars with disks. The expected duration of this phase of % of the embedded stage is consistent with the current lack of other known objects like L1489 IRS. Alternative explanations cannot explain L1489 IRS’s large disk, such as formation from a cloud core with an unusually large velocity gradient or a binary companion that prevents mass accretion onto small scales. It follows that the transfer and dissipation of angular momentum is key to understanding the formation of disks from infalling envelopes.
1 Introduction
A central question in the study of the formation of stars and planetary systems is the dynamics of cloud core collapse, and the relative importance of infall and rotation in particular. In the general theoretical framework developed over the past 25 years (Shu, 1977; Lizano & Shu, 1989; Terebey, Shu, & Cassen, 1984; Li & Shu, 1997; Basu & Mouschovias, 1994, e.g.), clouds slowly form dense, centrally concentrated cores which are supported by a combination of turbulence, rotation, or weak magnetic fields. These cores grow until they reach an unstable equilibrium, after which they collapse on dynamical time scale, forming one or more stars. As material from the collapsing core accretes onto the central object(s), conservation of angular momentum leads to increased flattening and the growth of a circumstellar disk. These disks, detected around the majority of young stars (Beckwith et al., 1990; Beckwith & Sargent, 1996), are the progenitors of planetary systems. Little is known quantitatively about this transition from an infalling core to a rotationally supported disk. Early work by Terebey, Shu, & Cassen (1984) treated rotation as a perturbation to collapse, and was therefore limited to regions where rotation does not dominate the velocity field. Several groups have addressed the formation of flattened, disk-like structures without rotation but resulting from magnetic fields or initial conditions (Galli & Shu, 1993; Li & Shu, 1997; Hartmann, Calvet, & Boss, 1996, e.g.). Especially relevant to the observations described here are the numerical simulations by Yorke & Bodenheimer (1999) and Nakamura (2000).
This paper investigates the velocity structure around two embedded young stellar objects (YSOs: L1489 IRS and TMC 1) in detail, in order to shed more light on the mechanisms and time scales by which disks form from collapsing envelopes. Both YSOs are classified as Class I objects, with bolometric temperatures (Chan, Myers, & Ladd, 1995) of 238 K (L1489 IRS) and 139 K (TMC 1), and bolometric luminosities of 3.7 and 0.7 , respectively. In the near-infrared, they are visible in light scattered through their outflow cavities (Padgett et al., 1999), suggesting in both cases that we are viewing the system at inclinations between and . Previous interferometric observations in HCO+, 13CO, and C18O show flattened structures with indications of Keplerian rotation (Hogerheijde et al., 1998; Brown & Chandler, 1999). Taken together, these observations have led to a consensus picture, where the two YSOs are embedded in collapsing envelopes which become increasingly flattened and dominated by rotation on smaller ( AU) scales.
Recently, Hogerheijde & Sandell (2000, hereafter Paper I) analyzed the submillimeter-continuum emission as observed with SCUBA on the JCMT of four YSOs, including L1489 IRS and TMC 1. This work concluded that the density distribution around all four YSOs follows radial power-laws with indices between and , consistent with simple inside-out collapse (Shu, 1977). Their velocity structure as traced by HCO+ 3–2 and 4–3 line profiles confirmed that three of the four envelopes were indeed undergoing inside-out collapse, including TMC 1. The line profiles toward L1489 IRS did not match the velocities predicted by the inside-out collapse model for the best-fit parameters obtained from its continuum emission. Instead, this model predicted line widths exceeding the observations by factors of a few. Paper I concluded that L1489 IRS was instead surrounded by a 2000 AU radius, rotating, disk-like structure. The SCUBA data also revealed a starless core northeast of L1489 IRS, named L1489 NE-SMM, indicating that truly isolated star formation is rare even in Taurus.
The hypothesis that L1489 IRS is surrounded by a disk-like structure is further investigated here, in particular in the framework of the growth of a rotationally-supported disk within an infalling envelope. Previous aperture-synthesis observations of these sources already showed hints of the underlying dynamical structure, which was interpreted in both cases as indicative of rotation on AU scales. This paper presents new observations in HCO+ 1–0 and 3–2, 13CO 1–0, C18O 1–0, and HCN 1–0, obtained with the Berkeley-Illinois-Maryland Association array and with the Owens Valley millimeter array. The new data greatly improve the sensitivity and the coverage of different spatial scales, allowing a detailed, quantitative analysis of the velocity and density structure of the envelopes of both YSOs. We find that the velocity fields around both objects are remarkably different, suggesting infall in the presence of some rotation around TMC 1 and Keplerian rotation with some inward motions in a 2000 AU radius disk around L1489 IRS.
The outline of the paper is as follows. Section 2 describes the observations, and briefly discusses the methods used to combine data obtained from the two millimeter arrays. Section 3 presents the resulting integrated-intensity images and position-velocity diagrams, while section 4 explores models of the position-velocity diagrams and discusses the findings in an evolutionary framework where disks grow from collapsing envelopes to size of a few thousand AU and subsequently contract to several hundred AU. Section 5 concludes the paper by summarizing the main conclusions.
2 Observations and data reduction
Table 1 lists the dates of the observations presented in this work. The initial observations of L1489 IRS and TMC 1 with the Owens Valley Millimeter Array111The Owens Valley Millimeter Array is operated by the California Institute of Technology under funding from the U.S. National Science Foundation (#AST96–13717). (OVRO) took place in 1993–1997, and are described in detail in Hogerheijde et al. (1997, 1998). Observations to significantly increase the sensitivity and expand the -coverage followed in 1998–2000, and are further discussed here.
The HCO+ =1–0 and HCN =1–0 lines were observed using the Berkeley-Illinois-Maryland Association (Welch et al., 1996, BIMA) interferometer222The BIMA Array is operated by the Berkeley-Illinois-Maryland Association under funding from the National Science Foundation. in 1998 and 1999. Two configurations of the ten 6-meter antennas were used: the B-array, with projected baselines between 3 and 70 k, and the C-array (2–24 k). The digital correlator recorded the two lines in 12.5 MHz wide bands with 256 channels each, giving in a velocity resolution of 0.16 km s-1. The two remaining windows of the correlator registered the 3.4 mm continuum in a bandwidth of 400 MHz (upper + lower side band). Phase and amplitude variations were calibrated by observing the nearby quasars 3C84, 0238+166, and 0530+135 approximately every 30 minutes. The adopted fluxes of these quasars of 4.0, 3.0, and 3.0 Jy, respectively, were measured during the time of the observations using planets as primary calibrators. The calibration was performed using the MIRIAD (Multichannel Image Reconstruction, Image Analysis and Display; Sault, Teuben, & Wright 1995) task GFIDDLE. In addition to these single-pointed observations, three-point mosaics covering the core east of L1489 IRS and the outflow of TMC 1 in HCO+ and HCN 1–0 were obtained in a similar way with the BIMA array in the C-configuration in 2000 July.
The 13CO =1–1 and C18O =1–0 lines were observed with the OVRO array in 1999 and 2000. The six 10-meter antennas were placed in the low- and high-resolution configurations, with respective coverage of 2–42 and 8–90 k. Each of the two lines were recorded in two adjacent 2-MHz 32-channel wide bands with four overlapping channels. This resulted in a total velocity coverage of 10 km s-1 with a velocity resolution of 0.16 km s-1. The 2.7 mm continuum was registered separately in a bandwidth of 1 GHz. Phase and amplitude variations were calibrated using the MMA software package specific to OVRO (Scoville et al., 1993). The quasars 3C84 and 0333+321 served as gain calibrators with integrations every 20–30 minutes. Absolute flux calibration was obtained either from observations of Uranus, or from observation of bright quasars at the start or end of the track with fluxes measured during the period of the observations: 3C84, Jy; 3C454.3, 7.2 Jy; and 3C273, 9.9 Jy. To further increase the sensitivity to extended emission, the same 13CO and C18O 1–0 lines were also observed with the BIMA array in the C-configuration in 2000 July, with an observational setup similar to that for the other BIMA observations.
On 2000 December 5 L1489 IRS was observed at BIMA in the HCO+ =3–2 transition. The antennas were placed in C-configuration with projected baselines between 6 and 64 k. Of the nine antennas with 1 mm receivers, only eight could be successfully tuned to this high frequency; their nominal tuning range extends only to 270 GHz. The data from two more antennas were deleted because they had system temperatures twice the typical value of K. The HCO+ 3–2 line was recorded in a single correlator band with 256 98 kHz-wide (0.11 km s-1) channels and a total bandwidth of 25 MHz (28 km s-1). The continuum was recorded in a bandwidth of 275 MHz. Even under the favorable weather conditions during the observations (rms of path length variations over a 100 m baseline of 181 m; 8.8 mm of precipitable water), calibrating the phase variations requires much care. Observations of the phase calibrator, the quasar 3C84, track the total phase drifts which span several hundred degrees over the course of the track with point-to-point fluctuations of rms. However, it was found that the gain solution found from 3C84 cannot be applied to L1489 IRS because of additional atmospheric fluctuations over their projected distance of : Compared to the HCO+ 1–0 image (see section 3) it produces multiple copies of the object offset from the field center by , and places considerable flux in the sidelobes of the dirty beam. Instead we use the HCO+ 1–0 data as a model to self-calibrate the HCO+ 3–2 observations. Using only the range of 6–64 k in common with the 3–2 data, the image of the HCO+ 1–0 emission averaged over the velocity range of 6–9 km s-1 where most of the emission is found is almost point-like. Because the 3–2 line traces even denser material than 1–0, presumably found closer to the object, using this HCO+ 1–0 image as a model to self-calibrate the HCO+ 3–2 data, averaged over the same velocity range, is a conservative assumption. A time-averaging interval of 20 minutes was used, giving a signal-to-noise exceeding 6 is found on those baselines that have significant emission. This is sufficient to base a self-calibration solution on. In strict terms this procedure means that the HCO+ 3–2 image is now no longer fully independent of the HCO+ 1–0 data. However, the velocity structure is still independent because we have used the emission averaged over all channels between 6 and 9 km s-1 for the self-calibration. The calibration of the flux scaling was carried out by adopting a flux of 1.7 Jy for 3C84, obtained by extrapolating recent observations at 90 and 230 GHz to 267 GHz. The uncertainty in the flux scaling is estimated at %.
Subsequent processing of the data, including the joining of the two bands covering the 13CO and C18O 1–0 lines in the 1999/2000 OVRO data, was carried out with the MIRIAD software package. The new (1998–2000) and previously obtained (1993–1997) 3 mm line data were combined by interpolating the visibilities on a common velocity grid with a resolution of 0.17 km s-1. A more detailed description of the steps involved in combining data from the BIMA and OVRO instruments (the virtual CARMA333Combined Array for Research in Millimeter Astronomy, a joint initiative of the University of California at Berkeley, the University of Illinois at Urbana-Champaign, the University of Maryland, and the California Institute of Technology. array) is given in Hogerheijde et al. (in prep.). Since the primary beam size of the instruments differs ( for OVRO vs. for BIMA at 3.4 mm; vs. at 2.7 mm), only emission within the smaller of the two fields is properly sampled in the combined data. Since our main interest is in the emission in the inner few thousand AU of the envelopes, this is of no immediate concern here. Only the three-point mosaics address the larger scale emission, but they were obtained with the BIMA array alone and do not suffer from this effect. The model calculations presented in §4 take these different primary beam rigorously into account.
Images were produced using MIRIAD’s CLEAN algorithm and ‘robust’ weighting (robustness parameter 0–2) of the visibilities to optimize the signal-to-noise and the spatial resolution. In some cases (L1489 IRS: C18O 1–0; TMC 1: 13CO and C18O 1–0), the images were also convolved with a Gaussian to further improve the signal-to-noise. Resulting noise levels are 0.1–0.3 Jy beam-1 (1–3 K) in 0.17 km s-1 channels for the 3 mm line emission, 0.3 mJy beam-1 in a 0.11 km s-1 channel at 1 mm; and 0.9–1.3 mJy beam-1 at 3 mm and 70 mJy beam-1 at 1 mm for the continuum images; typical beams have a FWHM of – (Tables 2 and 3). Integrated-intensity and velocity-centroid images were obtained from the cleaned spectral-line cubes using a clip level. The HCO+ 1–0 and HCN 1–0 three-point mosaics were deconvolved with the MIRIAD task MOSMEM, a maximum entropy method better suited to handle extended structures and mosaics.
3 Results
3.1 Continuum emission
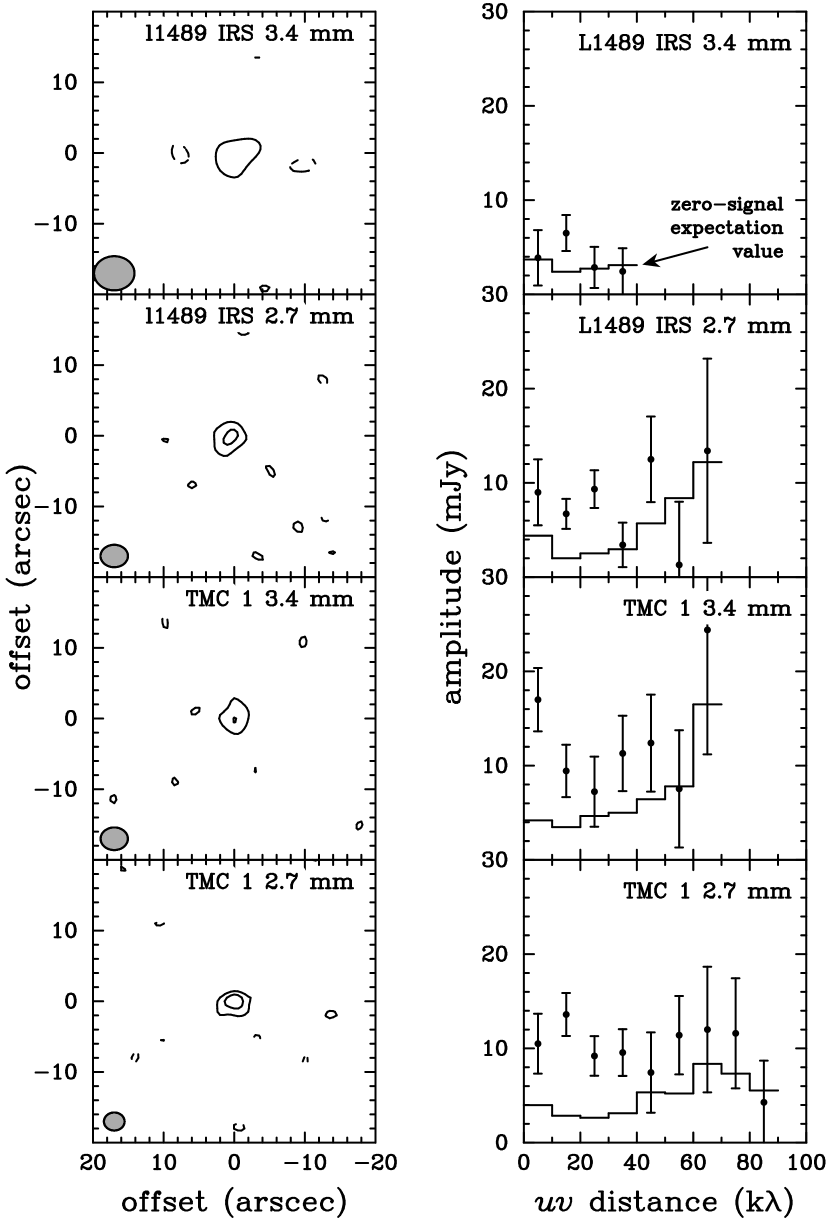
Continuum emission at 3.4 and 2.7 mm is detected toward both YSOs, at levels of 5–10 mJy depending on source and frequency (Fig. From infall to rotation around young stellar objects: A transitional phase with a 2000 AU radius contracting disk? and Table 2). No emission is detected at 267 GHz (1.1 mm) to L1489 IRS, with a 2 upper limit of 70 mJy. The positions listed in the Table agree within with those inferred from the single-dish submillimeter continuum measurements of Paper I, a good match given the spatial resolution in both data sets and the relatively low signal-to-noise of the interferometric 3 mm continuum data. This signal-to-noise ratio does not allow conclusions about the spatial distribution of the emission, e.g., using the amplitudes as function of distance (Fig. From infall to rotation around young stellar objects: A transitional phase with a 2000 AU radius contracting disk?).
Still, limits can be placed on the contribution from unresolved sources to the continuum flux by using the models of Paper I. The best-fit envelope models of Paper I predict fluxes at 2.7 mm of 3.0 mJy (L1489 IRS) and 1.1 mJy (TMC 1). These fluxes follow from Fourier-transformation of the model images, sampling at the positions of the data, transformation back to the image plane, and deconvolution. The resolving-out of extended emission is therefore accurately accounted for. The resulting fluxes are of the same order as those observed (5.8 and 7.7 mJy, respectively). A similar value of 3 mJy is found for L1489 IRS using the model developed in §4.1, while the upper limit of 70 mJy at 1.1 mm is consistent with the predicted flux at 1.1 mm of 50 mJy. When taking into account that the models may underestimate the dust temperature close to the source (see Paper I), no more than a few mJy is left for any additional, unresolved component. Adopting a dust temperature of 30 K and a ‘standard’ dust emissivity value at 2.7 mm of 1 cm2 g (Ossenkopf & Henning, 1994; Pollack et al., 1994, e.g.), these flux limits translate to gas+dust masses of , providing a strict upper limit to any compact dust disk around L1489 IRS or TMC 1 in addition to the more extended distribution of material modeled in §4. Centimeter-wave observations (Rodríguez et al., 1989; Lucas, Blundell, & Roche, 2000) suggest that no more than 0.5 mJy can be attributed to free-free emission at 3 mm.
3.2 Line emission
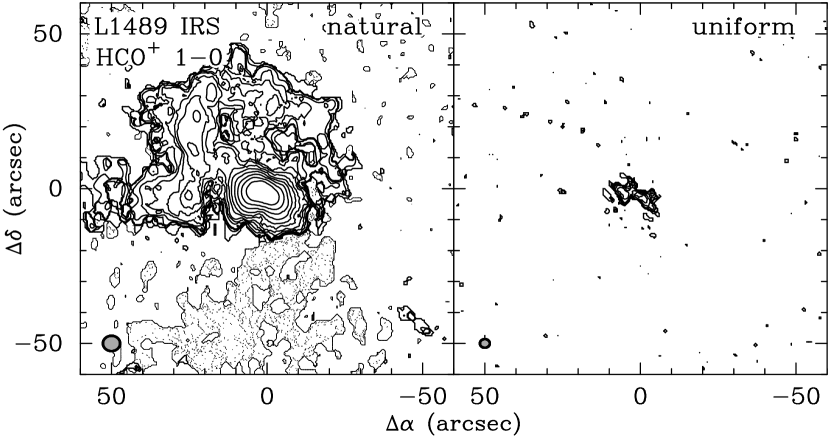
The incomplete sampling of extended emission by interferometric observations of embedded YSOs often plays an important role in the character of deconvolved images, and our HCO+, HCN, 13CO, and C18O 1–0 observations of L1489 IRS and TMC 1 are no exception. The HCO+ 3–2 observations of L1489 IRS are less affected by incompletely sampled large scale emission, because the higher critical density of this transition limits the emission to smaller regions and because fewer short spacings are present in the data set, filtering out extended emission more efficiently. Fig. From infall to rotation around young stellar objects: A transitional phase with a 2000 AU radius contracting disk? shows the integrated emission in HCO+ 1–0 toward L1489 IRS, comparing the uniformly-weighted image to the naturally weighted image. These two schemes represent the extremes of visibility weighing when inverting to the image plane: Natural weighting assigns equal weight to all visibilities, resulting in a lower resolution, but also lower noise and increased sensitivity to extended emission. Uniform weighting assigns equal weight to each interval in the -plane, effectively down-weighing the more densely sampled short baselines. This gives a higher resolution, but increases the noise, and only small-scale structures are recovered. These weighting schemes produce dramatically different images of L1489 IRS in HCO+ 1–0. With uniform weighting only a thin elongated structure is recovered at the position of the source. For natural weighting, this structure still dominates the image, but has become more bloated, and extended emission fills the northeast section of the image. The size of the emitting region is bound by the half-power primary beam width of the OVRO antennas (having the smaller primary beam of the combined BIMA and OVRO data) at from the field center. Negative ‘emission’ is present in the southern half of the image, indicating that significant amounts of extended flux are missing from the data. Comparison with single-dish observations of HCO+ 1–0 in the beam of the IRAM 30m antenna (Hogerheijde et al., 1997) indicates that from the central half arcminute all flux is recovered. Since it is this central region to which most of our attention is focussed, the missing larger scale flux is of no immediate concern.
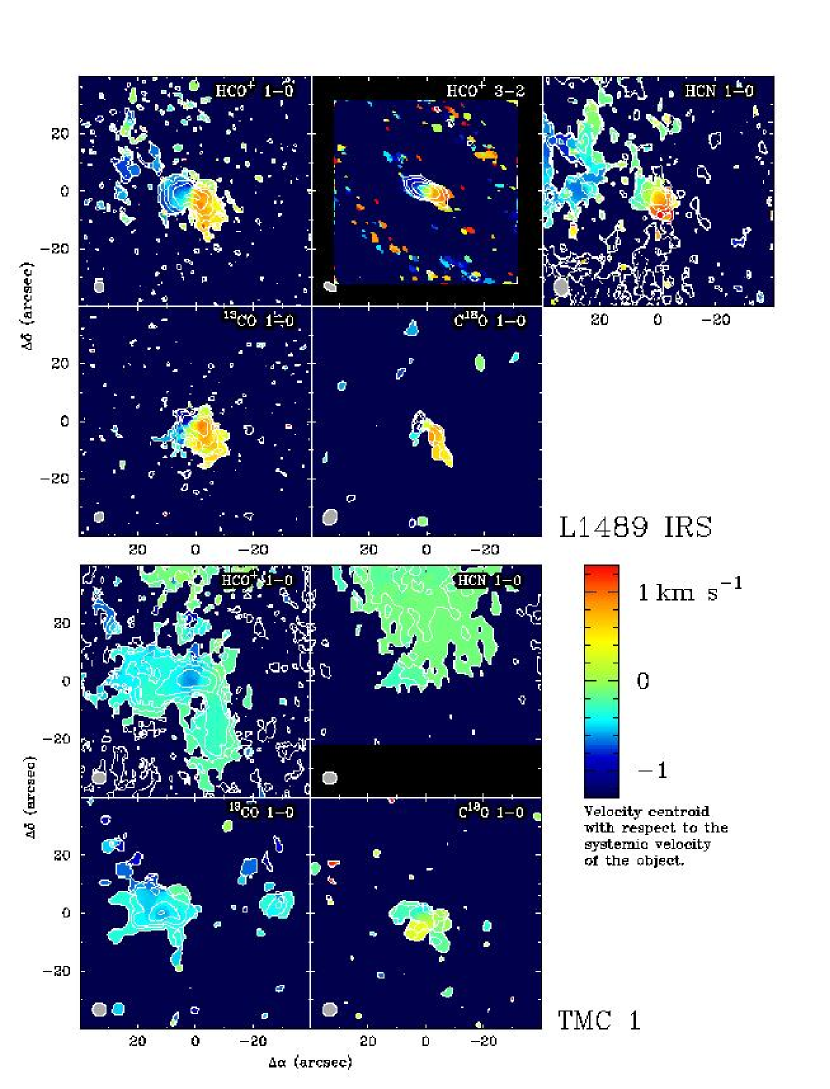
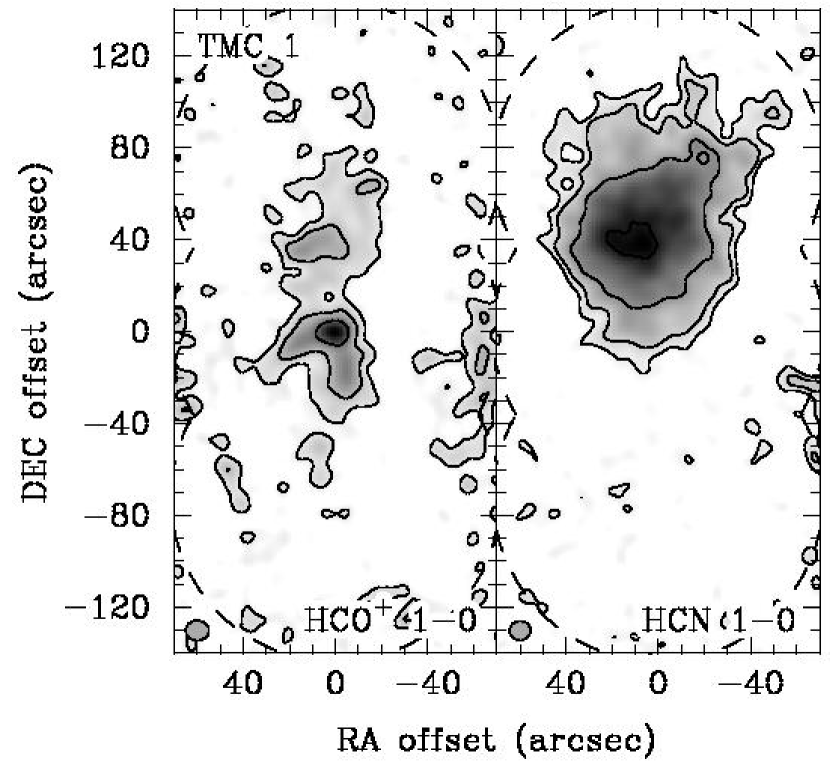
Figure From infall to rotation around young stellar objects: A transitional phase with a 2000 AU radius contracting disk? show the integrated-intensity images (contours) of all observed lines toward L1489 IRS and TMC 1, superposed on the velocity-centroid images (color scale; see below). The velocity planes of the data cubes were individually ‘cleaned’, after which the integrated-intensity (zeroth moment) and velocity-centroid (first moment) images were constructed using a clip-level of 3; negative emission was not included in the velocity-centroid images for clarity. All images are optimized for angular resolution and sensitivity using ‘robust’ weighting (Briggs, 1995), with a ‘robustness parameter’ dependent on the transition and source. This parameter can vary between and , where approaches natural weighting and uniform weighting. For L1489 IRS, this parameter was 0 for HCO+ 1–0 and 2 for HCO+ 3–2, 2 for HCN, 0 for 13CO, and 2 for C18O; in addition, the C18O image was smoothed with a Gaussian to increase signal-to-noise. For TMC 1, the robustness parameter was 2 for all transitions; the 13CO and C18O images were also smoothed with a Gaussian. This resulted in synthesized beam sizes with FWHM between and , as shown in the lower left of the panels of Fig. From infall to rotation around young stellar objects: A transitional phase with a 2000 AU radius contracting disk?. For the velocity-centroid images, the adopted systemic velocity of 7.3 km s-1 for L1489 IRS and 5.2 km s-1 for TMC 1 are based on single-dish observations of optically thin tracers such as C18O and H13CO+ (Hogerheijde et al., 1998).
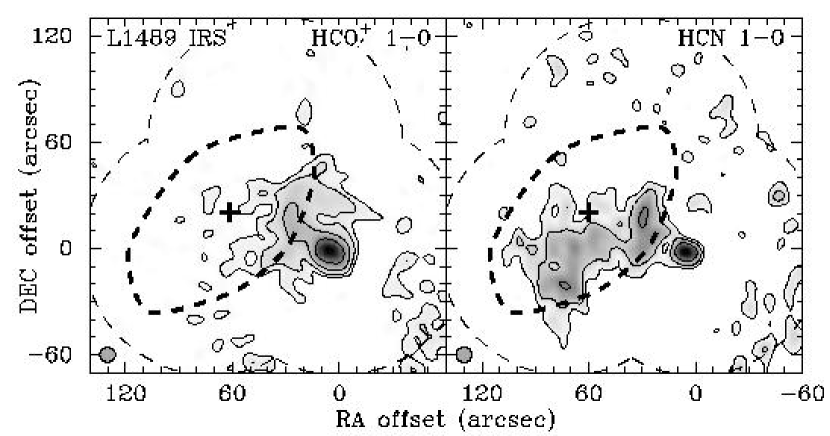
The emission around L1489 IRS (Fig. From infall to rotation around young stellar objects: A transitional phase with a 2000 AU radius contracting disk?) shows the elongated structure around the YSO with a red/blue velocity structure along the major axis indicative of rotation, earlier noted by Hogerheijde et al. (1998). In the HCO+ 1–0 and 3–2 images the line demarcating the red and blue emission is curved. Since it is seen in both transitions, it is likely real and associated with self-absorption in the presence of inward motions (see §4.1). The position angle of agrees closely with orientation of the equatorial plane inferred from near-infrared image obtained with NICMOS on HST that reveals a monopolar reflection nebula perpendicular to a dark lane (Padgett et al., 1999). The elongated structure coincident with the dark lane is clearly seen in HCO+ 1–0 and 3–2, HCN 1–0, and 13CO 1–0, and at lower signal-to-noise in C18O 1–0. In addition, HCO+ and HCN 1–0 trace extended emission near the source’s systemic velocity to the northeast of L1489 IRS. Figure From infall to rotation around young stellar objects: A transitional phase with a 2000 AU radius contracting disk? shows the image obtained from a three-point mosaic with BIMA in C-array, covering L1489 IRS and the starless core to its east, first identified by Hogerheijde & Sandell (2000) as L1489 NE-SMM. This core does not show up prominently in HCO+ 1–0, but its southern half is traced by HCN, indicating chemical differentiation along the starless core and between this core and the material around L1489 IRS. In one possible scenario, HCO+ traces the densest material close to the star, while HCN, which freezes out onto dust grains more easily, traces the warm material close to the star and the southern, chemically ‘younger’ part of the starless core. Chemical model calculations (Bergin & Langer, 1997) indicate that HCN is more abundant than HCO+ at early times ( yr or, equivalently, lower densities), after which it depletes rapidly while HCO+ increases.
Chemical differences are also present in the emission toward TMC 1 (Fig. From infall to rotation around young stellar objects: A transitional phase with a 2000 AU radius contracting disk?). In HCO+ 1–0, 13CO 1–0, and C18O 1–0 an elongated core can again be seen around the YSO, at a position angle of . This is coincident with the equatorial plane as inferred from single-dish CO 3–2 maps of its bipolar outflow and scattered-light near-infrared imaging (Hogerheijde et al., 1998); these observations also suggest an inclination close to (=edge-on). HCN does not prominently trace this core, but, instead, shows up strongly along the northern, blue-shifted outflow lobe. The ratio of the three hyperfine components indicates an a moderate opacity of 2–3 in the main component’s line at the peak of the emission. The images in all three hyperfine components are very similar, however. A three-point mosaic obtained with in BIMA C-array covering the outflow (Fig. From infall to rotation around young stellar objects: A transitional phase with a 2000 AU radius contracting disk?) illustrates this chemical differentiation more dramatically. HCN strongly peaks along the northern flow, while HCO+, although also revealing emission along both lobes of the flow, has its maximum at the source position. In fact, in the single pointing field of TMC 1 in Fig. From infall to rotation around young stellar objects: A transitional phase with a 2000 AU radius contracting disk?, HCO+ emission associated with the outflow is most prominent along the southern lobe, where no HCN emission is detected. The appearance of TMC 1’s continuum emission (Paper I) rules out a strong asymmetry in its envelope as an explanation for this disparity. Similarly, in CO 3–2 the outflow appears symmetrical as well (Hogerheijde et al., 1998). Differences in excitation conditions also do not offer a likely explanation, since both HCN and HCO+ 1–0 trace dense gas, with respective critical densities of and cm-3. More likely, the HCN gas-phase abundance is increased in the northern outflow lobe due to evaporation from icy grain mantles. Subtle differences in shock conditions between the two lobes appears to have lead to differences in temperature and evaporation rate. Toward a sample of high-mass YSOs, Lahuis & van Dishoeck (2000) find that the HCN gas-phase abundance is strongly dependent on gas kinetic temperature. The emission of HCO+ and HCN associated with the outflow is very narrow in velocity ( km s-1), indicating that, since the system is seen close to edge-on, any shocks driven into the material by the flow have a very small transverse component.
A narrow velocity extent is a general characteristic of the emission associated with TMC 1, as is immediately obvious from the comparison of Fig. From infall to rotation around young stellar objects: A transitional phase with a 2000 AU radius contracting disk? which are plotted using the same range for the color scaling. Close inspection also reveals that, although both sources appear similar in that they are embedded in elongated cores, these cores might be rather different in nature: The core around TMC 1 does not reveal the ordered red/blue structure seen toward L1489 IRS, although a small gradient along the equatorial plane is present. The core around TMC 1 extends further, by a factor of 2–3 from the YSO than the one around L1489 IRS. Finally, emission from the core around TMC 1 is predominantly located to one side of the source (east), with only the C18O emission symmetric around the YSO. This lopsidedness is particularly clear in 13CO, where the emission appears to peak east of the source position as inferred from continuum emission (§3.1 and Paper I). A second emission peak in 13CO is present west of the source, however, and Hogerheijde et al. (1998) find a remarkably large opacity () from single-dish 13CO and C18O 3–2 data. This leads us to suggest that significant fractions of the emission in HCO+, HCN, and 13CO may be obscured by resolved-out foreground material.
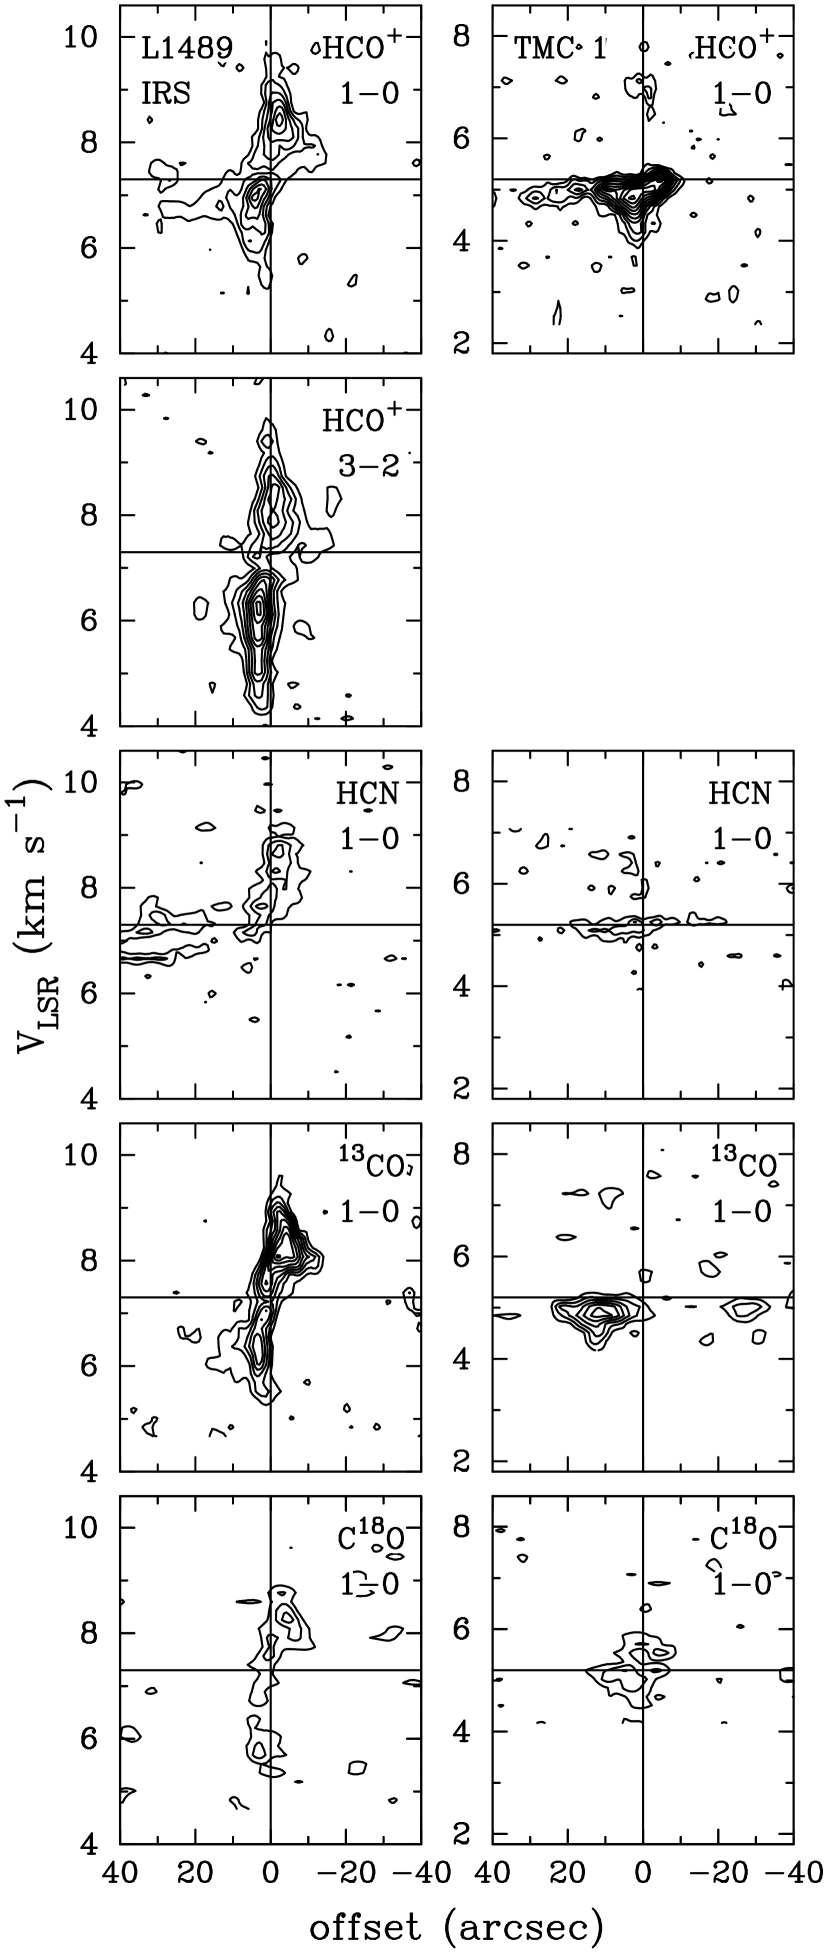
The velocity structure of both YSOs is presented in Fig. From infall to rotation around young stellar objects: A transitional phase with a 2000 AU radius contracting disk? through position-velocity diagrams taken along the equatorial planes of the objects. L1489 IRS, in HCO+, 13CO, and, at lower signal-to-noise, in C18O, shows the classical signature of rotation with emission in the first and third quadrants and largest velocities close to the source. The velocity structure of HCN includes material near the systemic velocity associated with the starless core east of the YSO. The nature of the velocity field of TMC 1 is far less clear. Hogerheijde et al. (1998) and Brown & Chandler (1999) interpreted the position-velocity diagram of TMC 1, based on lower sensitivity HCO+ data, as due to Keplerian rotation. In Fig. From infall to rotation around young stellar objects: A transitional phase with a 2000 AU radius contracting disk?, the lower-left quadrant of TMC 1’s HCO+ diagram is indeed superficially similar to L1489 IRS, and can be fit with rotation around a 0.8 object (but see §4.2). The corresponding emission in the first quadrant is missing, and both authors note that this source is heavily obscured, invoking absorption of the red-shifted HCO+ emission as the most likely cause. Unlike L1489 IRS, however, TMC 1’s HCO+ emission substantially ‘spills over’ into the second quadrant, and its C18O emission is symmetric around the source center and the systemic velocity. Together with the spatial discrepancies noted in the previous paragraph, this leads us to suggest that infall combined with heavy obscuration is a better description of TMC 1 than is rotation alone. Section 4.2 explores this suggestion quantitatively.
4 Models for the emission
This section models the density and velocity distribution of the material around L1489 IRS and TMC 1, trying to ascertain to what level rotation and infall shape the emission. The best-fit models derived from the SCUBA observations of Paper I serve as starting points. In particular, we adopt an outer radius of 2000 AU and a mass of 0.02 for the envelope around L1489 IRS, and the parameters of the inside-out collapse model for TMC 1: a sound speed of 0.19 km s-1 and an age of yr, with an envelope radius of 12,000 AU and containing 0.59 M⊙. The model calculations presented in this section use the two-dimensional molecular excitation and radiative transfer Monte-Carlo code developed by Hogerheijde & van der Tak (2000).
4.1 A model for L1489 IRS
The velocity structure of L1489 IRS’s envelope is clearly dominated by rotation. Infall alone produces a position-velocity diagram where the emission is distributed symmetrically around the source center and systemic velocity; only self-absorption may introduce a measure of asymmetry around the systemic velocity but not the source center (the well known red/blue asymmetry of infall line profiles, for example). This section investigates to what extent the emission around L1489 IRS can be fit with rotation alone, or if infalling motions are also required.
We start with a simple model for a circumstellar disk. The surface density is given by
| (1) |
where is the density at a characteristic radius of 1000 AU and is a power-law index. We consider a constant density model with , and a model with outward decreasing density, , as invoked in many theoretical disk models and models of the primitive solar nebula (Chiang & Goldreich, 1997; Lynden-Bell & Pringle, 1974; Weidenschilling, 1977, e.g.). is chosen such that the observed dust mass of 0.02 (Paper I) is contained in the model, for an outer radius of 2000 AU and a gas-to-dust mass ratio of 100:1. For , kg m-2; for , kg m-2.
In addition to thin disk models, we also consider flared models, with a scale height which increases linearly with radius, . In reality the value of the scale height will depend on the thermal structure of the disk, an aspect that we neglect here. Instead we use a maximum scale height of 1000 AU, which is the largest value consistent with the observed aspect ratio of 2:1 and a maximum inclination of (i.e., orienting the disk such that it appears as slim as possible). A flat disk needs to be viewed under an inclination of to produce the same aspect ratio. Scattered light near-infrared imaging (Padgett et al., 1999) and modeling of the infrared spectral energy distribution (Kenyon et al., 1993) suggest source inclinations in this range of – for L1489 IRS, and we adopt and for the thin and flared disk models, respectively.
The calculations use the H2 volume density rather than a surface density. For the thin disks, the material is distributed over a 10 AU layer, much smaller than the disk’s extent. For the flared models we use
| (2) |
where follows Eq. (1) with or .
The velocity field in the disk follows Keplerian rotation around a central mass, , with the central mass a free parameter, and no vertical motions, . Inward motions are parameterized by , where is a free parameter and (constant velocity) or (appropriate for free-fall). A turbulent line width of 0.2 km s-1 (FWHM) is also included, which is much smaller than the resulting lines and does not affect the results significantly.
The final ingredient of the model is the kinetic temperature. We adopt K which successfully fitted the SCUBA observations (Paper I). Since the excitation of HCO+, the molecule we will focus our attention on, is only modestly dependent on kinetic temperature compared to density, the adopted kinetic temperature is not very critical.
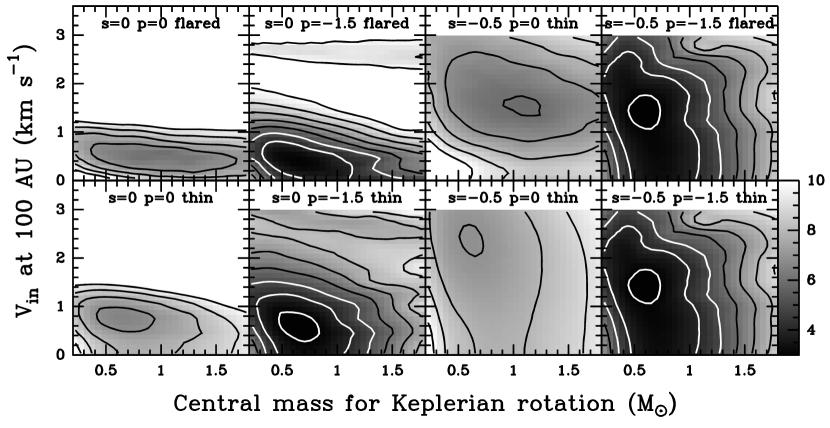
The model presented has two free parameters, and , and three additional parameters: thin or flared; or ; and or . Figure From infall to rotation around young stellar objects: A transitional phase with a 2000 AU radius contracting disk? shows the reduced surfaces of a full parameter study in and for the eight combinations of the three additional parameters. The values are defined as
| (3) |
where the summation is over all pixels along the equator and spectral channels where HCO+ 1–0 emission is detected in the position-velocity diagram. Optically thin non-LTE excitation was adopted, and the emission was scaled to the maximum intensity of the observed image. This approximation decreased the required computing time considerably, without significantly changing the results: the value of the best-fit model changes by less than 40% if radiative trapping is included. This means that radiative coupling and opacity are only important as a second-order effect for the overall match between models and observations since the is dominated by emission in the line wings which are optically thin.
The best fits, as judged from the minimum values in the surfaces, are obtained for models with a power-law distribution in surface density (), without a clear preference for thin or flared disks. The allowed range in is significantly larger for models with an free-fall-type velocity field () than for constant-velocity models. This is a direct result from the power-law behavior of the former, which sets up a large range of infall velocities over the extent of the envelope, decreasing the sensitivity to the exact value of at a particular radius. Still, static models with km s-1 can be excluded regardless of the value of because the minimum values always lie above the axis. Typical minimum values are 3 for the models with and 6–7 for . These low values indicate that the HCO+ observations of L1489 IRS are well described by a 2000 AU radius disk, in Keplerian rotation with infalling motions, and with a power-law density distribution. The mass of the central object is ; and infall speeds are km s-1 for . Such models also reproduce the continuum emission distribution as observed by SCUBA. The separation of the velocity field in a Keplerian component and a radial component can also be thought of as sub-Keplerian motions around an object exceeding 0.65 with material slowly spiraling inward. If the inward motions correspond to free-fall, a central mass of 0.75 M⊙ is found. The object’s bolometric luminosity of 3.7 L⊙ places an upper limit of 1.4 M⊙ on its mass, if the object is assumed to be on the zero-age main-sequence and all luminosity is stellar (Cox, 1999).
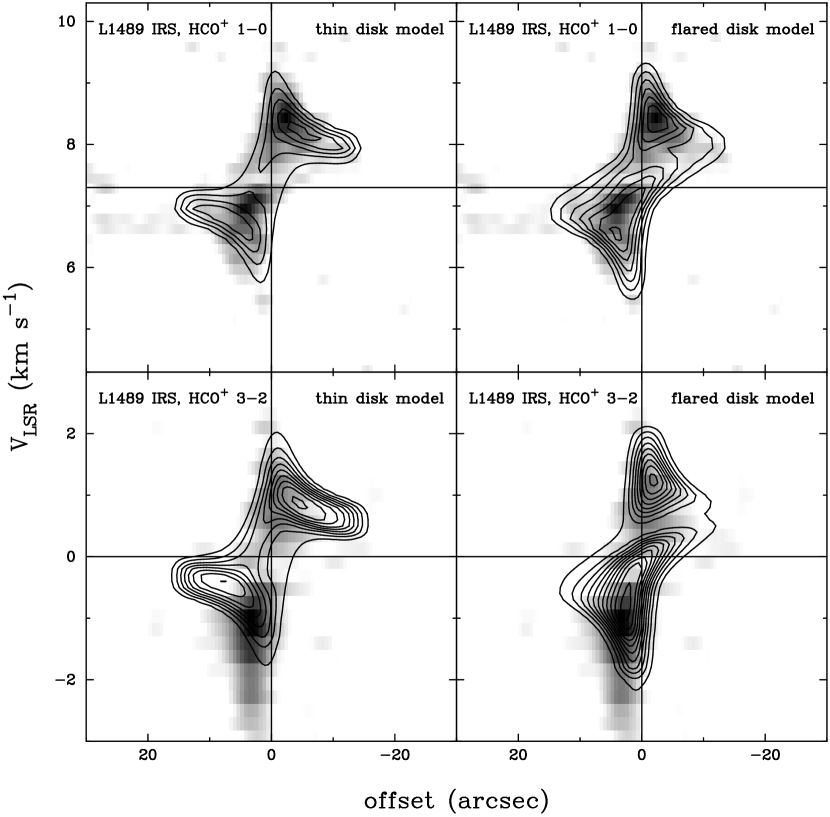
From observed H13CO+ single-dish lines (Hogerheijde et al., 1997), an average HCO+ abundance is found of with respect to H2. Figure From infall to rotation around young stellar objects: A transitional phase with a 2000 AU radius contracting disk? shows the resulting position-velocity diagrams for thin and flared disk models, now including full non-LTE excitation and self-consistent two-dimensional radiative transfer, and using . From the match of the emission peaks, this figure suggests that a flared model is a slightly better fit than the thin disk model. The method described above did not distinguish between the two, since it represented a goodness of fit over the entire emission region, yielding for both. Including line trapping increases the values of the flared model to 3.9 and of the flat model to 4.0. The flared model also better fits the HCO+ 3–2 position-velocity diagram; these data were not included in the solution. The predicted single-dish HCO+ 1–0, 3–2, and 4–3 lines, as well as the HCO+ 3–2 spectrum in the interferometer beam lend further support to the flared model (Fig. From infall to rotation around young stellar objects: A transitional phase with a 2000 AU radius contracting disk?), especially the observed intensities, widths, and profile shapes of the 3–2 and 4–3 lines. Only this model has lower excitation (lower density) material in front of, and absorbing against, higher excitation gas, because of both its exponential vertical distribution and its edge-on orientation. The same effect is reflected in curvature of the line separating red-shifted and blue-shifted HCO+ 1–0 and 3–2 emission around L1489 IRS in Fig. From infall to rotation around young stellar objects: A transitional phase with a 2000 AU radius contracting disk?. This line profile asymmetry also shows that the material is moving inward and not flowing outward.
The profiles of the HCO+ 1–0, and to a lesser extent, 3–2 lines reveal discrepancies near the systemic velocity between the observations and model, however. The single-dish data show additional emission here, while the intensities are overestimated in the interferometer beams. A likely explanation is offered by foreground material associated with the overall cloud or the adjacent core L1489 NE-SMM. Under fairly typical excitation conditions such material can add significant flux in the lower HCO+ lines, and provide sufficient opacity to suppress the lines when it is resolved-out by the interferometer beam. Adopting, somewhat arbitrarily, a density of cm-3, and kinetic temperature of K, a line width of km s-1, and a HCO+ column of cm-2 for this putative foreground material, the observed spectra are much better reproduced (see Fig. From infall to rotation around young stellar objects: A transitional phase with a 2000 AU radius contracting disk?). Additional emission is still required to match the IRAM 30m data, but this may reflect material inside this but not directly in front of L1489 IRS. Hogerheijde (1998) and Girart et al. (2000) note that self-absorption in HCO+ 1–0 can be severe toward the embedded YSOs L1527 IRS and NGC 2264G. We suggest that such self-absorption in HCO+ 1–0 is a general characteristic of many embedded objects.
To summarize, L1489 IRS is a 0.65 object embedded in a rotating and infalling (or sub-Keplerian) disk, with a mass of 0.02 , a radius of 2000 AU, at an inclination of –, and likely flared. Absorption and emission in HCO+ 1–0 by unrelated foreground material is significant over a limited velocity range. This is a common feature of HCO+ 1–0 observations of embedded objects, and higher-excitation transitions of HCO+ are significantly less affected.
4.2 A model for TMC 1
The velocity structure in the envelope around TMC 1 has been described previously (Hogerheijde et al., 1998; Brown & Chandler, 1999) as Keplerian rotation. This interpretation requires absorption by unrelated foreground material to obscure the red-shifted emission. As the previous section illustrated, such absorption is not unlikely. However, Paper I showed that the density distribution and the velocity structure as probed through single-dish HCO+ line profiles is well described by the inside-out collapse model of Shu (1977). Can these two description be reconciled?
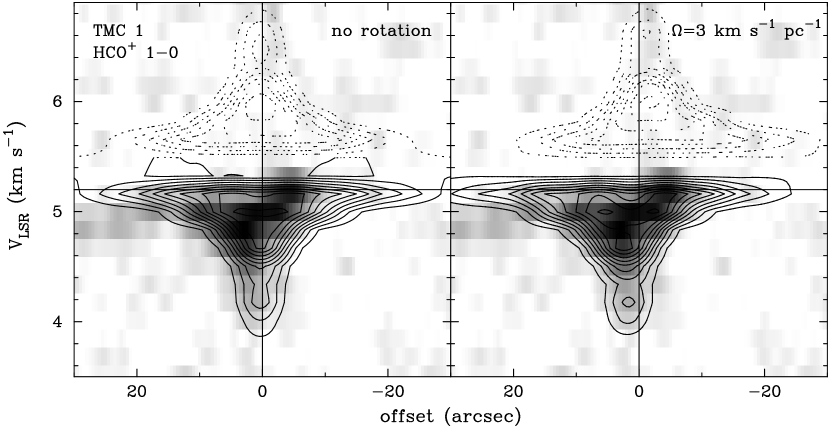
Figure From infall to rotation around young stellar objects: A transitional phase with a 2000 AU radius contracting disk? compares the observed HCO+ position-velocity diagram with two model predictions using the collapse model of Terebey, Shu, & Cassen (1984). This model describes the self-similar, inside-out collapse of a cloud core with a small amount of rotation, treating it as a perturbation to the solution of Shu (1977). Since the sound-speed and age of the model are already constrained by the SCUBA observations of Paper I ( km s-1; yr; ), as is the HCO+ abundance of and the temperature distribution of K, the only free parameter is the rotation rate . The figure shows results for (no rotation) and km s-1 pc-1. The model does not include foreground absorption, but the contours are dashed in the affected velocity range by way of illustration.
The model results show that a collapse solution without rotation already provides a reasonable fit to the data, and that km s-1 pc-1 is an especially close match. The resulting azimuthal component is typical of those found toward embedded YSO, e.g., L1527 IRS (Saito et al., 1996) and L1551 IRS 5 (Ohashi et al., 1997). Rotating models also produce flattened cores with the same elongation and offset from the source center in integrated HCO+ emission when taking foreground absorption into account as observed (Fig. From infall to rotation around young stellar objects: A transitional phase with a 2000 AU radius contracting disk?). A more formal , however, only weakly prefers km s-1 pc-1 over the non-rotating model. A likely reason is that the model of Terebey, Shu, & Cassen (1984) includes a perturbative treatment of rotation. Material for which rotation dominates the velocity field is not contained in the model; instead, all material within this rotation-radius is assumed to collapse onto a circumstellar disk. Emission from this disk component is not included in the model calculations for lack of a continuous description throughout disk and envelope. This means that the included rotational velocities do not depend very sensitively on once is of the order of a few hundred AU, i.e., a significant fraction of the envelope.
Model calculations for 13CO and C18O for km s-1 pc-1 also agree with the observed position-velocity diagrams, using a CO depletion factor of 10–30 in material with temperatures below 20 K, consistent with the findings of Paper I. For HCN, an upper limit to the abundance of follows from the lack of clear emission associated with the envelope. We conclude that TMC 1 is embedded in an infalling envelope with some rotation: km s-1 pc-1, or equivalently, AU. Within this radius , material is expected to be in a circumstellar disk. The presence of rotation in the infalling envelope is small enough that it does not significantly affect the appearance of the line profiles in single-dish beams.
4.3 Infall, rotation, and the evolution of young stellar objects
The results from the previous two sections indicate that infall and rotation are present at different relative amounts in the envelopes around L1489 IRS and TMC 1. Figure From infall to rotation around young stellar objects: A transitional phase with a 2000 AU radius contracting disk? shows that infall dominates the velocity field around TMC 1, while rotation dominates around L1489 IRS. This, together with the smaller amount of circumstellar material around L1489 IRS compared to TMC 1 (0.02 vs. 0.59 , respectively), suggests that L1489 IRS is more evolved than TMC 1. The small amount of rotation ( km s-1 pc-1) in TMC 1’s infalling envelope has produced a distinguishable flattening and rotational velocity component on scales AU, as probed by interferometric observations, but not by single-dish spectra. At the source’s age of yr (for km s-1; Paper I), this amount of initial rotation has caused material inside AU to accrete onto a rotationally supported disk. TMC 1’s youth and its larger reservoir of circumstellar material may be reflected in its more prominent outflow compared to L1489 IRS. According to the adopted model (Terebey, Shu, & Cassen, 1984), the mass infall rate in the envelope is M⊙ yr-1. With a stellar mass of M⊙ and a stellar radius of R⊙, this gives an accretion luminosity of L⊙, much larger than the measured bolometric luminosity of 0.7 L⊙. Many embedded YSOs suffer from this ‘luminosity problem’ (Kenyon et al., 1990), which is generally resolved by assuming that most of the material accretes at larger radii onto a disk instead of directly onto the star.
In this scenario, L1489 IRS is more evolved, and its disk has grown to a radius of 2000 AU. In the model of Terebey, Shu, & Cassen (1984), increases proportional to , and it takes another 75% of the source’s age (another – yr; absolute time scales depend on the sound speed) for to grow from TMC 1’s value of 360 AU to 2000 AU. Over the same time span, the densities outside 2000 AU will have dropped below cm-3 and the original envelope is essentially depleted. These densities are now too low to detect in, e.g., HCO+ 1–0 emission, although they might contribute to the absorption noted earlier. With the inferred inward motions, and assuming that the disk will not acquire more material because of the absence of extended emission in, e.g., the SCUBA observations of Paper I, in yr it will have contracted to a radius of 500 AU typical of disks around T Tauri stars, much shorter than the duration of the embedded phase of a few times yr. This time scale is found by inverting the observed velocity field , and integrating the resulting expression for from 2000 to 500 AU. Estimating the mass accretion rate by dividing the disk’s mass by its life time yields M⊙ yr-1 and L⊙. This is comparable within a factor of two to the measured bolometric luminosity of 3.7 L⊙, suggesting that the observed inward motions could correspond to accretion directly onto the star itself. However, Muzerolle, Hartmann, & Calvet (1998) infer a much lower accretion luminosity of for L1489 IRS from Br observations. This indicates that most of the luminosity is stellar, and that the inward motions in the 2000 AU disk give rise to accretion on an object much larger than a star such as a circumstellar disk.
Rotation and infall have been found in the envelopes around other embedded YSOs, e.g., L1551 IRS 5 (Saito et al., 1996) and L1527 IRS (Ohashi et al., 1997). The infall motions toward these objects are similar in magnitude as those for L1489 IRS and TMC 1, and rotational velocities are smaller by factors of 3–10 compared to infall. This suggests that they are very similar to TMC 1, that L1489 IRS’s velocity field stands apart, and that L1489 IRS represents a short-lived, transitional stage between fully embedded objects and T Tauri stars with disks, equivalent to the last % of the embedded phase. Given the number of embedded YSOs whose velocity fields have been studied in detail (Hogerheijde & Sandell, 2000; Chandler & Richer, 2000; Shirley et al., 2000, so-far approximately two dozen, e.g.), this is consistent with L1489 IRS currently being the only representative of its kind. Inspection of SCUBA data and HCO+ 3–2 or 4–3 line profiles may turn up more examples. The velocity fields in the disks around T Tauri stars can be fit with Keplerian motion only (Simon, Dutrey, & Guilloteau, 2000), and the inferred accretion rates for T Tauri stars are much lower than that derived for L1489 IRS, of the order of M⊙ yr-1 (Calvet, Hartmann, & Strom, 2000, e.g.).
Understanding the formation of a disk from a collapsing envelope requires a continuous theoretical description that encompasses the transitional stage represented by L1489 IRS. Processes governing the transport and dissipation of angular momentum will be important ingredients of such theories. Theoretical descriptions are often limited to times before or well after the formation of a rotating disk. Some numerical simulations (Yorke & Bodenheimer, 1999; Nakamura, 2000, e.g.) present results relevant to objects like L1489 IRS. Yorke & Bodenheimer find rotationally supported structures of a few thousand AU radius as a natural outcome of the collapse of a slowly rotating cloud core, but note that the details of angular momentum transfer are critical.
There is no a priori reason to adopt an evolutionary interpretation and to assume that TMC 1 will evolve to something resembling L1489 IRS. However, non-evolutionary interpretations of the differences between L1489 IRS’s velocity structure and that of embedded objects like TMC 1, L1527 IRS, and L1551 IRS, require some explanation for its large rotational component. For example, L1489 IRS may have originated from a core with an unusually large rotation rate. Or mechanisms involved in carrying away excess angular momentum like the stellar wind or the bipolar outflow may be frustrated. However, the velocity gradient for the L1489 cloud on scales was measured at no more than 0.6 km s-1 pc-1 (Goodman et al., 1993), somewhat lower than the typical value for dense cores of 1 km s-1 pc-1. Also, near-infrared imaging with NICMOS only revealed a single central source (Padgett et al., 1999), ruling out that a binary companion with a separation AU has thwarted the growth of an accretion disk close in around the star and thus shut down the likely driving mechanism of the outflow and the star’s mechanism for angular-momentum release (Königl & Pudritz, 2000; Shu et al., 2000, e.g.). Since an evolutionary scenario does not require that L1489 IRS is in some ‘special’, we conclude that it is a more appealing option. Identification of other objects surrounded by thousand of AU scale disks is required to settle this issue.
5 Conclusion
This paper presents interferometric molecular-line observations of two embedded YSOs, L1489 IRS and TMC 1, and analyses the density and velocity structure of their envelopes in terms of infall and rotation. Our main conclusions are:
-
1.
L1489 IRS is surrounded by a 0.02 , 2000 AU radius, flared disk, which is in Keplerian rotation around a central object of 0.65 and which shows infalling motions. An equivalent statement is that the disk shows sub-Keplerian motions around a but M⊙ star. These will reduce the size of the disk to the 500–800 AU typical of T Tauri stars in yr.
-
2.
TMC 1 is embedded in a collapsing envelope of 0.58 and 12,000 AU in radius, which was originally rotating at a rate of km s-1 pc-1, using the model of Terebey, Shu, & Cassen (1984). In another yr, the region dominated by rotation, now limited to 360 AU, will have increased to 2000 AU.
-
3.
We propose an evolutionary scenario, where TMC 1 represents the earlier stage of the collapse of a cloud core with a small amount of rotation. L1489 IRS is in a transitional stage, where the size of the region dominated by rotation is at its maximum. Subsequently, the disk is expected to decrease in size, because the influx of fresh material adding angular momentum to the system has ended, and the stellar wind or other mechanisms continue to carry away angular momentum. Equivalently, L1489 IRS’s envelope can be described as a sub-Keplerian, flattened structure slowly contracting to its rotationally supported (Keplerian) size. A continuous description which connects these stages continuously is clearly warranted.
-
4.
Chemically, the observations indicate depletions by factors 10–30 for 13CO and C18O by freezing out onto dust grains in TMC 1’s envelope, and abundances for HCO+ of in the disk around L1489 IRS and in the envelope around TMC 1. In L1489 IRS’s disk, HCN has an abundance of , where temperatures may be high enough to evaporate part of the ice mantles. An upper limit of is found in TMC 1’s envelope, and the HCN abundance appears significantly enhanced in the northern outflow lobe. Differences in HCO+ and HCN emission between the northern and southern outflow lobes indicate that subtle changes in shock conditions bring about large differences in evaporation rates.
References
- Basu & Mouschovias (1994) Basu, S. & Mouschovias, T. C. 1994, ApJ, 432, 720
- Beckwith & Sargent (1996) Beckwith, S. V. W. & Sargent, A. I. 1996, Nature, 383, 139
- Beckwith et al. (1990) Beckwith, S. V. W., Sargent, A. I., Chini, R. S., & Güsten, R. 1990, AJ, 99, 924
- Bergin & Langer (1997) Bergin, E. A. & Langer, W. D. 1997, ApJ, 486, 316
- Briggs (1995) Briggs, D. 1995, BAAS, 187, 112.02
- Brown & Chandler (1999) Brown, D. W. & Chandler, C. J. 1999, MNRAS, 303, 855
- Calvet, Hartmann, & Strom (2000) Calvet, N., Hartmann, L., & Strom, S. E. 2000, in Protostars and Planets IV, ed. V. Mannings, A. P. Boss, & S. S. Russell (Tucson: The University of Arizona Press), 377
- Chandler & Richer (2000) Chandler, C. & Richer, J. S. 2000, ApJ, 530, 851
- Chan, Myers, & Ladd (1995) Chen, H., Myers, P. C., Ladd, E. F., & Wood, D. O. S. 1995, ApJ, 445, 377
- Chiang & Goldreich (1997) Chiang, E. I. & Goldreich, P. 1997, ApJ, 490, 368
- Cox (1999) Cox, A. N. (ed.) 1999, Allen’s Astrophysical Quantities (4th ed.; New York: Springer Verlag & AIP Press), 395
- Galli & Shu (1993) Galli, D. & Shu, F. H. 1993, ApJ, 417, 220
- Girart et al. (2000) Girart, J. M., Estalella, R., Ho, P. T. P., & Rudolph, A. L. 2000, ApJ, 539, 763
- Goodman et al. (1993) Goodman, A. A., Benson, P. J., Fuller, G. A., & Myers, P. C. 1993, ApJ, 406, 528
- Hartmann, Calvet, & Boss (1996) Hartmann, L., Calvet, N., & Boss, A. 1996, ApJ, 464, 387
- Hogerheijde (1998) Hogerheijde, M. R. 1998, Ph.D. thesis, Leiden University
- Hogerheijde & Sandell (2000) Hogerheijde, M. R. & Sandell, G. 2000, ApJ, 534, 880
- Hogerheijde & van der Tak (2000) Hogerheijde, M. R. & van der Tak, F. F. S. 2000, A&A, 362, 697
- Hogerheijde et al. (1997) Hogerheijde, M. R., van Dishoeck, E. F., Blake, G. A., & van Langevelde, H. J. 1997, ApJ, 489, 293
- Hogerheijde et al. (1998) Hogerheijde, M. R., van Dishoeck, E. F., Blake, G. A., & van Langevelde, H. J. 1998, ApJ, 502, 315
- Kenyon et al. (1990) Kenyon, S. J., Hartmann, L. W., Strom, K. M., & Strom, S. E. 1990, AJ, 99, 869
- Kenyon et al. (1993) Kenyon, S. J., Whitney, B. A., Gomez, M., & Hartmann, L. 1993, ApJ, 414, 773
- Königl & Pudritz (2000) Königl, A. & Pudritz, R. E. 2000, in Protostars and Planets IV, ed. V. Mannings, A. P. Boss, & S. S. Russell (Tucson: The University of Arizona Press), 759
- Lahuis & van Dishoeck (2000) Lahuis, F. & van Dishoeck, E. F. 2000, A&A, 355, 699
- Li & Shu (1997) Li, Z.-Y. & Shu, F. H. 1997, ApJ, 475, 237
- Lizano & Shu (1989) Lizano, S. & Shu, F. H. 1989, ApJ, 342, 834
- Lucas, Blundell, & Roche (2000) Lucas, P. W., Blundell, K. M., & Roche, P. F. 2000, MNRAS, 318, 526
- Lynden-Bell & Pringle (1974) Lynden-Bell, D. & Pringle, J. 1974, MNRAS, 168, 603
- Muzerolle, Hartmann, & Calvet (1998) Muzerolle, J., Hartmann, L., & Calvet, N. 1998, AJ, 116, 2965
- Nakamura (2000) Nakamura, F. 2000, ApJ, 543, 291
- Ohashi et al. (1997) Ohashi, N., Hayashi, M., Ho, P. T. P., & Momose, M. 1997, ApJ, 475, 211
- Ossenkopf & Henning (1994) Ossenkopf, V. & Henning, T. 1994, A&A, 291, 943
- Padgett et al. (1999) Padgett, D. L., Brandner, W., Stapelfeldt, K. R., Strom, S. E., Terebey, S., & Koerner, D. 1999, AJ, 117, 1490
- Pollack et al. (1994) Pollack, J. B., Hollenbach, D., Beckwith, S. V. W., Simonelli, D. P., Roush, T., & Fong, W. 1994, ApJ, 421, 615
- Rodríguez et al. (1989) Rodríguez, L. F., Myers, P. C., Cruz-González, I., & Terebey, S. 1989, ApJ, 347, 461
- Saito et al. (1996) Saito, M., Kawabe, R., Kitamura, Y., & Sunada, K. 1996, ApJ, 473, 464
- Sault, Teuben, & Wright (1995) Sault, R. J., Teuben, P. J., & Wright, M. C. H. 1995, in ASP Conf. Ser. 77: Astronomical Data Analysis Software and Systems IV, ed. R. A. Shaw, H. E. Payne, & J. J. E. Hayes (San Francisco: Astronomical Society of the Pacific), 433
- Scoville et al. (1993) Scoville, N. Z., Carlstrom, J. E., Chandler, C. J., Phillips, J. A., Scott, S. L., Tilanus, R. P. J., & Wang, Z. 1993, PASP, 105, 1482
- Shirley et al. (2000) Shirley, Y. L., Evans, N. J., Rawlings, J. M. C., & Gregersen, E. M. 2000, ApJS, 131, 249
- Shu (1977) Shu, F. H. 1977, ApJ, 214, 488
- Shu et al. (2000) Shu, F. H., Najita, J. R., Shang, H., & Li, Z. . 2000, in Protostars and Planets IV, ed. V. Mannings, A. P. Boss, & S. S. Russell (Tucson: The University of Arizona Press), 789
- Simon, Dutrey, & Guilloteau (2000) Simon, M., Dutrey, A., & Guilloteau, S. 2000, ApJ, 545, 1034
- Terebey, Shu, & Cassen (1984) Terebey, S., Shu, F. H., & Cassen, P. 1984, ApJ, 286, 529
- Weidenschilling (1977) Weidenschilling, S. J. 1977, Ap&SS, 51, 153
- Welch et al. (1996) Welch, W. J., et al. 1996, PASP, 108, 93
- Yorke & Bodenheimer (1999) Yorke, H. W. & Bodenheimer, P. 1999, ApJ, 525, 330
Continuum emission at and 2.7 mm from L1489 IRS and TMC 1. Left: Cleaned images. The synthesized beams are plotted in the lower left corners of each panel. Contours are drawn at 3, 6, 9, ; , 0.9, 1.3, and 0.8 mJy beam-1 from top to bottom. Right: Vector-averaged amplitudes as a function of -distance. The points show the amplitudes in 10 k wide bins, with 1 error bars. The histograms indicate the expected value if no signal were present in the data.
Cleaned, integrated HCO+ 1–0 emission of L1489 IRS. Left: The image obtained using natural weighting. Right: Same, for uniform weighting. In both panels contours are drawn using a square-root stretch to bring out the extended emission with a factor of increase per level. Levels start at 0.048 Jy beam-1 km s-1 for the naturally weighted image and at 0.070 Jy beam-1 km s-1 for the uniformly weighted data.
Integrated emission (contours) superposed on the velocity centroid with respect to the sources’ systemic velocity (color) of HCO+ 1–0 and 3–2 , HCN 1–0, 13CO 1–0, and C18O 1–0 toward L1489 IRS (top) and TMC 1 (bottom). The HCN image includes the main hyperfine component only. Contours are drawn using a square-root stretch to bring out the extended emission with a factor of increase per level, and start at 0.07, 3.1, 0.10, 0.08, and 0.06 Jy beam-1 km s-1 for HCO+ 1–0, HCO+ 3–2, HCN 1–0, 13CO 1–0, and C18O 1–0, for L1489 IRS respectively. For TMC 1, they start at 0.04, 0.07, 0.05, and 0.05 Jy beam-1 km s-1 for HCO+, HCN, 13CO, and C18O, respectively. The text describes the adopted weighting schemes. The synthesized beams are plotted in the lower left corner of each panel.
Image obtained from a three-point mosaic of L1489 IRS in HCO+ and HCN 1–0, covering the adjacent core L1489 NE-SMM (Paper I). The location and extent of this core are indicated with the cross and the heavy dashed line. The HCN image includes the main hyperfine component only. Contours and grey-scale show integrated emission, with the contours drawn at 0.5, 1.0, 2.0, 4.0, Jy beam-1 km s-1 for HCO+ and 0.3, 0.6, 1.2, 2.4, Jy beam-1 km s-1 for HCN. The thin dashed line outlines the mosaicked region.
Image obtained from a three-point mosaic of TMC 1 in HCO+ and HCN 1–0, covering the outflow. The HCN image includes the main hyperfine component only. Contours and grey-scale show integrated emission, with the contours drawn at 0.13, 0.26, 0.52, 1.0, Jy beam-1 km s-1 for HCO+ and HCN. The thin dashed line outlines the mosaicked region.
Position-velocity diagrams obtained along the equatorial plane of L1489 IRS (left) and TMC 1 (right) in the observed lines. Contours are drawn at linear intervals, starting at 0.28 (HCO+), 0.35 (HCN), 0.20 (13CO), and 0.20 Jy beam-1 (C18O) for L1489 IRS, and 0.15 (HCO+), 0.25 (HCN), 0.20 (13CO), and 0.20 Jy beam-1 (C18O) for TMC 1. The angular and velocity resolution is depicted by the filled symbol in the lower left corner of each panel. The vertical and horizontal lines indicate the sources’ positions and systemic velocities.
Surfaces of reduced between the observed HCO+ 1–0 position-velocity diagram of L1489 IRS and the model results. The free parameters of the model are the central mass and the infall speed ; the additional parameters of the model (thin or flared geometry; radial power-law index of the velocity field; and radial power-law index of the surface density) are indicated in each panel. Contours are drawn at intervals of 1. The minimum values are 6.1, 3.0, 5.9, and 2.8 (top panels, from left to right); 6.6, 2.8, 7.0, and 2.8 (bottom panels, from left to right). The greyscale is the same for each panel and is indicated at the lower right.
HCO+ 1–0 and 3–2 position-velocity diagrams along the equator of the two best-fit models (contours; thin and flared geometries) superposed on the observed position-velocity diagram of L1489 IRS (grey-scale). Contour levels are the same as for Fig. From infall to rotation around young stellar objects: A transitional phase with a 2000 AU radius contracting disk?. The first contour levels and the increase between the levels are 0.28 Jy beam-1 and 3.1 Jy beam-1 for 1–0 and 3–2, respectively.
Observed HCO+ spectra (histograms) of L1489 IRS in the interferometer beams (1–0 and 3–2), the IRAM 30m beam (1–0), and and the JCMT beams (3–2 and 4–3). The line profiles produced by the thin (dashed curve) and flared (solid curve) disk models are superposed. The excess HCO+ 1–0 emission around a of 7 kms s-1 likely originates in unassociated material along the line of sight. A possible fit to this foreground material obscuring the flared-disk model is shown in the heavy solid curves, adopting cm-3, K, km s-1, and a HCO+ column of cm-2.
Position-velocity diagram of HCO+ 1–0 observed toward TMC 1 (grey-scale) over-plotted with model predictions based on the inside-out collapse model of Paper I. Left: no rotation; right: slow rotation, km s-1 pc-1. The model results are sampled at the same positions as the data are deconvolved in a similar way, and hence accurately account for the resolving out of larger scale emission. Model emission in the range of 5.4–7.0 km s-1 is plotted with dashed lines to reflect the obscuration by unrelated foreground material.
Comparison of the radial (‘infall’) and azimuthal (‘rotation’) components of the velocity fields around L1489 IRS and TMC 1.
| Date | Instrument | |
|---|---|---|
| 1993/10; 1994/2–4 | OVRO, L+E | HCO+ 1–0, 3.4 mm continuumaaPreviously presented in Hogerheijde et al. (1997, 1998). |
| 1998/10,11; 1999/2–4 | BIMA, B+C | HCO+ 1–0, HCN 1–0, 3.4 mm continuum |
| 1995/2–5; 1996/10,11; 1997/2 | OVRO, L+E | 13CO, C18O 1–0, 2.7 mm continuumaaPreviously presented in Hogerheijde et al. (1997, 1998). |
| 1999/11,12; 2000/1–2 | OVRO, L+H | 13CO, C18O 1–0, 2.7 mm continuum |
| 2000/12 | BIMA, C | HCO+ 3–2, 1.1 mm continuum |
| (2000.0)aaBest-fit continuum position, adopted as source position. | (2000.0)aaBest-fit continuum position, adopted as source position. | Flux | Beam Size | ||
|---|---|---|---|---|---|
| Source | (h m s) | (∘ ′ ′′) | (mm) | (mJy) | (arcsec) |
| L1489 IRS | 04:04:42.96 | +26:18:57.1 | 3.4 | ||
| 2.7 | |||||
| 1.1 | |||||
| TMC 1 | 04:41:12.69 | +25:46:35.2 | 3.4 | ||
| 2.7 |
| Beam Size | aaMaximum integrated intensity over indicated region. | bbAverage integrated intensity over indicated region. | Region, Size | ||
|---|---|---|---|---|---|
| Source | Line | (arcsec) | (K km s-1) | (K km s-1) | (arcsec) |
| L1489 IRS | HCO+ 1–0ccImage reconstructed using natural weighting. | Central core, | |||
| HCO+ 1–0ddImage reconstructed using weighting with a ‘robustness’ parameter of 0. | Central core, | ||||
| HCO+ 1–0eeImage reconstructed using uniform weighting. | Central core, | ||||
| HCN 1–0 | Central core, | ||||
| 13CO 1–0 | Central core, | ||||
| C18O 1–0 | Central core, | ||||
| HCO+ 3–2 | Central core, | ||||
| TMC 1 | HCO+ 1–0 | Central core, | |||
| Entire field, | |||||
| Southern ridge, | |||||
| HCN 1–0 | Outflow lobe, | ||||
| 13CO 1–0 | Central core, | ||||
| Southern ridge, | |||||
| C18O 1–0 | Central core, |