Multi-Epoch VLBA Observations of EGRET-Detected Quasars and BL Lac Objects: Superluminal Motion of Gamma-Ray Bright Blazars
Abstract
We present the results of a program to monitor the structure of the radio emission in 42 -ray bright blazars (31 quasars and 11 BL Lac objects) with the VLBA at 43, 22, and occasionally 15 and 8.4 GHz, over the period from November 1993 to July 1997. We determine proper motions in 33 sources and find that the apparent superluminal motions in -ray sources are much faster than for the general population of bright compact radio sources. This follows the strong dependence of the -ray flux on the level of relativistic beaming for both external-radiation Compton and synchrotron self-Compton emission. There is a positive correlation (correlation coefficient =0.45) between the flux density of the VLBI core and the -ray flux and a moderate correlation (partial correlation coefficient =0.31) between -ray apparent luminosity and superluminal velocities of jet components, as expected if the -ray emission originates in a very compact region of the relativistic jet and is highly beamed. In 43% of the sources the jet bends by more than 20∘ on parsec scales, which is consistent with amplification by projection effects of modest actual changes in position angle.
In 27 of the sources in the sample there is at least one non-core component that appears to be stationary during our observations. Different characteristics of stationary features close to and farther from the core lead us to suggest two different classes of stationary components: those within about 2 milliarcseconds (mas) of the core, probably associated with standing hydrodynamical compressions, and those farther down the jet, which tend to be associated with bends in the jet.
1 Introduction
Among the most significant accomplishments of the Energetic Gamma Ray Experiment Telescope (EGRET) aboard the Compton Gamma Ray Observatory was the detection of nearly 70 blazars at photon energies of 0.1–3 GeV (Hartman et al. 1999; Mattox et al. 1997a). (Blazars here are defined as quasars and BL Lac objects containing compact, variable radio sources with flat cm-wave spectra.) One of the primary characteristics of blazars is strong radio emission on scales less than 1 mas, usually in the form of a jet that is observed with very long baseline interferometry (VLBI) on scales down to mas. It is commonly thought that the -ray emission occurs in the jet, but closer to the “central engine” than the radio emission (based on timescales of variability; see, e.g., Dermer & Schlickeiser 1994). An important question, therefore, is whether there is a relation between the radio and -ray emission. For example, one might expect that a temporary increase in the velocity and/or energy flux of the plasma injected into the jet might first cause an outburst of rays, followed by the appearance of a knot propagating down the jet at a superluminal apparent speed. It could be possible, on the other hand, that any such perturbation is damped by radiative losses or dissipation before it reaches the radio-emitting portion of the jet.
A number of studies attempting to relate the -ray flux and emission at other bands have established a significant correlation between -ray flux and radio flux, and an even better correlation between -ray flux and radio flux contained in the compact jet (e.g., Dondi & Ghesellini 1995; Valtaoja & Teräsranta 1996; Mattox et al. 1997a; Zhou et al. 1997). Therefore, one might expect the VLBI properties of -ray blazars to be distinct from those of other subclasses of flat radio-spectrum, non--ray AGNs, especially in the innermost sub-milliarcsecond region of the jet close to the central engine, where the -ray emission most likely originates.
In an effort to establish whether correlations indeed exist between the properties of the compact radio jets and the -ray emission, we have undertaken an extensive study of changes in the structure of the compact radio jets of EGRET-detected blazars with the Very Long Baseline Array (VLBA)111The VLBA is an instrument of the National Radio Astronomy Observatory, a facility of the National Science Foundation operated under cooperative agreement by Associated Universities, Inc.. This multi-epoch survey was carried out mostly at the highest frequencies available with the VLBA (22 and 43 GHz) in order to obtain the highest possible resolution. This allows us to probe the jets at sites as close as possible to the central engine by imaging the radio emission on scales ranging from 0.1–0.3 to mas. Our sample contains 42 sources, roughly 60% of the known -ray blazars (Hartman et al. 1999) and covers 14 epochs over 3.5 years between November 1993 and July 1997 (with each source observed only at some of these epochs). Our sample size was increased as more blazars were reported to have been detected by EGRET (von Montigny et al. 1995a; Mukherjee et al. 1997; Hartman et al. 1999). Known -ray blazars were excluded from our sample based on declinations that are too far south for the VLBA, positions not known with sufficient accuracy for high-frequency VLBI, and a few cases of inadvertent omission.
EGRET-detected active galactic nuclei represent % of known blazars. Since the -ray emission is known to be variable in many of these sources (Hartman et al. 1999), as many as % of all blazars would be expected to be bright -ray sources (i.e., detectable by EGRET) some of the time (cf. Mattox et al. 1997a). However, not all blazars are -ray bright. The high -ray flux and short timescale of variability, combined with the requirement that the pair-production optical depth be less than unity, suggest that the -ray emission must be relativistically beamed (Mattox et al. 1993; Wehrle et al. 1998). If the rays arise from inverse Compton scattering of either synchrotron photons from the jet or photons external to the jet, the EGRET-detected objects should be those with the highest Doppler beaming factors. This implies high Lorentz factors of the jet flows and small angles between the jet axes and the lines of sight (Lister & Marscher 1999). These are the conditions required for superluminal apparent speeds. Lister & Marscher therefore predicted that the distribution of apparent velocities of bright features in the jets of -ray blazars should peak at high values. By contrast, the motions observed in a radio flux-limited sample of compact, flat-spectrum radio sources are heavily weighted toward low apparent velocities (Pearson et al. 1998).
This paper is a compendium of our multi-epoch VLBA observations of the sample of 42 -ray blazars. Our emphasis is on the presentation of the images and model fits from this study, along with some analysis of the results. Separate papers will present single-epoch polarization observations of most of the sample (Marscher et al. 2001) and comparison of epochs of component ejection with times of high -ray flux (Jorstad et al. 2001).
In what follows, we calculate the apparent transverse velocity, , from standard Friedmann cosmology with deceleration parameter qo=0.1, cosmological constant =0, and Hubble constant =100h km s-1 Mpc-1. [Over the redshift range of the blazars in our sample, the result differs by no more than 10% from that obtained for a value of such that and .] The formula (e.g., Pearson & Zensus 1987) used is:
2 Sample Selection
The first session of VLBA observations, carried out at 8.4 and 22 GHz on 1993 November 8, included two of the brightest blazars, 3C 279 and 3C 273, known previously as superluminal radio sources at lower frequencies and identified as variable -ray sources (Thompson et al. 1993, Fichtel et al. 1993). Starting in 1994 the sample contained 21 objects from the list of -ray sources detected during the first EGRET cycle of observation and identified with AGNs (Michelson et al. 1993) and the 2 Jy sample of compact extragalactic radio sources suitable for millimeter VLBI observations (Valtaoja et al. 1992). In 1995 the sample was expanded to 38 sources and increased further to 43 objects in 1996. The selection criteria were: (1) detection by EGRET (E100 MeV; note that the flux limit of EGRET varied greatly with position on the sky depending on the exposure time and the distance of the object from the center of the field); (2) flux density at 37 GHz 1 Jy (allowing for variability); and (3) declination (J2000) 30∘. The quasar 0954+556 was detected by the VLBA at 8.4 GHz (single epoch) but not at 22 GHz; in addition, the source did not show structure smaller than 1 mas (Marscher et al. 2001). We therefore do not consider it to be a true blazar (it appears similar to compact symmetric objects) and do not include it in our analysis.
Table 1 presents the entire sample of 42 -ray blazars, which we observed at 22 and 43 GHz with the VLBA. (Note: only a fraction of the sources were observed at both frequencies.) The contents of the table are as follows: (1) IAU source designation; (2) common name; (3) source type (Q - quasar, B - BL Lac object); (4) redshift , taken from the NED database; (5) maximum -ray flux (E100 MeV) in units of 10-8 phot cm-2 s-1, from the third EGRET catalog (Hartman et al 1999); (6) -ray spectral index [flux density ] at E100 MeV, also from the third EGRET catalog; (7) maximum observed radio flux density at 37 GHz, from the radio light curves obtained at the Metsähovi Radio Observatory from 1991 to 1997 (Teräsranta, private communication); (8) radio spectral index at 22–37 GHz, calculated at times of maximum flux in the Metsähovi light curves at 22 and 37 GHz from 1991 to 1997.
3 Observations and Data Analysis
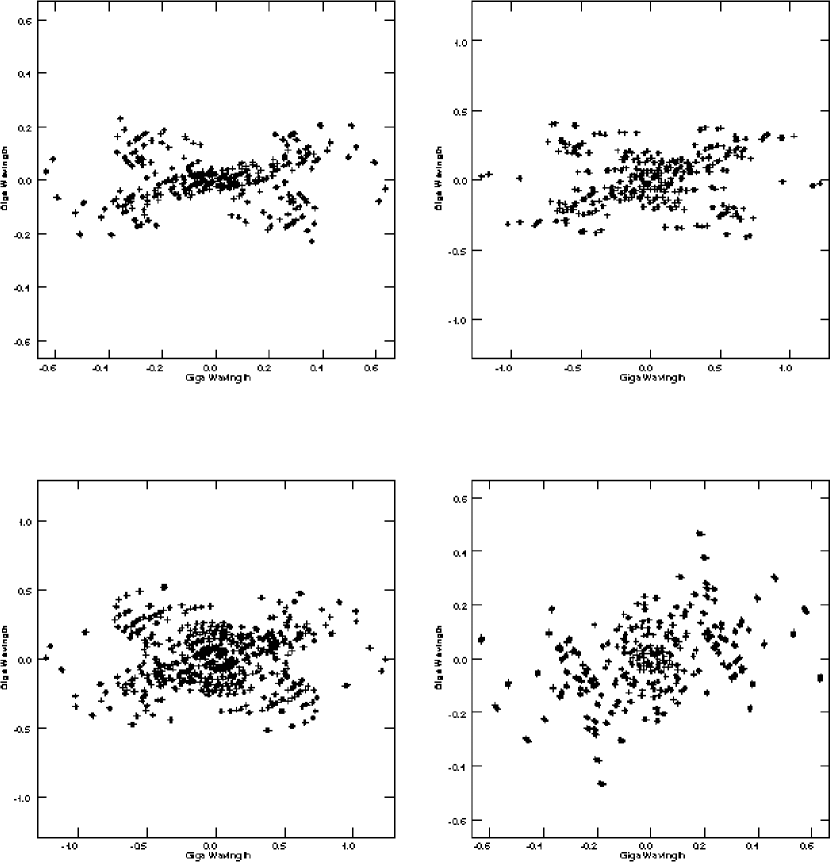
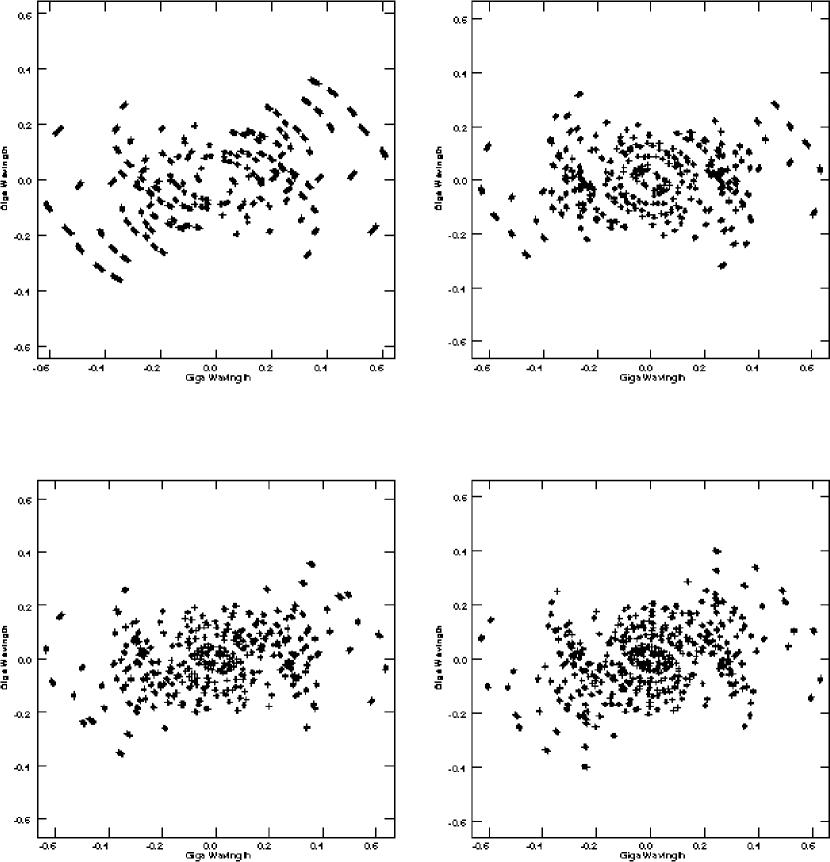
We monitored the milliarcsecond scale structure of the 42 blazars with the VLBA at frequencies of 22, 43, and, at some epochs, 8.4 and 15.4 GHz during the period from 8 November 1993 to 31 July 1997 (14 epochs); only a subset of the sample was observed at each epoch and at each frequency. Prior to 1995, the partially-completed VLBA consisted of 5 to 7 operating antennas. The early observations (November 1993 to the end of 1994) used the Mk 2 VLBI recording system, which utilized four 2-MHz wide channels (IFs). Starting in January 1995 the observations were carried out with the full VLBA using four (1995–1996) or eight (1997) 8 MHz wide channels in both right and left circular polarization. Each source was observed in “snapshot” mode with 3–6 scans of 5–15 minute duration. Not all antennas were available at all epochs owing to equipment failures or very poor weather. Fig. 1 shows the typical uv coverage for four sources with different declinations at one of the epochs, while Fig. 2 shows the uv-coverage for one object at four different epochs.
3.1 VLBA Data Analysis
Initial correlation was carried out at the California Institute of Technology (for all data prior to 1995) and the National Radio Astronomy Observatory (NRAO) Array Operations Center in Socorro, NM. The subsequent calibration was performed at Boston University with the Astronomical Image Processing System (AIPS) software supplied by NRAO, while imaging was performed at Boston University and St. Petersburg State University using the Caltech software Difmap (Shepherd et al. 1994).
The calibration included the following steps: (1) initial editing; (2) nominal amplitude calibration using the system temperatures and gain curves supplied by NRAO; (3) opacity corrections using total flux densities from Metsähovi Radio Observatory at 22 and 37 GHz and the University of Michigan Radio Astronomy Observatory at 8 and 14.5 GHz; (4) an initial fringe fit on a scan of a bright source to apply a first-order correction to the residual instrumental delay (frequency dependence of the phase); and (5) a global fringe fit to all the data at that epoch to determine and correct for the residual instrumental delays and rates (time dependence of the phase, which is also affected by the Earth’s atmosphere and ionosphere), with subsequent smoothing of the solutions. The data were then split into single-source files while averaging over frequency, and imported into Difmap, which was used to perform the final editing and imaging.
Initial images were made in Difmap using the CLEAN algorithm (Högbom 1974) and self-calibration of the visibility phases and amplitudes in an iterative procedure. These images were then transferred to AIPS and used to self-calibrate the phases of the pre-Difmap data files. (The phases of each polarization were therefore self-calibrated separately, which is not possible in Difmap; this step was unnecessary for the pre-1995 single-polarization observations.) The use of the initial image rather than a point-source model in the first phase self-calibration guards against the self-calibration routine in AIPS (CALIB) setting noisy phases to an average value of zero. This effect was further avoided by deleting data before self-calibration when the phases appeared to be random (which implies nondetection of fringes).
After this procedure, the data were once again transferred to Difmap for final imaging and self-calibration through an iterative procedure that results in the production of a “hybrid map” (Cornwell & Wilkinson 1981). Uniform weighting of the uv data was usually used to obtain the highest resolution, although Gaussian tapering (downweighting of the longer-baseline uv data) was employed during some of the iterations in order to image better more extended emission. Since the nominal amplitude calibration was inaccurate at a level of tens of percent, we applied a posteriori corrections to the intensities by requiring that the total flux densities on images of nearly unresolved sources match the single-dish values. Table 2 gives the values of the intensity correction coefficients at 22 and 43 GHz.
The dynamic range (ratio of peak intensity to noise level) of the final images depended on the uv coverage as well as on the quality of the data, which can be affected by weather and problems with the receivers. In no case was the theoretical thermal noise level reached.
3.2 Model fitting
Model fitting of the emission structure of each image was performed with Difmap using the self-calibrated data files. We used the task ‘modelfit’ to create a model source using components with circular Gaussian brightness distributions. The procedure started by initially fitting the flux density of the core (the bright, compact component at one end of the structure in most sources, at most slightly resolved and usually the brightest feature on the image) while setting the FWHM to 0.01 mas. Additional components were introduced one at a time at the position of the next brightest feature on the residual image. The program then iteratively adjusted the flux density and position of only the newly added component until the value of the statistic was minimized. The iterations were ended when the remaining features on the residual image were at the noise level. A final set of 100 iterations was executed with all parameters of all components allowed to vary. For some sources with diffuse jet emission we fit a singular extended circular Gaussian component to a feature whose structure on the hybrid map was complex. In this case, we tapered the data (see above) before introducing this component and fit its parameters while holding constant those of the other components. The final iterations were always performed with no tapering and with the parameters of the diffuse components held fixed. For a number of sources the final values of characterizing the goodness of fit of the model to the uv data are less than unity. The majority of models have reduced values in the range from 1 to 1.5. The models derived by the above procedure are listed in Table 4.
We used the model-fitting program SLIME, which runs in the AIPS environment, to determine the errors in the parameters of the components from the Difmap models. This program gives 1 errors for the parameter values under the assumption that the errors have a Gaussian distribution and that the parameters are independent of each other (Flatters 1996). To estimate the errors, a fully calibrated uv data file and corresponding model were imported into AIPS and loaded into SLIME. The command ‘FIT DATA’ with the ‘LEAST-SQUARES TOOL’ option was employed with a maximum of 100 iterations to determine the uncertainties. Usually we could not get a good result for the parameters of those components of a Difmap-generated model that were insufficiently constrained by the data owing to their faintness. (In some cases, the component can be removed without resulting in an unacceptably high value of the reduced .) For this reason, for some components in Table 4 uncertainties in the parameters are not listed. However, our experience based on repeatability of faint features on the hybrid maps from different epochs suggests that a reasonable estimate of the uncertainties is on the order 1520% of the parameter values.
3.3 Presentation Of Results
The hybrid-map images of all sources at all epochs are presented in Figures 3–38 in the form of time sequences of images. The parameters of the images are indicated in Table 3. The 100% contour level corresponds to the maximum brightness on the images across all epochs. The hybrid-map model, which is a grid of -functions, is convolved with a beam corresponding to the average CLEAN beam over all epochs. In general, deviations from the avarage do not exceed 12% for the major and minor axes and 20% for the position angle of the beam; however, in cases in which the position angle of the beam at a single epoch was significantly different from the average, then its value was not included in the averaging. Images of the same source at different frequencies are presented separately with the exception of the sources 0716714 and 0827243, for which images at 22 and 43 GHz are presented together to illustrate better the proper motions that we derive. The contents of the columns of Table 3 are as follows: (1) IAU source designation; (2) frequency of observation in GHz; (3) number epochs of observation at the given frequency; (4) epoch of maximum intensity of the map peak; (5) intensity of the map peak at this epoch in Jy beam-1; (6–8) major axis, minor axis, and position angle of the average CLEAN beam in mas; (9) lowest contour level on the image; contours are in factors of 2 up to 64% of the peak intensity, plus a contour at the 90% level; (10) rms intensity of the highest-intensity residuals of the hybrid map (i.e., the noise peak) in mJy beam-1; (11) figure number of the images.
Table 3 contains 36 sources of the 42 blazars in our sample. The images and parameters of model fitting for the remaining 6 sources are presented in separate papers: 0202149 (Pyatunina et al. 2000), 0336019 (CTA 26) (Mattox et al. 2001), 0440003 (NRAO 190) (Yurchenko, Marchenko-Jorstad, & Marscher 2000), 1101384 (Mkn 421) and 1652398 (Mkn 501) (Marscher 1999), and 2200420 (BL Lac) (Denn, Mutel, & Marscher 2000). However, for completeness, Tables 5, 6, 7, and 8 (see below) contain the proper motions, parameters of stationary knots, and jet geometry for the entire sample.
The parameters of the components found in our model fitting procedure are given in Table 4, with the same designations as the features marked in Figures 3–38. The columns of Table 4 correspond to: (1) IAU source designation; (2) epoch of observation; (3) frequency of observation in GHz; (4) designation of component; for all sources the core is designated by the letter “A”; (5) flux density of the component in Jy; (6) distance of the component from the core in mas; (7) position angle of the component relative to the core in degrees, measured from north through east; (8) size of the component in mas.
It is often difficult to identify components across epochs with confidence. We base our identifications on the minimization of changes in the observed parameters of a given feature: flux density, position angle, and position. (The last of these is perhaps less important, since motions away from the core are expected.) Nevertheless, the identifications are not always unique and the reader can form his or her own opinion concerning their reliability. The components are designated with letters and numbers: “A” corresponds to the core in all cases; “B” followed by a number designates a moving jet component at the main observed frequency, with higher numbers correspond to later epochs of ejection or lower distance from the core if the component was present on the earliest image; “C” designates a stationary component, with lower numbers corresponding to closer distances from the core; other letters (D, E, F, G) refer to special cases, such as multiple frequencies or components that appear at one (non-initial) epoch at a considerable distance from the core.
Comparison of images and model fits of each source at different epochs allows us to classify components as either moving or stationary features over our period of observation. The results of the classification are summarized in Tables 5 and 6. In addition, for each source in which we detect proper motions, we present a plot giving the positions of the components as a function of time relative to the presumed stationary core. (Hereafter we refer to these as “PT” figures: position vs. time). Some weak, difficult to follow, components are not plotted on the PT figures in order to prevent the graphs from appearing too messy. Table 5 lists the proper motions derived from the results of the model fitting (Table 4). In all cases these are least-squares linear fits and are shown as solid lines in the PT figures. Linear back extrapolation gives the time of zero separation of each component from the core.
For some entries in Table 5, a sum of components is indicated (for example, ); this means that there are observations at two different frequencies (see Table 3), with the same (according to our interpretation) component given a different label at each frequency. In such cases the model-fitting results at both frequencies are used to determine its proper motion.
Table 6 lists the parameters of stationary features in the jets of many of the sources. The mean distance and position angle with respect to the core, and , are arithmetic averages over all epochs. Positions of stationary knots are given by dashed lines in the PT figures.
For some sources with multiband observations the spectral indices of the core (“A”), stationary (“S”) and moving (“M”) components are listed in Table 7, under the assumptions that the flux density S and that the positions are approximately independent of frequency.
The geometric parameters of the jets, based on the hybrid maps and model fitting, are summarized in Table 8. Here, is the mean position angle of the jet within 1 mas of the core, is the maximum local bend observed, and is the distance from the core at which the maximum bend occurs. Contours below the 1% level are not considered in the determination of the bending so that sources with different image dynamic ranges can be compared. The quantity is the ratio of the flux density summed over all jet components (as indicated by the model fitting) to that of the core, calculated at the epoch of minimum core flux density at the highest observed frequency. To facilitate comparison of sources at different redshifts, and therefore observed at different rest frequencies, the flux densities of the jet components are K-corrected under the assumption that the jet spectrum is a power law with spectral index =0.7. No K-correction was applied to the cores, since their spectra tend to be flat.
4 Notes On Individual Sources
In order to relate the findings of our high-frequency VLBA observations to the observed properties of the blazars in our sample, we summarize here some relevant characteristics of each source as found by previous studies. This review of the literature is by no means exhaustive, rather it is meant to provide a guide for placing our results for each object into a broader context.
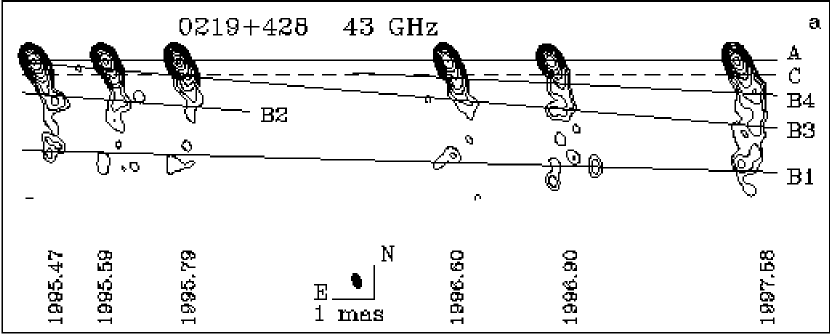
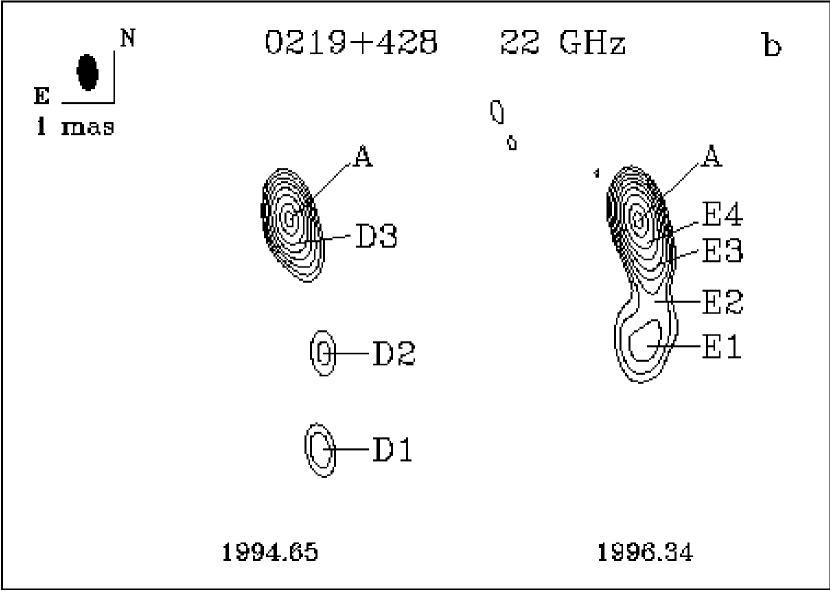
0219428 (3C 66A): This BL Lac object has been observed extensively at optical wavelengths. Analysis of the optical light curve suggests a periodicity of 65 days in the bright state (Lainela et al. 1999), and microvariability was detected by Xie et al. (1994). Price et al. (1993) have presented VLBI maps at 6 and 20 cm, which show an extended jet out to , with gradual bending from PA150∘ to 180∘.
Our 43 and 22 GHz images (Fig. 3) reveal a jet of complex structure out to 3 mas to the south of the core, with a gradual change of PA from 150∘ to 180∘. We model the jet with multiple knots, identification of which across epochs might not be unique. We favor the interpretation shown in Fig. 3 (c) that gives a high superluminal speed (up to 19) of four components (, , , and ). This is the first detection of superluminal motion in this object. A proper motion of 0.68 mas yr-1 is tentantively found for component , but not indicated in Table 5. The moving components appear to pass through a stationary feature (component / at 43/22 GHz) and appear to be blended with the stationary feature at epochs 1996.34, 1996.60, and 1997.58. The model fits indicate that a new component, , appeared in 1997.58. If we speculate that this component has a proper motion similar to the average value of the four previously ejected components (0.80.2 mas yr-1), the ejection of components would appear to have a quasi-period of about 0.60.2 yr.
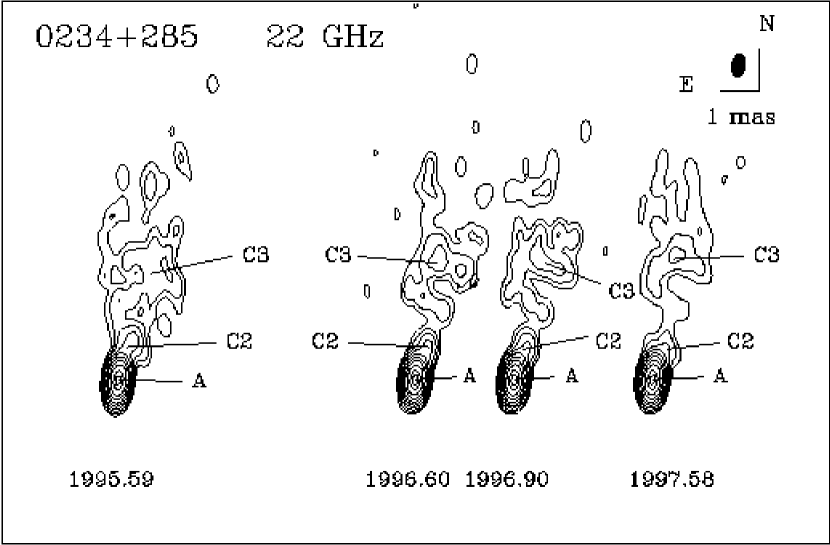
0234285 (CTD 20): This quasar displays a prominent jet extending to the north out to 3.5 mas from the core on our 22 GHz images (Fig. 4). We model the jet with three main components, all stationary during the two years of monitoring. The model parameters of component were obtained from a tapered image (see above); however, the component has complex structure both along the jet and in the transverse direction. The morphology is similar to that seen in the March 1997 15 GHz image of Kellermann et al. (1998) and the extent of the mas-scale jet is no longer than that found by Wehrle et al. (1992) at 5 GHz. Components 2 and 3 in the July 1994 8.55 GHz image of Fey et al. (1996) have similar parameters to components and , respectively. The model fitting indicates the presence of an unresolved component, , near the core (at 0.3 mas) at all epochs, the reality of which needs to be verified by higher frequency observations. Although no motion is detected in the 22 GHz images during our observations, superluminal motion with a speed as high as 12 has been reported by Vermeulen & Cohen (1994).
0235164: This BL Lac object exhibits violent variations at optical and radio frequencies (e.g., Chu et al. 1996). Antonucchi & Ulvestad (1985) detected no extended emission above 0.1% of the peak flux density of the core at 20 cm, although a faint symmetric halo has been observed at lower frequencies (0.3–0.4 GHz; Gopal-Krishna 1977; Stannard & McIlwrath 1982). The 5 and 3.6 GHz images of Gabuzda et al. (1992) and Gabuzda & Cawthorne (1996) did not reveal any jet. However, 22 GHz VLBI observations by Jones et al. (1984) showed a component 0.7 mas from the core at PA=. Chu et al. (1996) interpreted differences in position angle of components relative to the core at three epochs (ranging from to ) as evidence for superluminal motion with . Our 43 GHz images (Fig. 5) confirm the presence of weak emission north of the core. The jet is either strongly bent or has a wide opening angle () within about 0.5 mas of the core. We trace the proper motions of two components ( and ) at 4 epochs. These have bent trajectories and superluminal speeds up to 30 . The Lorentz factor would need to be at least 45, which allows Doppler factors of 90 or more in places where the bent jet points directly along the line of sight. This conforms with the expectations of Doppler factors as high as 100 from radio variability (Kraus et al. 1999).
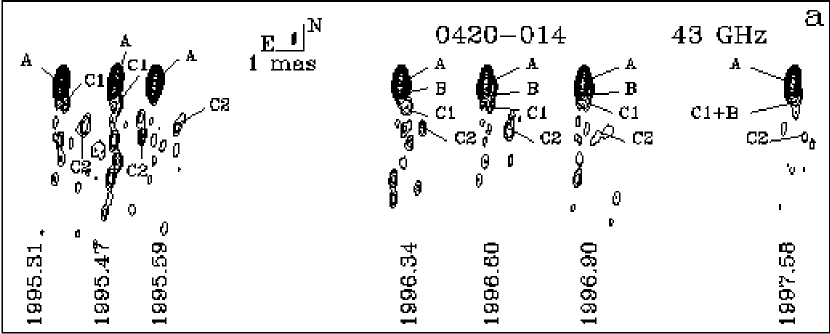
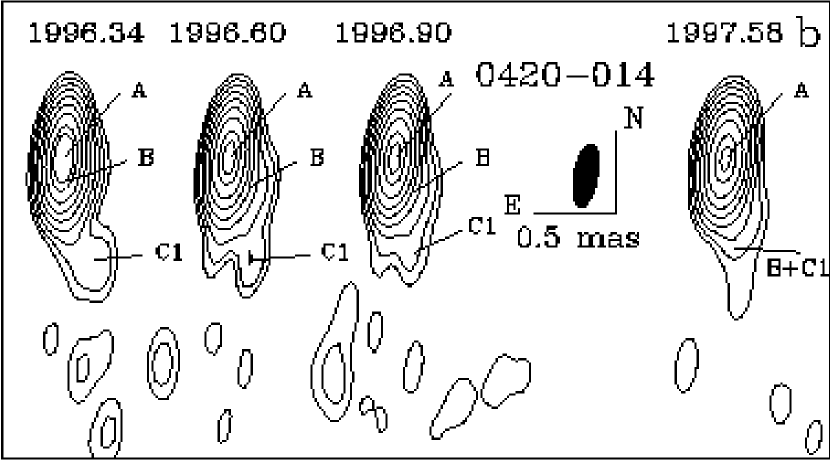
0420014 (OA 129): Wagner et al. (1995) found that this quasar exhibits pronounced flares at optical frequencies. They noted that the optical light curve is consistent with the assumption of repeated outbursts at 13-month intervals and suggested that the flares are caused by knots of enhanced particle density propagating along a helical trajectory in a precessing jet. At kiloparsec scales the source has structure directly to the south out to 25 arcsec and a weak secondary component northeast of the core (Antonucci & Ulvestad, 1985). Britzen et al.(1998) investigated the VLBI structure at 3.6 cm between 1989.32 and 1992.48 and found four jet components that move at apparent superluminal speeds of 7.9, 5.3, 3.9, and 2.1 c, decreasing as a function of distance from the core. Hong et al. (1999) reported two superluminal components with apparent velocities of 1.9 0.6 and 3.4 at 5 GHz.
At 43 GHz the source consists of a broad jet to the south, with a flare to the southwest between 1.5 and 2 mas of the core, similar to the structure found at 15 GHz by Kellermann et al. (1998). A weak feature (component , Fig. 6a) to the southwest appears to be a stationary knot. Another, more prominent stationary component () is closer to the core. During 1996 the model fits reveal motion of component at toward , after which the two merge in 1997.58. Fig. 6b shows the images at the last four epochs on a scale that accentuates the region near the core where component appears.
0446112: We could find no previous published images of this quasar, in which we detect a stationary component () 1.280.02 mas southeast of the core (Fig. 7). At the first epoch of observation the modeling reveals the presence of a component () close to the core. Given the sparse time coverage between epochs of our observations, we cannot identify the component after this.
0454234: The 2.3 and 8.5 GHz images of Fey et al. (1996) show that this quasar has a core-dominated structure with a weak jet out to 5 mas along PA. Our images at 43 GHz (Fig. 8) show an unresolved core, plus a weak component () detected only in May 1996 at a similar PA as at the lower frequencies. The faint structure to the east in 1995.47 is probably an artifact of the noisy data and limited uv coverage.
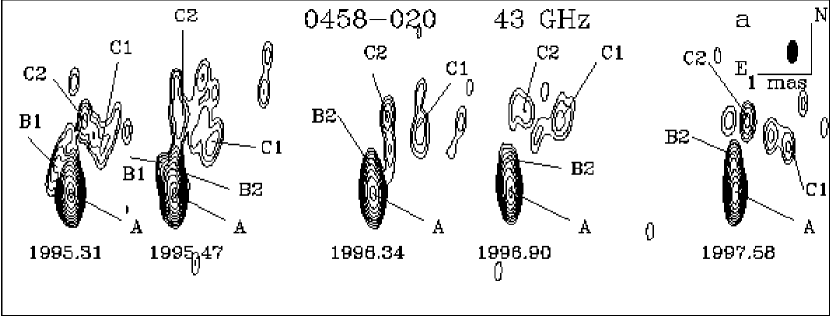
0458020: In the 15 GHz image of Kellermann et al. (1998; see also the 5 GHz image of Wehrle et al. 1992), this quasar shows structure to the northwest starting about 1.5 mas north of the core. Our higher resolution 43 GHz images reveal structure north of the core in the inner 1.5 mas plus a weak jet to the northwest (Fig. 9a). Taken together, the 15 and 43 GHz images indicate that the jet bends strongly, by about 60∘, between about 1 and 2 mas from the core. We derive an apparent speed of for component over four epochs.
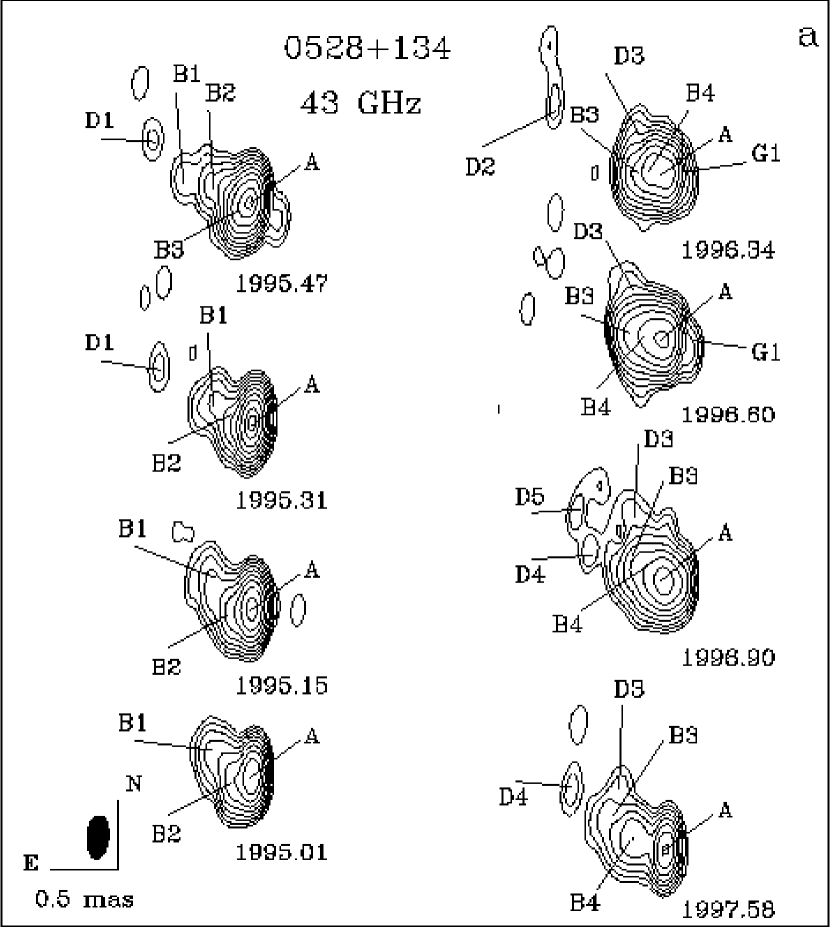
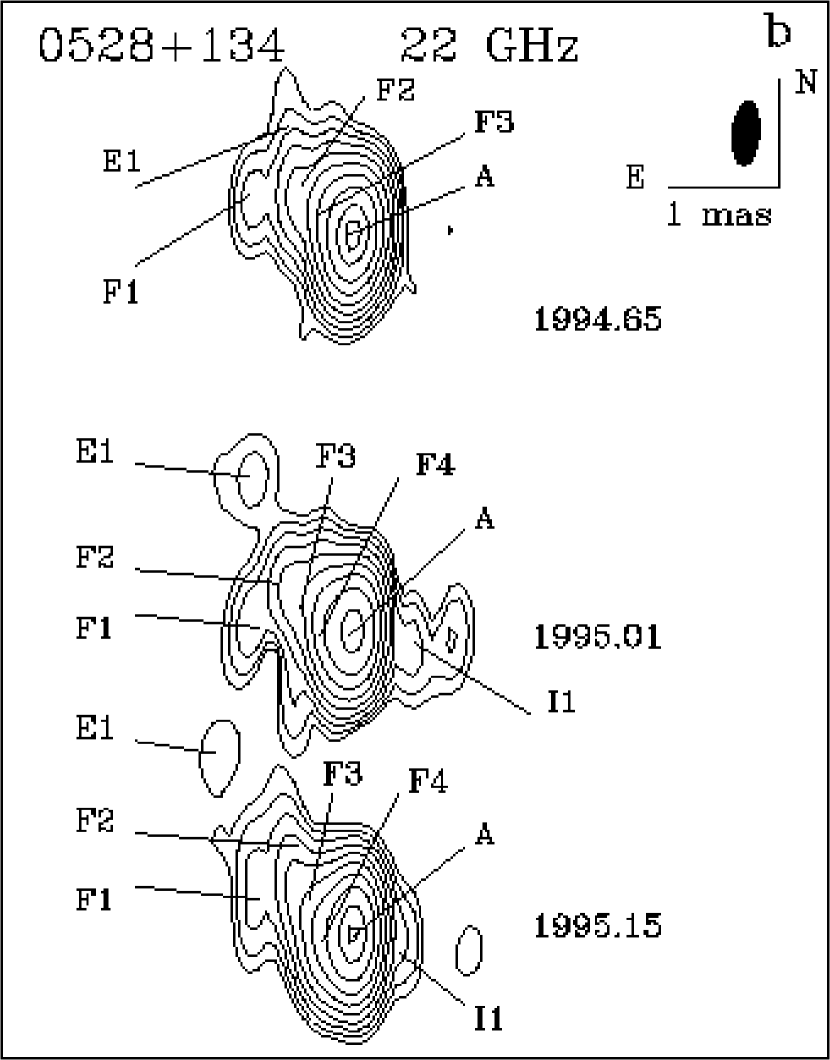
0528134: The broadband spectrum of PKS 0528+134 is dominated by the -ray emission, even when the quasar was at its lowest -ray state observed by EGRET (Mukherjee et al. 1999). The VLBI structure of the source has been extensively studied by Zhang et al. (1994), Pohl et al. (1995), Britzen et al. (1998), and Krichbaum et al. (1998). Pohl et al.(1995) described the source structure at 22 GHz as a one-sided bent jet of 5 mas length and find that the PA of the jet ranges from 60∘ near the core to – beyond 5 mas at 8 GHz. They derived steeper spectral indices at 8–22 GHz for components that were farther from the core. Britzen et al. (1998) measured apparent speeds for four components (5.51.4, 4.70.4, 5.20.4, and 5.2) between 1986.25 and 1994.07 on the basis of geodetic VLBI observations. Krichbaum et al. (1998) noted that new jet components seem to appear at times of local minima in the 90 GHz light curve. Circular polarization in the parsec-scale radio jet of 0528134 was detected at 15 GHz by Homan & Wardle (1999).
We have a thorough set of images at 43 GHz covering a period of 3.6 years. Five moving components with superluminal speeds as high as 23 are detected. Our estimates of apparent speeds are significantly higher than those reported by Britzen et al. (1998) at lower frequencies but similar to that reported by Pohl et al. (1995) at 22 GHz ( up to ). In addition, we find that the proper motions of the components increase with distance from the core. The trajectories of all components show that the jet has a sharp bend of 70∘ within 1 mas of the core. Comparison of the model fits at 22 and 43 GHz at epochs 1995.01 and 1995.15 leads to the identification of components and at 22 GHz with components and at 43 GHz, respectively. The average (over two epochs) values of spectral indices are for the core () and and for components and , respectively. The core spectrum is therefore inverted, as found also by Pohl et al. (1995). It is interesting to note that component has the same spectral index as the similarly located (relative to the core) component on the Pohl et al. (1995) images. However, component , which is closer to the core than , has a spectrum that is significantly steeper. This is even more curious when one considers that the flatter-spectrum component was ejected at about the time of the highest -ray flux detected for this object, in March 1993 (Mukherjee et al 1999), when radiative energy losses of the electrons might be expected to have been most severe.
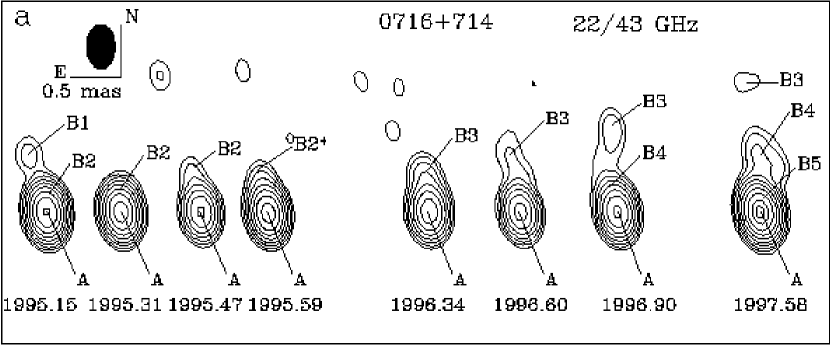
0716714: This BL Lac object is one of the best studied examples of intraday variability. Simultaneous radio, optical, UV, and X-ray monitoring yielded a short duty cycle of variability at all frequencies, plus correlation between the rapid variatons at different frequency regimes (Wagner et al. 1996). The 1.6 GHz map of Polatidis et al. (1995) reveals a jet out to 10 mas from the core at PA . VLBA images at 5 and 8.4/22 GHz show a compact, one-sided core-jet at PA (Gabuzda et al. 1998). These authors also detected high linear polarization 50% in the innermost jet component and estimated the apparent velocity to be (under the assumption that ; Wagner et al. 1996), which is similar to the result obtained by Witzel et al. (1988) at 5 GHz on the basis of 2 epochs (1979.93, 1983.25) with a proper motion of 0.09 mas yr-1.
Our images at 22 and 43 GHz (Fig. 11a) show a weak jet at PA. Although the cross-epoch identification of components is not unique, we obtain consistent results (i.e., identification of all components and small deviations from constant proper motions for each component) if we adopt the interpretation shown in Table 4 and Figure 11b. In this case, we trace components and over 4 epochs and identify component at 22 GHz with component at 43 GHz. The proper motions are then 0.9–1.2 mas yr-1, or c. The lower proper motions derived by earlier authors (see above) could then be explained by inadequate time sampling leading to misidentification of short-lived components across epochs. If we speculate that component , which appeared at the last epoch, has a similar proper motion (1 mas yr-1) as that of components , , and , then the ejection of components appears to occur with a quasi-period of yr (see Fig. 11b).
0804449 (OJ 508): Aller et al. (1999) found that this quasar exhibits variability on the shortest timescale (in the source frame) — about 22 days — of any of the active galaxies which they have monitored at radio frequencies over more than 30 years. A 5 GHz VLBI image by Pearson & Readhead (1988) contains a very weak jet out to 3 mas, with a sharp bend near the core from PA85∘ to PA. The 8.4 and 22 GHz maps of Bloom et al. (1999) show only weak emission east of the core. The 15 GHz image of Kellermann et al. (1998) reveals a broad jet ranging from east to southeast from about 1 to 3 mas from the core. Our 22 GHz images suggest that the structure between about 0.5 and 1 mas from the core corresponds to a twisted jet. We detect no significant change in the structure of the jet over a time span of 1.24 yr (Fig. 12).
0827243: VLA images at 20 and 6 cm (Price et al. 1993) show a bright core and a secondary component from the core with a peak at PA. This component has a jet-like structure to the east-northeast.
Our parsec-scale images at 22 and 43 GHz reveal a weak jet to the southeast out to 4 mas (Fig. 13a). Component seems to have a stationary position relative to the core and appears to be blended at 1995.31 with a brighter component () that was passing through the stationary feature. Two detected moving components (near the core) and (farther out) have similar high apperent speeds. The overall structure can be interpreted as a jet that starts out to the southeast on mas scales and bends on arcsec scales to the west-southwest, terminating in a hotspot.
0829046: This BL Lac object exhibits strong intraday variability of polarization and total flux density at optical and near-IR wavelengths (Sitko et al. 1985, Smith et al. 1987). A VLA image at 20 cm (Antonucci & Ulvestad, 1985) shows a sharply curved jet extending to the south out to . A 43 GHz polarized intensity VLBA image (Lister et al. 1998) displays a well-defined jet extending to the east-northeast, starting at PA62∘ and bending to PA at a distance of 1 mas from the core. High fractional polarization, up to 17%, is detected about 0.6 mas from the core.
Our 22 GHz images show a prominent jet out to 6 mas to the east-northeast (Fig. 14a). Components and , the knots closest to the core, do not appear to move over a one-year period. Components and have similar apparent speeds of about 6, although overall the proper motions increase with distance from the core.
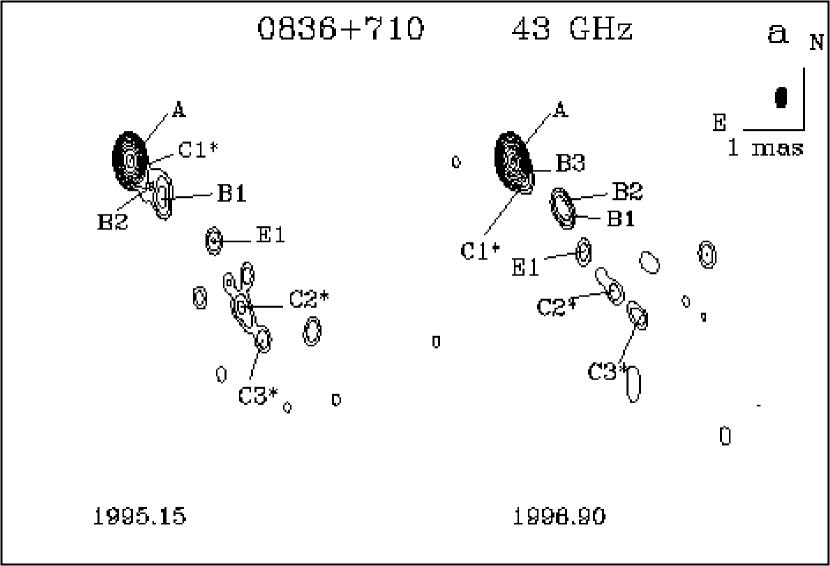
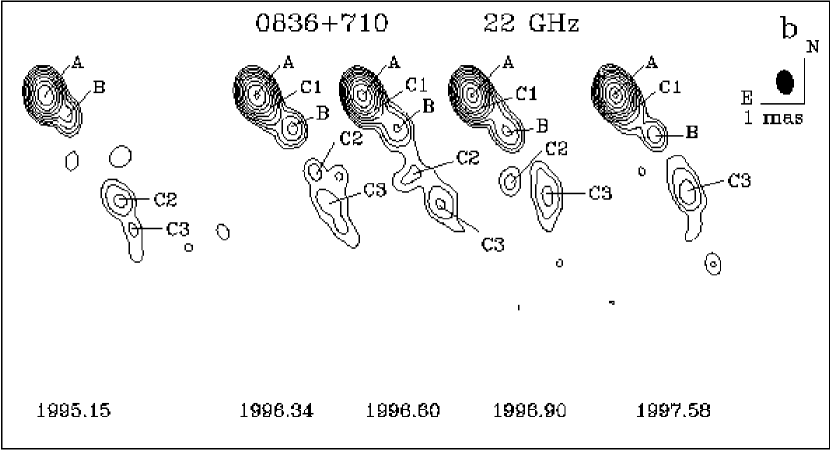
0836710: This high redshift quasar contains prominent extended structure, with a secondary diffuse component located at a distance of mas to the southwest of the core at 1.7 GHz (combined MERLIN and VLBI images presented by Hummel et al. 1992). The line between the core and this component points toward diffuse structure 50 arcsec from the core. On the basis of 5 GHz VLBI images, Krichbaum et al. (1990) found two moving components with significantly different proper motions (0.230.05 and 0.140.05), plus a stationary feature 3 mas from the core that did not show any motion between 1979 and 1983. Otterbein et al. (1998), using multi-frequency VLBI observations from 1993 to 1996, found a moving component with an extrapolated time of ejection close to the epoch of the strong optical flare and -ray detection.
Our 22 GHz images (Fig. 15b) show a curved jet extending to the south-southwest. We follow the evolution of moving component , which consists of two subcomponents ( and ) at 43 GHz (Fig. 15a), over 5 epochs. The proper motion (0.240.02) agrees with that found by Otterbein et al. (1998) at earlier epochs. Components and at 22 GHz are most likely associated with components and at 43 GHz; this appears to be a complex of emission that is stationary relative to the core. It probably corresponds to the stationary feature found by Krichbaum et al. (1990); if so, it has persisted for 17 years. A weak component () near the core also appears to be a stationary feature of the jet. Its double structure in 1996.90 at 43 GHz corresponds to the appearance of new moving component (), which is blended with component at 22 GHz in 1997.58. In this case, its proper motion ( mas yr-1) is similar to the proper motion of component . A comparison of flux densities of the core and components and at 22 and 43 GHz at two epochs reveals that the core has a flat spectrum (), while the spectral indices of the jet components are steep ( for and for ), with a slope that increases with distance from the core.
0851202 (OJ 287): This well-studied BL Lac object is noted for the reported 12-year periodicity in its optical light curve, with global outbursts described by twin-peak structure (Sillanpää et al. 1996). A VLA image at 5 GHz shows a weak jet extending toward the west (Kollgaard et al. 1992). A 3.6 cm polarized intensity VLBI map by Gabuzda & Cawthorne (1996) reveals the presence of a parsec-scale jet out to 3 mas from the core at PA, with a component polarized at 11% located 0.7 mas from the core. Gabuzda et al. (1989) detected apparent superluminal motion ( and mas yr-1). Tateyama et al. (1999) report higher proper motions, ranging from 0.74 to 0.40 mas yr-1 (6 components) on the basis of 8.5 and 2.3 GHz geodetic VLBI observations between October 1990 and December 1996.
Our 43, 22 and 15 GHz images show a jet extending to 1.5 mas west of the core, with a stationary component at 1.2 mas. The model-fit parameters of this stationary component, designated at the different frequencies as (43 GHz), (22 GHz), and (15 GHz), are consistent and give a spectral index of , averaged over two epochs. The core has an inverted spectrum with . The 43 GHz images show a bright component () near the core, which appears to be another stationary knot in the jet. This component can be seen on the 22 GHz images and as a slight extension to the core on the 15 GHz images. Component has an optically thick spectrum, with between 22 and 43 GHz. Three moving components (, , and ) with proper motion from 0.43 to 0.67 mas yr-1 are seen to travel between the two stationary components. The superluminal speeds of the components are similar to those obtained by Tateyama et al. (1999) but considerably higher than those found by Gabuzda et al. (1989); the latter may have resulted from blending of moving and stationary components at the lower resolution of their images.
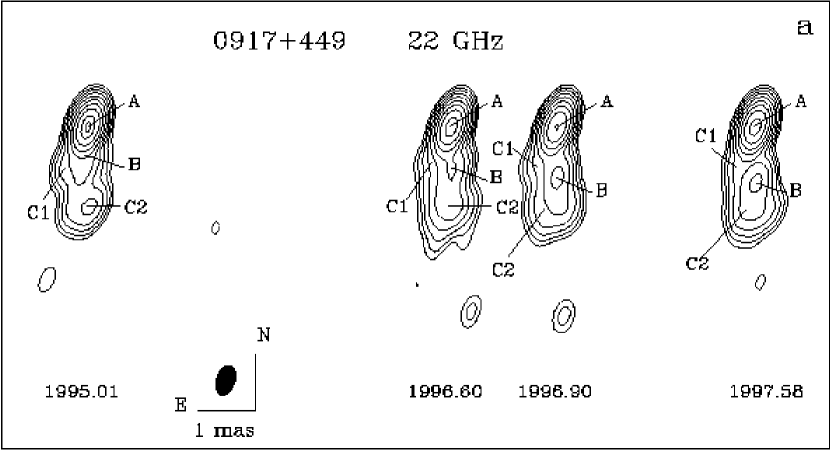
0917449: The image from the first Caltech-Jodrell Bank VLBI survey at 18 cm (Polatidis et al. 1995) shows that this quasar has a prominent bent jet to the southwest at PA near the core and PA at a distance of 40 mas. The 5 GHz map from the same survey (Xu et al. 1995) contains multi-component, curved structure out to 10 mas, with a weak component at 20 mas. The parsec-scale structure of the source is revealed in the 15 GHz image of Kellermann et al. (1998), where the source has a well-defined, straight jet to the south out to 3 mas and very weak structure at 7 mas to the southwest.
At 22 GHz (Fig. 17a) the source has a prominent jet to the south out to 1.5 mas with what appears to be a stationary feature at the end of the jet. Due to the high resolution in the direction transverse to the jet, we can distinguish through model fitting a stationary knot () to the southeast. The superluminal motion of component is directed toward stationary feature .
0954658: The 5 GHz VLA map of Kollgaard et al. (1992) shows a curved jet to the southwest with a bright feature at the end, about 4 mas from the core. The polarized intensity 3.6 cm VLBI image of Gabuzda & Cawthorne (1996) indicates that the jet bends from PA near the core to directly west out to 3 mas. The maximum polarized flux is detected in a knot emerging from the core. They identified two superluminal components with apparent speeds of 7.4 and 4.4.
At 22 GHz (Fig. 18) the jet emerges from the core at PA and appears to execute a sharp bend to the west between 1 and 2 mas. Despite the fact that during three epochs of observation the structure of the jet is modeled by three stationary features (, , and ) relative to the core, it is possible to assume that component seen in the 1995.31 image was blended with the stationary knot in 1995.15, since the model fitting indicates a significantly larger size of component at this epoch. In this case has a superluminal motion that is much higher than that measured by Gabuzda & Cawthorne (1996). However, we do not list component as a moving knot in Table 5 owing to the uncertainty of identification across widely-spaced epochs.
1127145: A VLBI image of this quasar at 5 GHz (Wehrle et al. 1992) shows that the jet emerges from the core at PA and bends at a distance of about 3 mas into the direction of the kiloparsec-scale radio structure at PA (Bondi et al. 1996). The 15 GHz map of Kellermann et al. (1998) reveals a prominent knot at the position of the bend, which appears to be rather sharp. Vermeulen & Cohen (1994) did not find any motion of this knot over two epochs at 5 GHz.
The 22 GHz images (Fig. 19a) show a well-defined jet to the east with a bright stationary feature () at 4 mas from the core where the jet flares to the northeast, in agreement with the image of Kellermann et al. (1998). A weak component () between the core and stationary knot appears to be stationary as well. Knot is observed to move superluminally between stationary knots and . Component , which is closer to the core, has a somewhat slower proper motion. A new bright component () appears to have been ejected shortly before the last epoch of our observations.
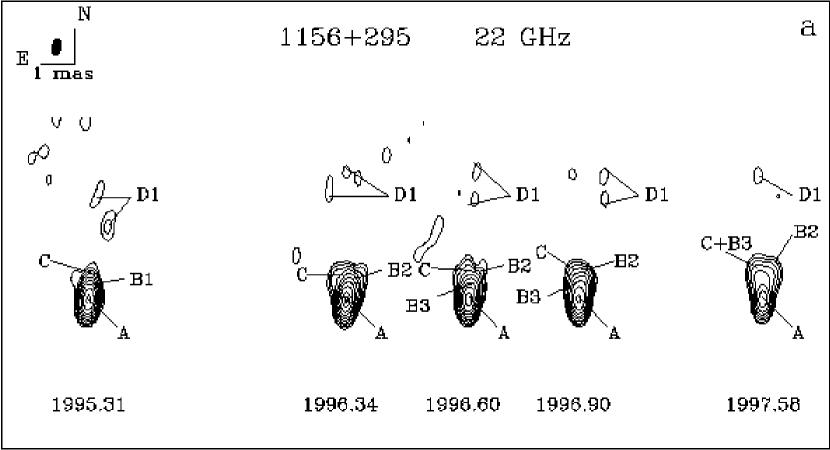
1156295 (4C 29.45): McHardy et al. (1990) presented VLBI maps at 18, 6, 2.8, and 1.35 cm, which show a jet emerging from the core along PA and then bending to the east farther out. On their VLA and Merlin images the jet extends out to along PA , at which point it abrubtly bends by almost to the northeast. McHardy et al. tentatively (based on images at different frequencies) derived the proper motion of the outermost VLBI component to be 1.15 mas yr-1, which translates to . Piner & Kingham (1997b) identified four moving components at 8 and 2 GHz with superluminal speeds of 7.7, 4.4, 8.7, and 13.2 (q∘=0.1).
Our data at 22 GHz (Fig. 20a) reveal that the jet either has a wide opening angle or a changing flow direction, since two moving components ( and ) are observed at different position angles with PA at the same distance from the core. Component seems to be merging with stationary knot at epoch 1997.58, based on the significant increase in brightness of component at that epoch. The results of model fitting give the motion of the component () farthest from the core as , although we do not list it in Table 5 since it is very weak, with size comparable to the change in distance from the core. We detect motion in two other components at superluminal speeds similar to those found by Piner & Kingham (1997b). Piner & Kingham suggested that the jet oscillates in position angle from 0∘ near the core to about 20∘ 1 mas downstream and then back again to at 3 mas. Our data suggest that the trajectories of components can fall anywhere in the range of position angles from to out to a distance of 1 mas from the core.
1219285 (ON 231): The 5 GHz VLA map of this BL Lac object by Kollgaard et al. (1992) shows very faint extended emission to southwest out to 10 arcsec, while the 5 GHz VLBA image of Gabuzda et al. (1994) reveals a complex and heavily resolved jet toward the east at PA. The 15 GHz VLBA image of Kellermann et al. (1998) contains a long, thin jet to the east with a prominent extended knot at the end at a distance of about 10 mas from the core. Based on two epochs of observation, Gabuzda et al. (1994) find a series of superluminal components at 5 GHz, with proper motions of 0.14, 0.18, 0.28, 0.37, and 0.55 mas yr-1 in order of increasing distance from the core.
At 22 GHz (Fig. 21a) the source has a multi-knot jet along PA , which shows a bend toward the south at a distance of mas from the core. A comparison of the nearest epochs (1996.90 and 1997.58) indicates a significant change in the jet, but with such limited data we cannot identify components unambiguously across epochs. Fig. 21b shows two different possible interpretations. One minimizes the proper motions (solid lines in Fig. 21b; these results are given in Table 5); the estimated proper motions are then similar to those obtained by Gabuzda et al.(1994) at 5 GHz and also show an increase of proper motion with distance from the core (0.13, 0.32, 0.60, 0.47, and 0.50 mas yr-1, respectively). However, it is also possible that the proper motions are higher (1.5 mas yr-1, dashed lines in Fig. 21b). In this case, the component identified with B3 (1995.31), B5 (1996.90), and B4 (1997.58) would have an extrapolated time of zero separation from the core at (1995.10.2), close to the epoch of a -ray flare in 1995.334 (Hartmann et al. 1999).
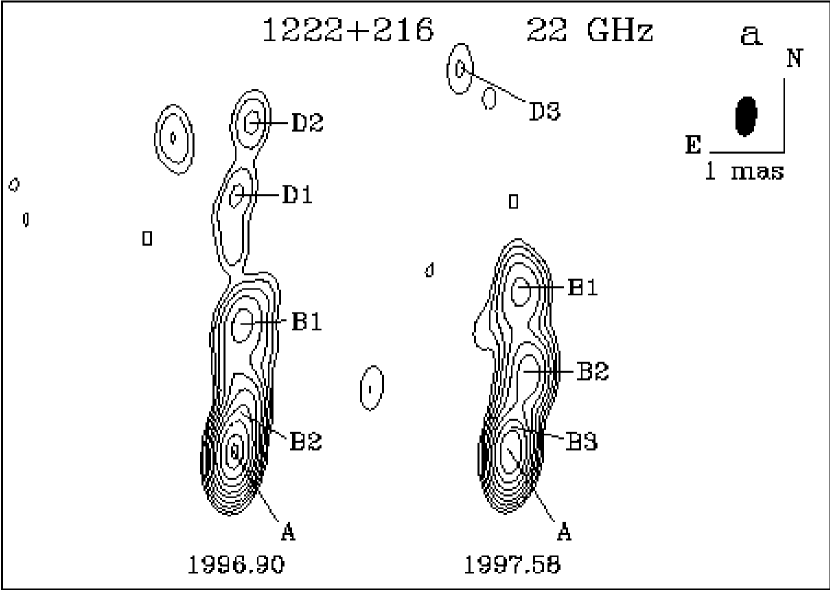
1222216 (4C 21.35): Price et al. (1993) observed this quasar with the VLA at 5 GHz, finding a jet that is bent to the northeast with a secondary extended component at a distance of about from the core. Based on two-epoch (1986.42 and 1988.24) VLBI observations at 5 GHz, Hooimeyer et al. (1992) derive an apparent speed of for a component located at PA.
At 22 GHz (Fig. 22a) the source has a prominent jet toward the north at PA . Although we only observed 1222216 at two epochs, it is clear that two bright knots ( and ) separated from the core at different speeds, which are significantly higher than the velocity reported by Hooimeyer et al. (1992).
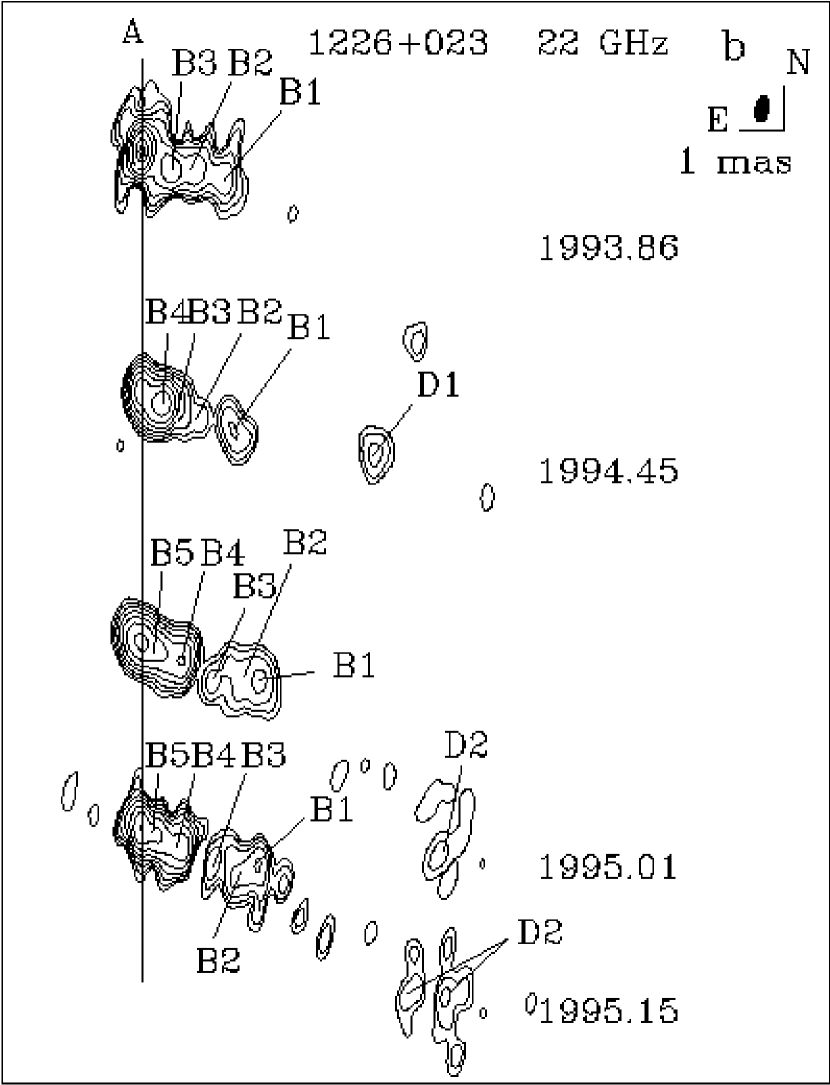
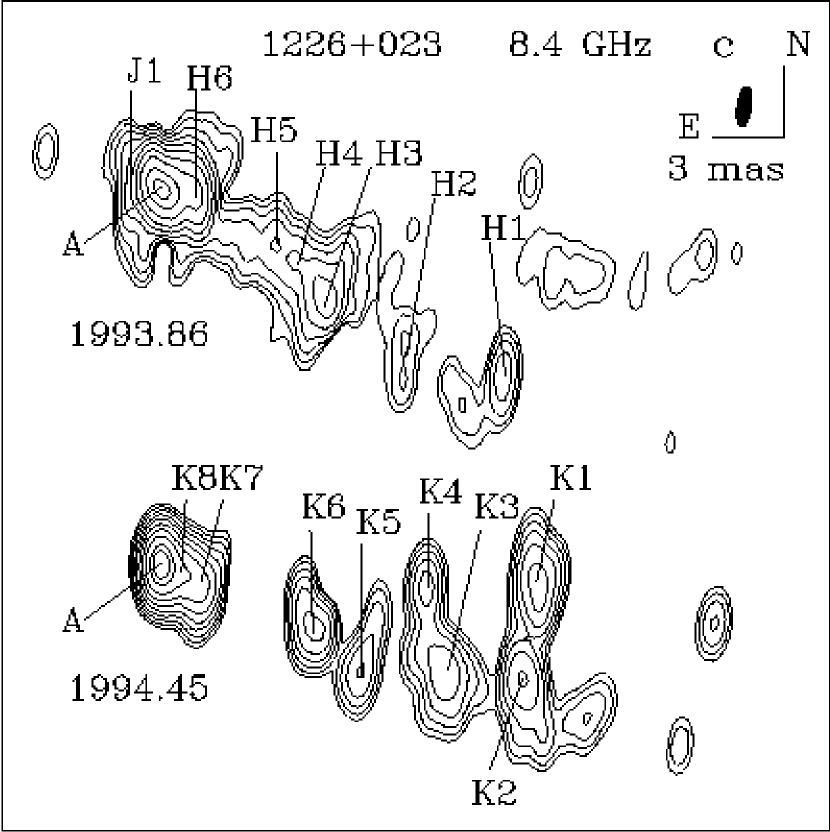
1226023 (3C 273): This relatively nearby object is one of the brightest flat-spectrum radio sources and the brightest X-ray quasar. As such, it has been extensively studied at a number of wavelengths (e.g., McHardy et al. 1999; von Montigny et al. 1997). It is well known to have superluminal motion (see Porcas 1987), which extends out to at least 120 pc at 1.7 GHz (Davis et al. 1991). According to Homan & Wardle (1999), the core of 3C 273 contains significant circular polarization.
In our program the source was observed at 3 frequencies, which allows us to trace the jet out to 16 mas at 8.4 GHz and 8 mas at 22 GHz. The structure of the jet is similar to the description by Mantovani et al. (1999), who observed 3C 273 at 22 and 43 GHz during 42 days in December 1992 and January 1993 to search for short-term variability. In our images we identify 7 moving components from 0.5 mas to 8 mas from the core. To determine the proper motions of these components, we combine the results of our model fitting at different frequencies with that of Mantovani et al. (1999), whose model fits appear to be compatible with ours. The results are shown in Fig. 23(d,e), where Fig. 23d presents the separation of components from the core in the innermost part of the jet out to 4 mas, while Fig. 23e presents the same for the segment of the jet between 4 and 10 mas. The values of the proper motions cover a wide range from 0.3 mas yr-1 to 1.6 mas yr-1, with a tendency toward faster motions farther from the core.
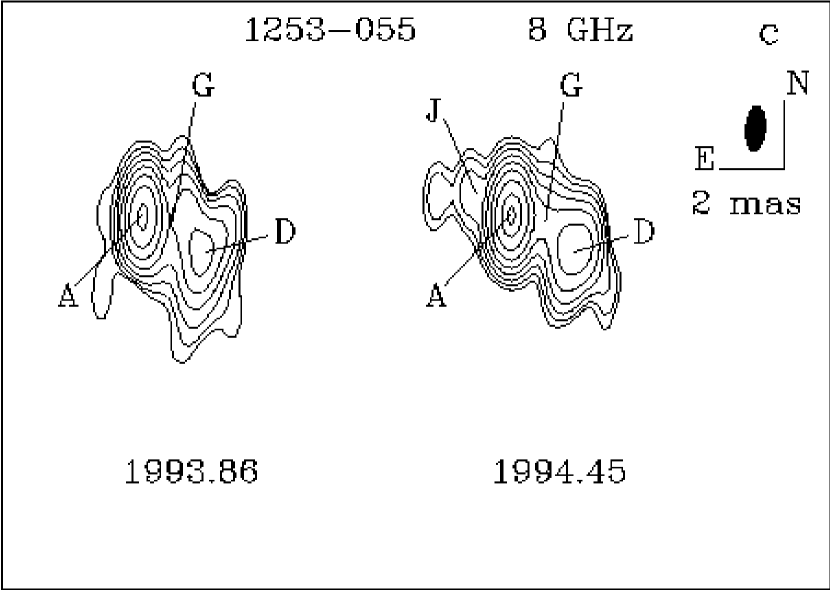
1253055 (3C 279): This quasar, considered the first superluminal source (Whitney et al. 1971), is often nearly as bright as 3C 273 at high frequencies. Since it is also a bright -ray source (Hartman et al. 1999), 3C 279 has been the target of a number of campaigns of contemporaneous monitoring from -ray to radio frequencies (e.g., Wehrle et al. 1998, Grandi et al. 1996). In addition, it was the first active galactic nucleus with circular polarization in the radio core measured by VLBI (Wardle et al. 1998).
We performed observations at 3 frequencies (43, 22, and 8.4 GHz) from November 1993 to July 1997 (Fig. 24a, b, and c, respectively) . A comparison of model-fit parameters at the different frequencies at the same epochs shows that at 8.443 GHz the core spectrum rises toward higher frequencies (=0.240.02), and that long-lived western component has the spectrum of an optically thin synchrotron source (), which is also the case for another moving knot labeled as at 22 GHz and as at 43 GHz (). From the model fitting we derive a higher proper motion for component () than was found at 22 GHz () by Unwin et al. (1998). Wehrle et al. (2001), on the other hand obtain an intermediate value of . From the long-term separation vs. time plot of Wehrle et al., it is apparent that our observations covered a period when the proper motion of the centroid of this component was temporarily faster than average after a slower-than-average period. Comparison of the proper motions of four components suggests a possible increase of apparent speed with distance from the core. A weak, stationary component () at 43 CHz can be identified with component at 22 GHz and, probably, with component at 8.4 GHz.
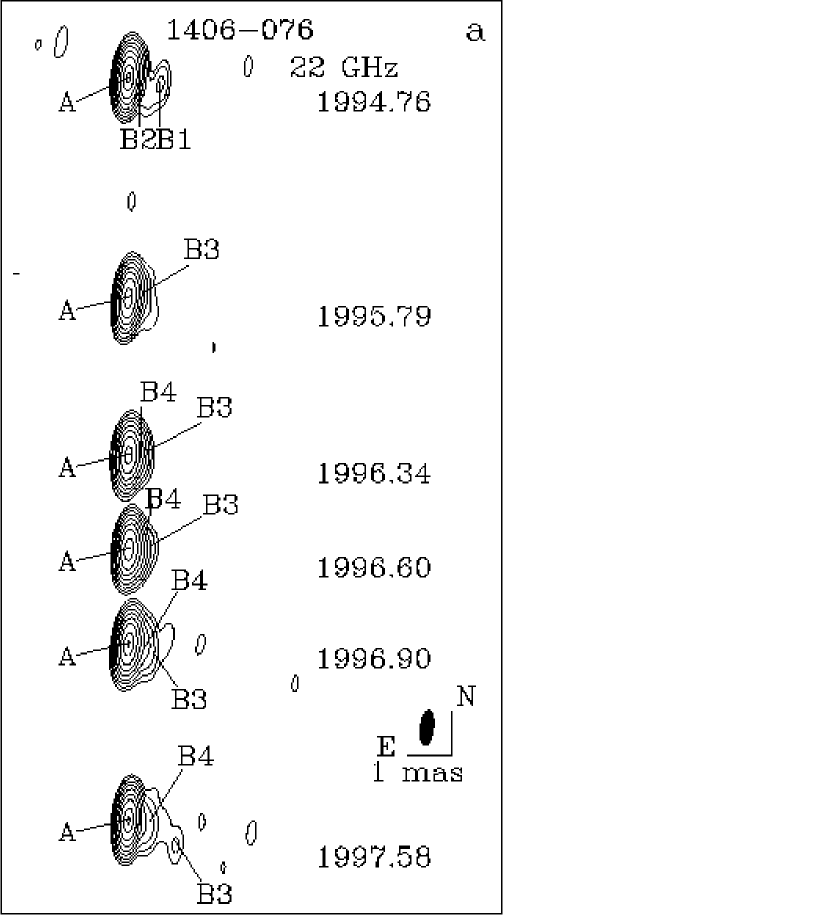
1406076: Ours are the first published images of this source. At 22 GHz (Fig 25a) this quasar has a weak bent jet to the west out to 1 mas. The two moving knots show significantly different proper motions. The component with higher proper motion gradually turns from west-northwest to west-southwest respect to the core, with a total change in PA of about 35∘.
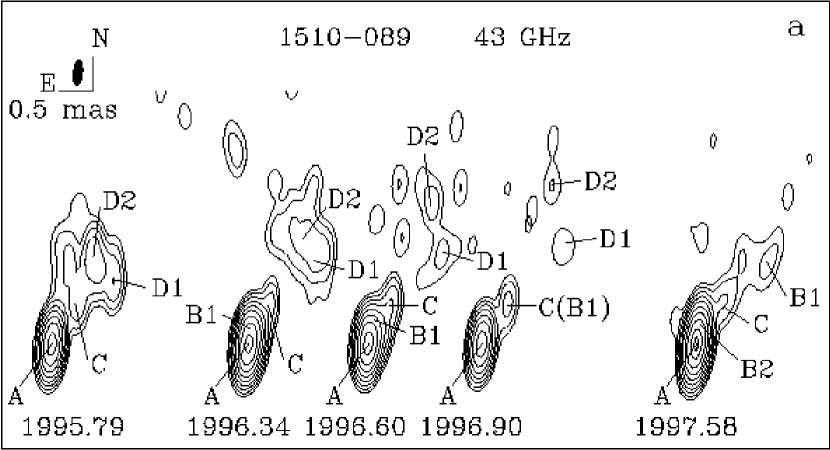
1510-089: This is a highly polarized quasar at optical wavelengths, with rather bright and flat-spectrum X-ray emission (e.g., Singh et al. 1997). VLA images at 20 and 6 cm (Price et al. 1993) reveal an unresolved core and a secondary component about to the southeast. The 15 GHz image of Kellermann et al. (1998) reveals a short jet extended to the north and then bending to the northwest within 2 mas of the core. In the VLBI image at 1.67 GHz presented by Bondi et al. (1996) the dominant component lies to the north, which suggests that the core is faint at this frequency. That map also contains faint secondary components to the north-northwest and south-southeast that are probably artifacts caused by small calibration errors.
At 43 GHz (Fig. 26a) the jet has complex diffuse structure out to 1.5 mas. This seems to be in the form of a broad jet that appears to bend from PA near the core to PA beyond 1 mas, consistent with the lower resolution 15 GHz image of Kellermann et al. (1998). Component at a distance 0.6 mas from the core is probably a stationary feature; its model-fit parameters are similar to those of component 2 in the 8.55 GHz map of Fey & Charlot (1997) obtained in April 1995. In the last two epochs, moving component appears to merge with component . The model fit for epoch 1997.58 indicates the presence of a new component () near the core. Our model fitting suggests a double structure for the farthest component, and , with different proper motions and therefore different times of zero-separation. However, this region is heavily resolved, leading us to consider these to belong to the same, complex feature.
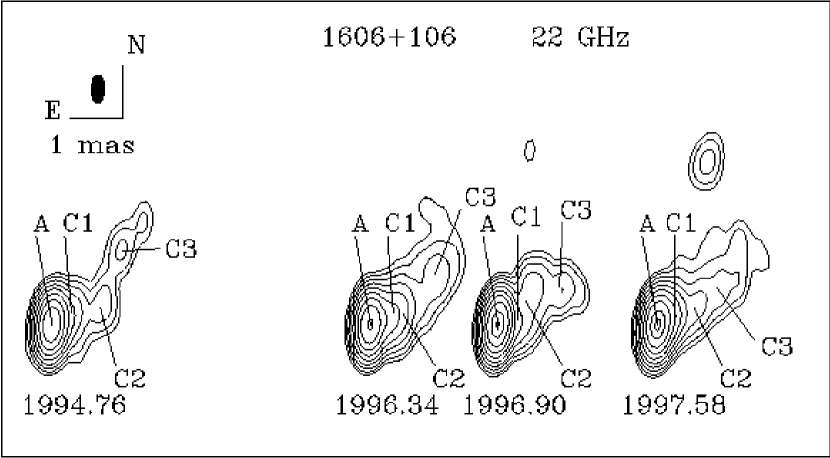
1606106: The VLBI structure of this quasar was investigated at 2, 8, and 15 GHz from 1992 to 1997 by Piner & Kingham (1998). Their images at 8 GHz show a jet with a sharp bend at a distance of 1 mas from the core from PA to PA. These authors found four moving components (, , , and ) with apparent speeds of , , , and , respectively, plus stationary component .
At 22 GHz (Fig. 27) the jet has a sharp bend from the west to the north at about 1 mas from the core. Model fitting indicates a weak knot () located at the position where the jet bends, whose distance from the core is constant within the uncertainties. However, its position angle differs significantly in 1996.90 from that of the other three epochs. Our data also do not indicate any motion for components and . It seems likely that component is the same as component of Piner & Kingham (1998), and that their component is a superposition of our components and . The proper motion measured by Piner & Kingman for is determined mainly from the first two epochs, without which it would be difficult to draw a conclusion about its motion. Furthermore, according to these authors the later observations have better -coverage. No motion is detected in our images.
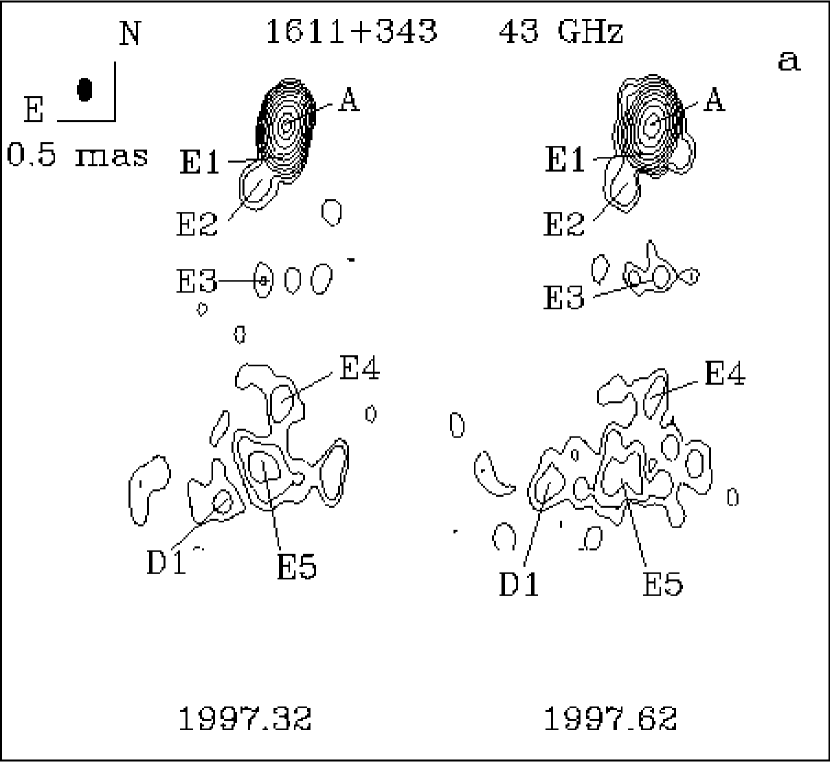
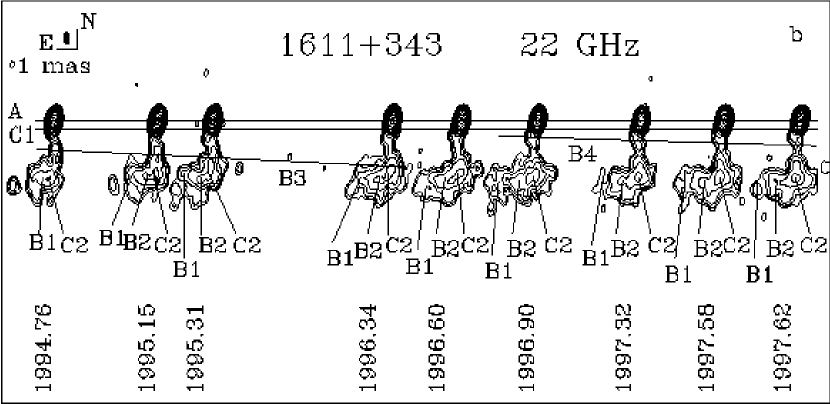
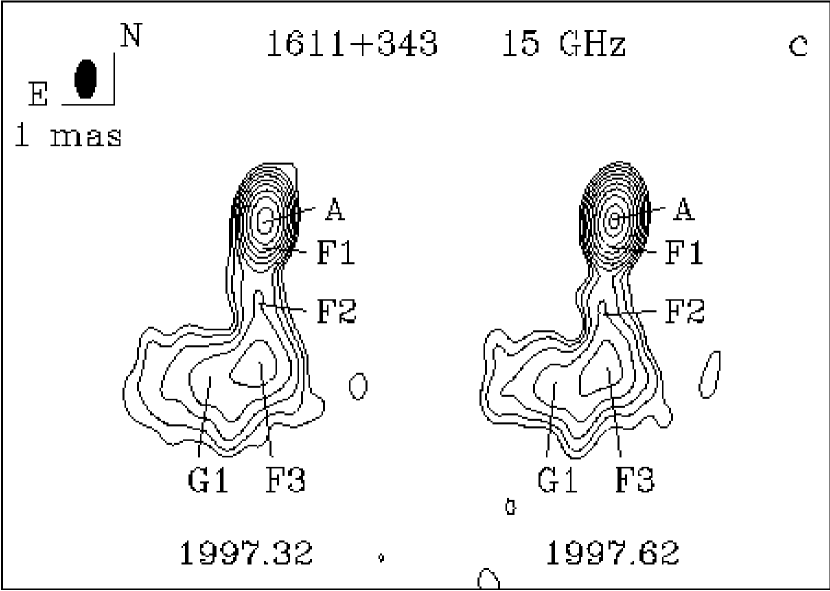
1611343 (DA 406): At 1.7 GHz, VLBI maps of this quasar by Bondi et al. (1996) show only a single compact component. No flux density or structural variations were detected over three epochs (1980.1, 1981.8, and 1987.9), although this source is a well-known variable at lower frequencies (Cotton & Spangler 1979; Altschuler et al. 1984). Altschuler et al. (1984) detected only modest variability at 1.4 GHz, however. The 2 and 8 GHz VLBI images of Piner & Kingham (1997a) reveal a complex jet extending south from the core. These authors used model fits to measure the apparent speeds of four components to be , , , and , (from the innermost component outward).
We present a sequence of 9 images of the object at 22 GHz (Fig. 28b) and two images each at 43 and 15 GHz (Fig. 29a,c). These show a thin jet to the south, ending in a bright diffuse component 2.9 mas from the core at the site of a sharp bend to the east of as much as 90∘. Our model fitting of the 22 GHz data finds two stationary features: near the core and at the site of the sharp bend of the jet. Two components ( and ) move between these stationary knots, while two other moving components ( and ) lie beyond . The model fitting indicates that components and are blended with component at the first epoch, 1994.76, and resolved from it at the next epoch. Although these components move at different proper motions (and, therefore, have different times of zero separation from the core if we extrapolate linearly) according to the model fits, the sequence of images gives the impression that they are features of the same disturbance in the jet. The proper motions of the innermost components are significantly higher than those of the outer knots, which agrees with the results obtained by Piner & Kingham (1997a), although our values of apparent velocities are somewhat higher. The bright knot at 22 GHz is identified with components and at 43 and 15 GHz, respectively. This allows us to estimate the spectral index of this stationary knot between 15 and 43 GHz to be , which is quite steep. The model fitting at 15 GHz shows a large and bright component (), which can be identified as the combination of components and , while at 43 GHz component appears to correspond to component . Component seems to be too weak to detect at 43 GHz. According to this cross-frequency identification, component has a spectral index between 22 and 43 GHz.
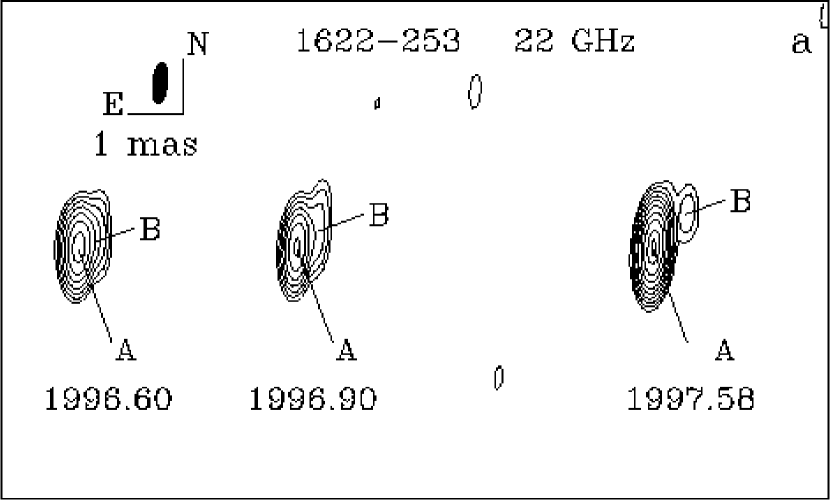
1622253: According to Perley (1982), this quasar has a weak secondary component at PA at and “diffuse secondary” emission at PA at at 1.4 and 5 GHz. VLBI maps at 2 and 8 GHz presented by Fey et al. (1996) show very weak jets to the northwest and north, respectively. The VLBA image at 8.3 GHz obtained in February 1997 by Tingay et al. (1998) displays a core-dominated compact source with a weak jet-like structure extending out to 2 mas from the core along PA.
At 22 GHz (Fig. 29a) our three epochs of VLBA observations over 1 yr reveals that the flux density of the core varied by a factor of 5. The images contain a moving component, , whose PA rotates from west to northwest with greater separation from the core as it moves at a high apperant speed . This is the first detection of superluminal motion in this object. The location of component in 1997.58 appears to agree with the position of a feature in the 8 GHz image of Tingay et al. (1998). With tapering of the data and model fitting, we detect a diffuse component (, , and , with the numbers indicating epoch) to the north at a distance 1.5 mas from the core. It appears that component was turning toward the direction of this diffuse component during our observations.
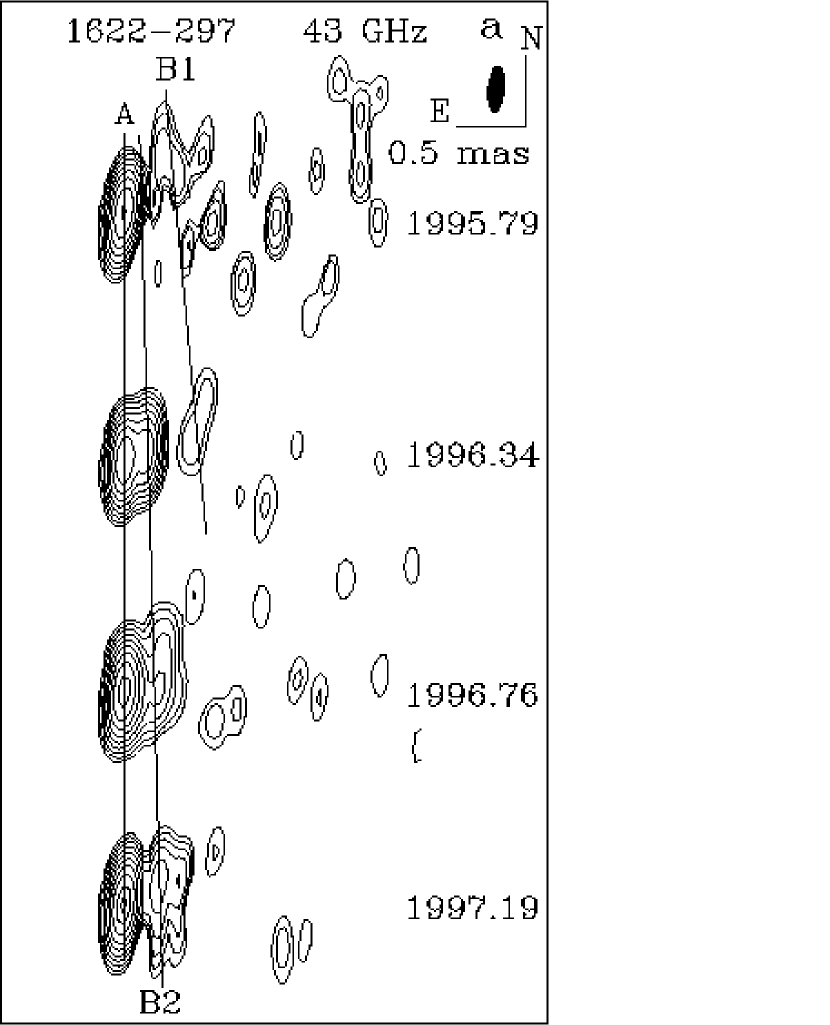
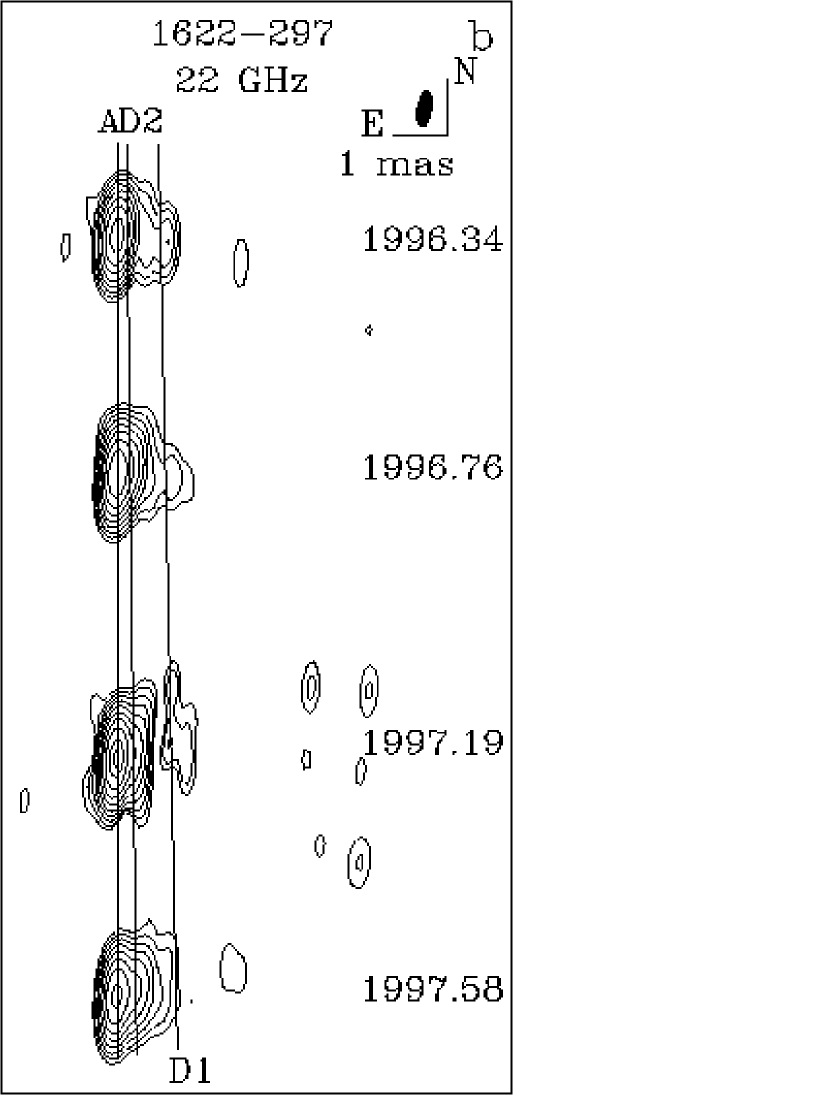
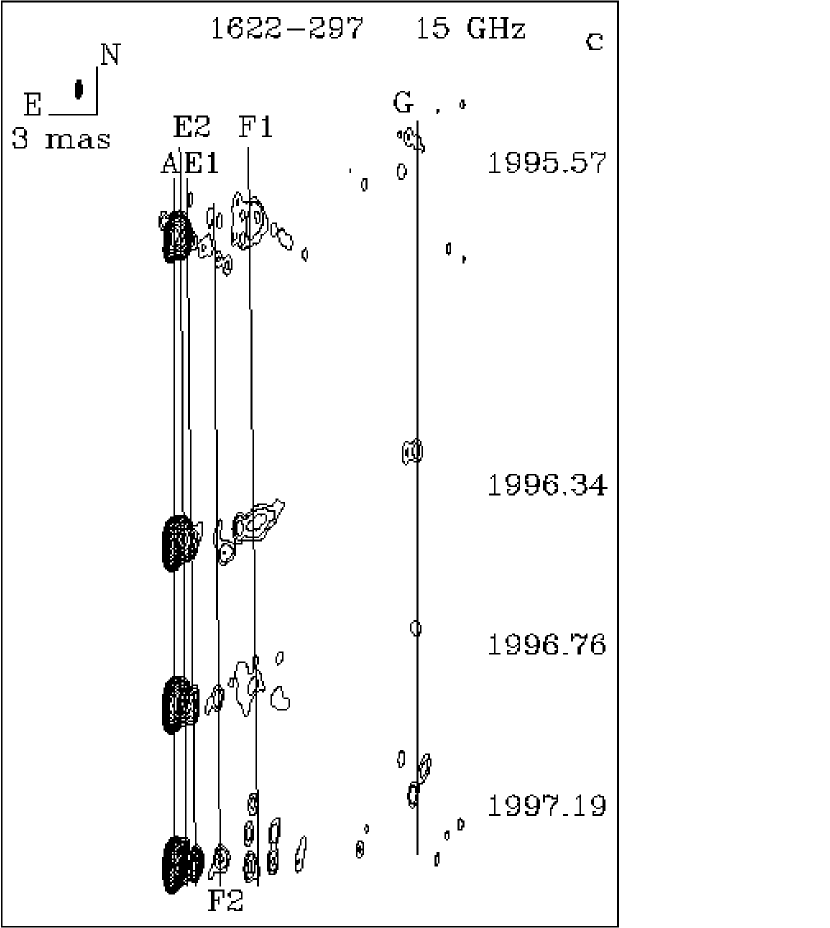
1622297: This source is the brightest, most luminous -ray blazar ever detected (Mattox et al. 1997b). During the period of observation by EGRET from 6 June 1995 to 25 July 1995 the source showed the most rapid GeV -ray flux change yet seen for any blazar, with a doubling time hr. Perley (1982) found weak secondary structure (at PA , from the main emission) at 1.4 GHz. A VLBA image of the source at 1.65 GHz by Tingay et al. (1998) contains a jet along PA consisting of a prominent component approximately 15 mas from the core and diffuse structure out to 30 mas. The VLBA image at 5 GHz obtained by the same authors reveals a strong component 4 mas from the core.
Our 15 GHz images (Fig. 30c) show a weak, stationary component () located 15.40.1 mas from the core at PA. We find components ( and ) that move with apparent speeds of 10 (Fig. 30e) at distances of 3 and 5 mas from the core. Inside 1.5 mas from the core, the jet consists of three components at 15 GHz (, , and ), and 2 components at 22 GHz (, ) and 43 GHz (, ). Comparison of the model-fit parameters of the different features allows us to identify component (43 GHz) to be the same as (22 GHz) and (15 GHz). We further identify component (43 GHz) with (22 GHz) and (15 GHz) (see Fig. 30d). Component and feature // have proper motions similar to those of components and farther down the jet. The model-fit parameters of the innermost components reveal significantly different superluminal speeds ( times less) than for the downstream components. Our simultaneous observations at three epochs (1996.34, 1996.76, and 1997.19) at 15, 22, and 43 GHz allow us to estimate the spectral indices of the core and jet components. The core has an inverted spectrum ( and in 1996.76 and 1997.19, respectively) with the flatter spectrum at the higher flux density. In 1996.34 component appears to be blended with the core at 15 GHz. Component has a steep spectral index (); this is also the case for component ().
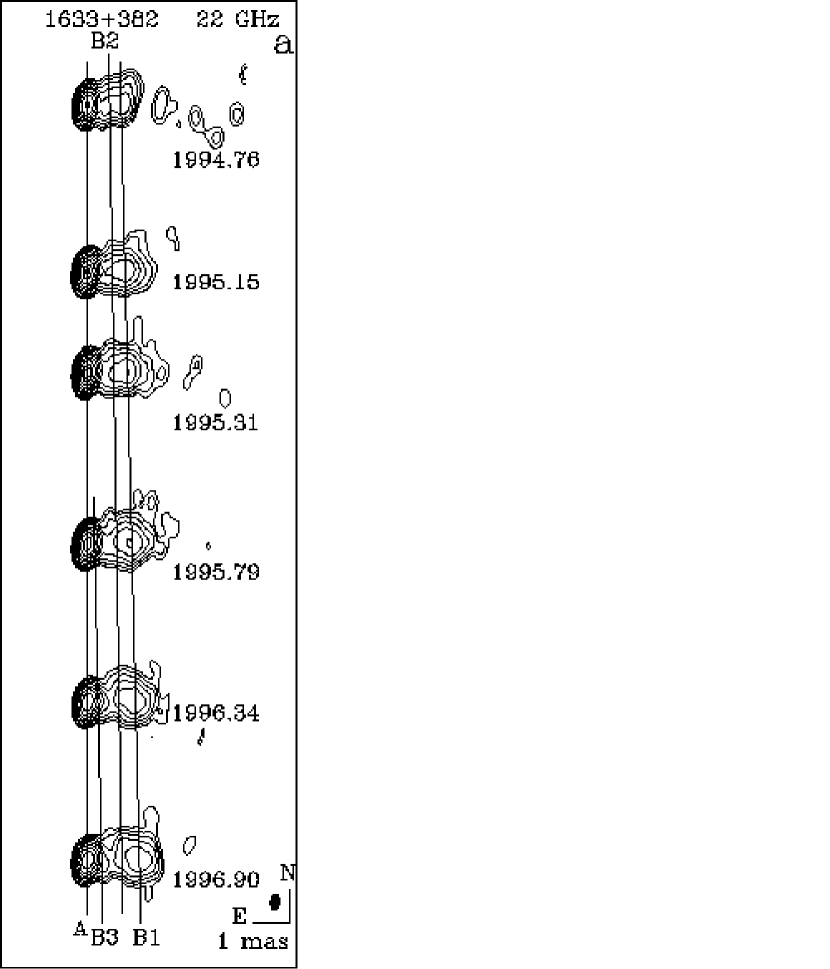
1633382: A 1.7 GHz VLBI image of this quasar by Polatidis et al. (1995) shows a prominent jet to the west out to 50 mas, where a sharp bend to the south is observed. The 2.3 GHz VLBI map by Fey & Charlot (1997) contains a weak jet out to 20 mas. The 8 GHz image by the same authors reveals curvature of the jet within 5 mas of the core from PA to . A proper motion of mas yr-1 was determined by Barthel et al. (1995) on the basis of three epochs (1979.25, 1984.40, and 1986.89) of VLBI observations at 5 GHz.
Our 22 GHz images (Fig. 31a) show a prominent jet out to 1.5 mas along PA and reveal motion of bright component throughout 6 epochs of observation. Model fitting indicates the presence of a component () upstream of component with significantly lower apparent speed. Component has somewhat higher proper motion than detected previously for this source. However, a new component (), which is seen during the last three epochs, has a proper motion corresponding to the estimate of Barthel et al. (1995).
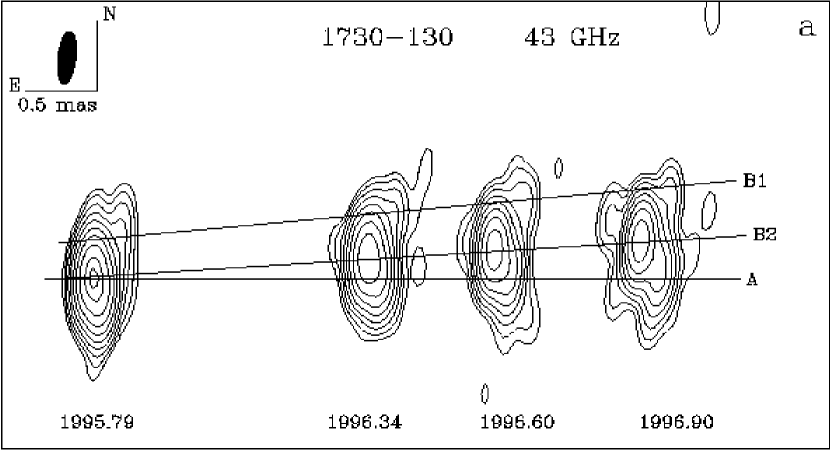
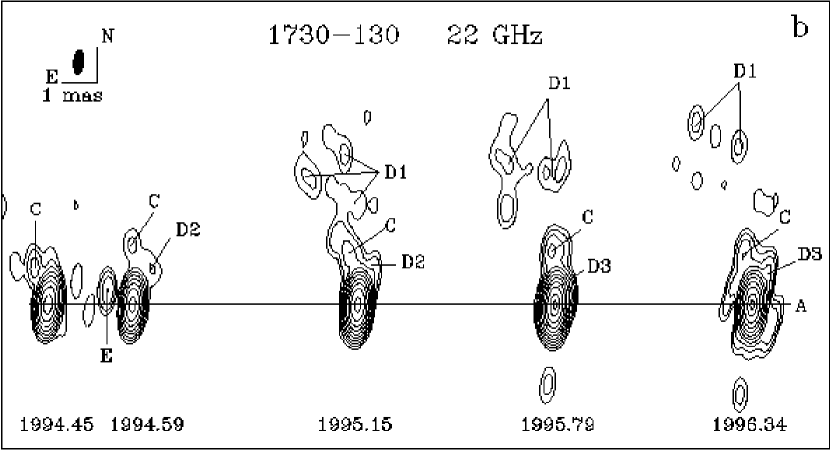
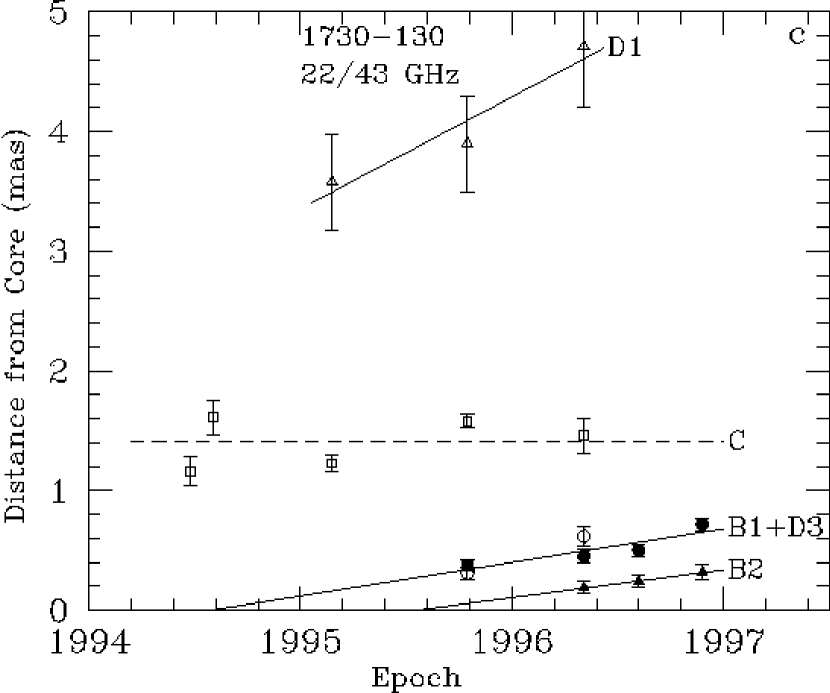
1730130 (NRAO 530): The 1.7 GHz VLBI map of this quasar by Bondi et al. (1996) shows a strong secondary component 25 mas from the core at PA, while the structure seen on the 8.4 GHz image by Tingay et al. (1998) consists of a diffuse jet out to 5 mas along PA. In 1995 the source underwent a dramatic radio outburst with amplitude higher than any found over 30 years of monitoring (Bower et al. 1997). According to these authors, their VLBI observations at 86 GHz reveal the creation of new components in the jet that move to the southwest at apparent velocities of 7.9 (, their notation) and (). They associate the creation of component with a radio flare observed in mid-1994 and the creation of their component with the 1995 outburst.
Our 43 GHz images (Fig. 32a) were obtained at epochs during and after the 1995 flare. Based on better time sampling, we interpret the evolution of the source in a different manner from Bower et al. (1997). The time development is simpler if it we assume that the component ejected during the big flare in 1995 is the brightest feature on the VLBI images over at least the next two years. In this case, the structure and motion are both roughly to the north. The Bower et al. interpretation (which assumes that the brightest feature is always the core), on the other hand, requires trajectories that are bent by nearly to connect with the structure we find north-northeast of the core on our images. According to our interpretation, a very strong component () was ejected along PA at a superluminal speed similar to the velocity indicated by Bower et al. (1997) for their component . The innermost jet appears to be bent by about 40∘ and a second moving component (, which can be identified with component at 22 GHz) is seen at PA. The extrapolated time of zero separation from the core of component associates it with the radio flare in the middle of 1994. Our 22 GHz images (Fig. 32b) contain a stationary feature () to the north at a distance mas from the core, beyond which the jet appears to wiggle through one more turn of about 25∘ toward the direction of a weak, diffuse component (). The diffuse component is absent in the lower dynamic-range images of 1994.48 and 1994.59, and appears at a distance 3.5 mas from the core in the 1995.15 image, just before the flare at mm-wavelengths. The proper motion of this feature from the model fits is quite high over the three epochs of observation, with an apparent speed of , which corresponds to an extrapolated time of ejection 1991.41.2. Bower et al. (1997) also detected an expanding “halo” with an apparent velocity of about 26 between April 1994 and April 1995. In addition, they found a correlation between the rise in -ray flux and increase in radio flux from 8.0 to 90 GHz that implies an association of -ray activity with the creation of the superluminal VLBI component. Our 43 GHz data show that the epoch of zero-separation of component coincides with the epoch of the -ray light curve peak within 2 weeks.
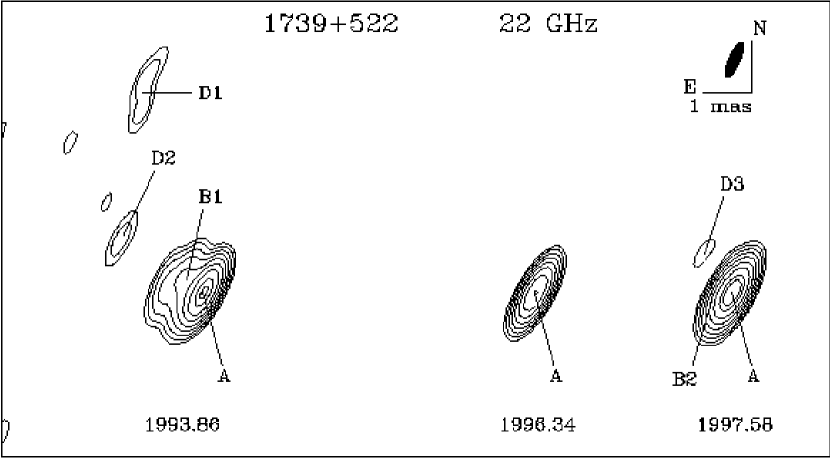
1739522: The 1.7 GHz VLBI map of this quasar by Polatidis et al. (1995) contains very weak extended structure to the east up to 10 mas and, perhaps, a faint secondary component to the northwest 20 mas from the core. A 2.3 GHz VLBI image reveals a weak, thin structure out to 15 mas along PA (Fey et al. 1996). The 8.55 GHz map of these authors at the same epoch shows a jet-like structure curved from PA near the bright core to PA beyond 1 mas. The 5 GHz image by Pearson & Readhead (1988) contains a dominant core plus a weak component at PA 1.7 mas from the core.
Our images at 22 GHz (Fig. 33) during the last two epochs of our program are also dominated by the unresolved core. The lower dynamic-range 1993.86 image contains a short jet along PA plus the suggestion (near the noise level) of a sharply curved extension to the north. Our images indicate strong variability of the intensity of the jet, but the absence of features that can be followed negates any possibility of estimating the jet velocity. However, a comparison of the results of model fitting of our 1993.86 observations with the Gaussian model of the 8.55 GHz image at epoch July 1994 presented by Fey et al. (1996) suggests that our component in 1993.86 might correspond to their component 2 at 8.55 GHz. If we make this identification and assume no frequency-dependent gradients in separation from the core, we can make a very tentative estimate of the proper motion of 0.56 mas yr-1, which corresponds to a high apparent speed, (not included in Table 5 or in our subsequent analysis).
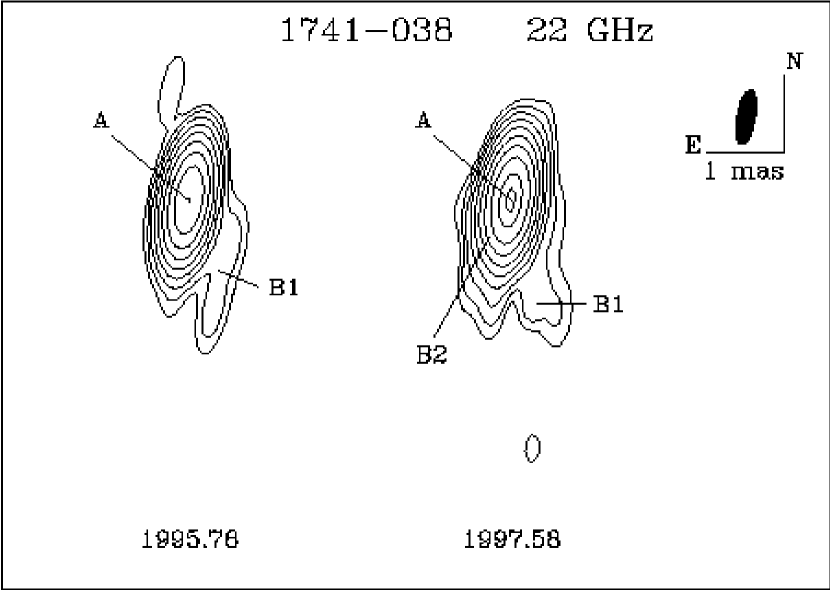
1741038: Perley (1982) found no arcsec-scale structure (% of the brightness peak) in this quasar at 1.4 and 5 GHz. The source has been imaged at 2.3 and 8.55 GHz at two epochs: July 1994 (Fey et al. 1996) and October 1995 (Fey & Charlot 1997). These images indicate the presence of a component (labeled by the authors as “2”) to the southwest at a distance of 0.3 and 0.4 mas from the core, respectively.
Our 22 GHz images (Fig. 34) show a weak southern component (), which is present at both epochs. Our first epoch is very close to the date of the observation by Fey & Charlot (1997); lies at the same position angle as their component . A two-epoch determination of the proper motion of gives the value of mas yr-1, which corresponds to an apparent speed of . However, with only two epochs of observation, the equatorial position of the source (which causes calibration errors to create artifacts that appear to be significant components), and a very weak jet, we do not consider this result sufficiently sound to list in Table 5. On the other hand, if we adopt this value and assume that the viewing angle is that required to maximize the apparent superluminal motion, we obtain a viewing angle () and Doppler factor () similar to those obtained by Wajima et al. (2000) from two-epoch VSOP observations at 1.65 and 5 GHz.
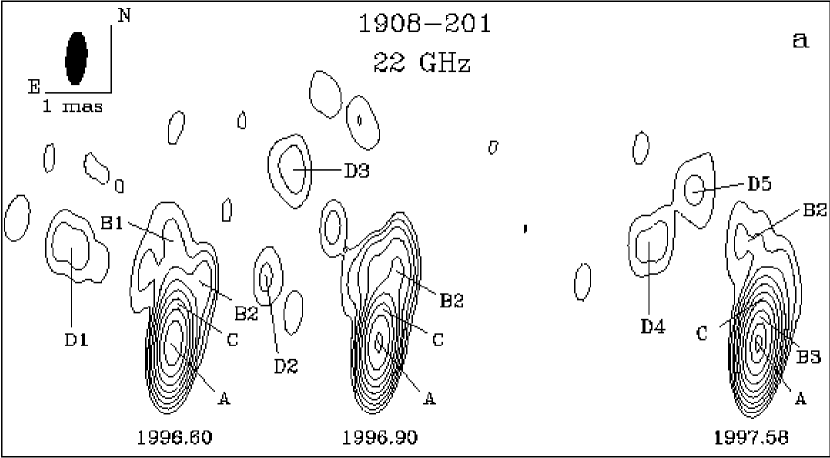
1908201: The source is a BL Lac object with unknown redshift (but based on the absence of a detectable host galaxy). Perley (1982) finds no arcsec-scale structure at 1.4 and 5 GHz at brightness levels less than 0.8 and 0.4%, respectively. A VLBI image of the source by Tingay et al. (1998), obtained in February 1997 at 8.4 GHz, shows jet-like structure out to 3 mas from the core along PA.
Our 22 GHz images (Fig. 35a) show a sharp bend in the jet by at mas, plus rather messy looking structure beyond 2 mas from the core. Our model fitting indicates a possible stationary feature () at a distance mas from the core and a component () with changing PA, which separates from the core at a high apparent speed. This is the first detection of superluminal motion for this source.
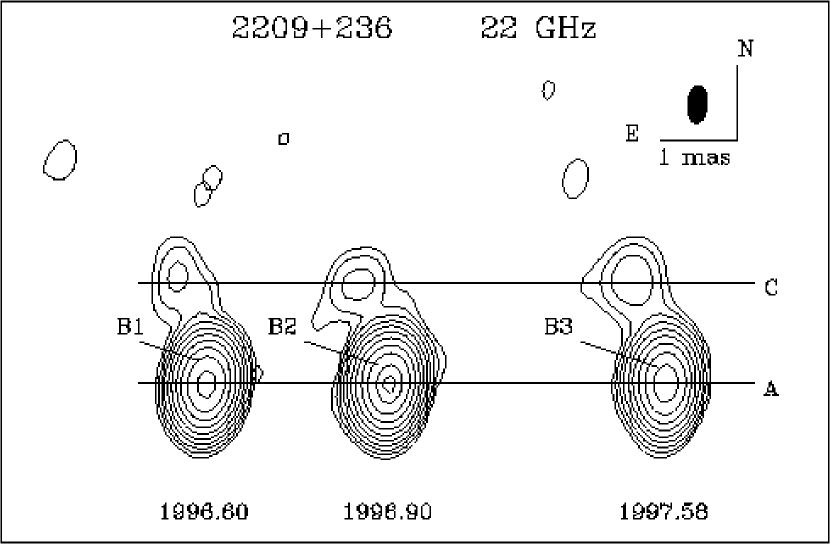
2209236: This object is characterized by the NED database as a quasar with unknown redshift. The first VLBI image of the source was published by Kellermann et al. (1998), whose 15 GHz image contains a weak bent jet extending northeast from the core. Our 22 GHz images (Fig. 36) show a bright core with a weak jet along PA. Three epochs of observation reveal a stationary feature 1.4 mas from the core that underwent a slight increase in brightness as the core faded.
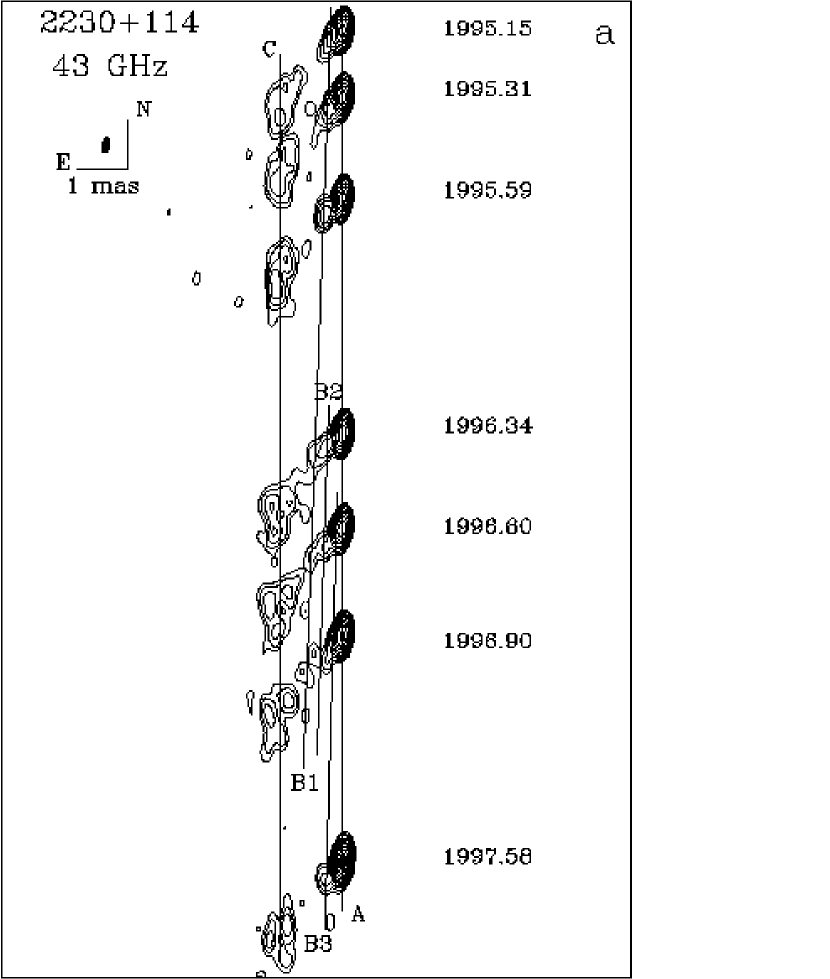
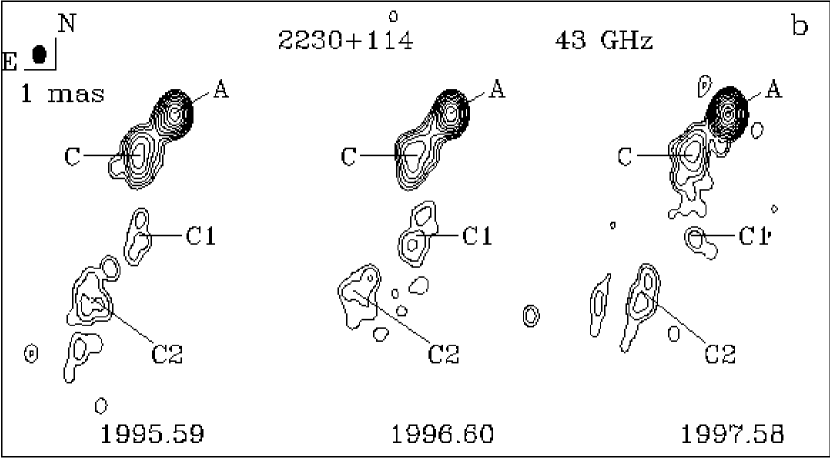
2230114 (CTA102): Perley (1982) find a single secondary (3.6% of peak intensity) component 1.6 arcsec from the main emission at PA at 1.4 GHz in this quasar. Antonucci & Ulvestad (1985) confirmed the presence of secondary structure to the southeast. A 32 cm VLBI image by Rantakyrö et al. (1996) contains three components: a bright double knot containing the core and a jet component as well as a faint feature to the north, which also was detected by Antonucci & Ulvestad (1985). A VLBI image at 8.55 GHz by Fey & Charlot (1997) shows a prominent jet to the southeast out to 20 mas, with a sharp bend by up to 90∘ at a distance of about 10 mas. Miltiple twists of the jet are apparent in the 15 GHz map of Kellermann et al. (1998). A very high proper motion (0.650.15 mas yr-1) was found at 932 MHz by Bååth (1987), although Wehrle & Cohen (1989) found no significant motion near the core at 5 GHz, with an upper limit of 0.5 mas yr-1. Rantakyrö et al. (1996) detected 4 moving components with proper motions from to mas yr-1; this suggests a possible increase in apparent motion as a function of distance from the core.
Our tapered 43 GHz images (Fig. 37b) allow us to follow the jet out to 8 mas from the core. Our model fits indicate that a new component emerged from the core at PA and moved toward the direction of component (PA), which has complex structure (Fig. 37a) and seems to be stationary over all our epochs of observation, as well as compared with previous observations (Rantakyrö et al. 1996; Wehrle & Cohen 1989). Component is located at a site where the jet bends sharply by about 55∘ into the direction of a weak component (). At , the jet turns to the east through a bend of toward the direction of component , which is located at a distance of 7.3 mas. Components and do not show any motion during our observations. Superluminal motion is detected for three components near the core: , , and (see Fig. 37c). Components and have a similar apparent speed while component , which is the nearest to the core, has a lower proper motion, which agrees with the results of Rantakyrö et al. (1996). Note that a linear back-extrapolation of motion of components , , and suggests that knots are ejected quasi-periodically at intervals of 0.9 yr.
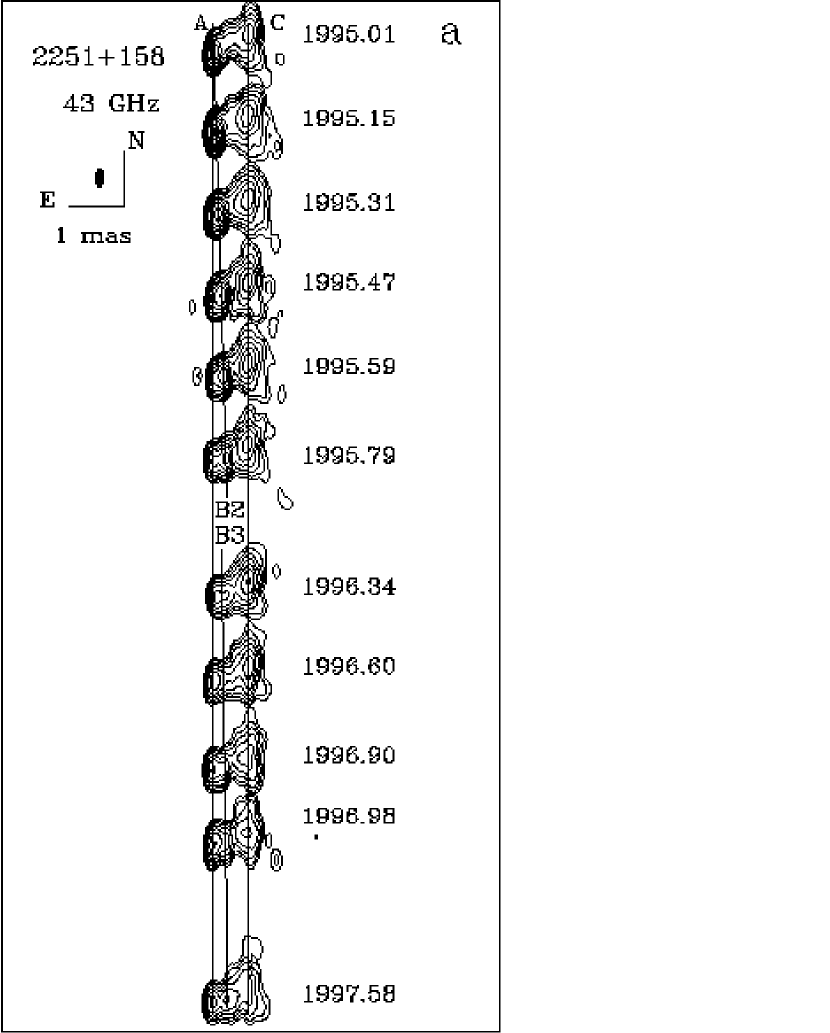
2251158 (3C 454.3): This quasar is a bright, violently variable source whose mas-scale structure has been observed extensively with VLBI (Pauliny-Toth et al. 1987; Cawthorne & Gabuzda 1996; Kemball et al. 1996; Marscher 1998; Pauliny-Toth 1998; Kellermann et al. 1998; Gómez et al. 1999). The yr VLBI monitoring program of Pauliny-Toth et al. (1987) at 10.7 GHz found superluminal components with proper motions between 0.21 and 0.35 mas yr-1, as well as two stationary features about 0.6 and 1.0 mas respect from the core. The VLBI maps obtained at 3 epochs at 1.7 GHz by Bondi et al. (1996) contain a bright core and a secondary component at about 6.6 mas at PA embedded in a lower surface brightness bridge; there was no significant change in the separation between the bridge and the core over 7.8 yr. Recent results at 5 and 8.4 GHz presented by Pauliny-Toth (1998) give mean proper motions of mas yr-1. Gómez et al. (1999) found a moving component at 22 and 43 GHz with much slower proper motion of mas yr-1. A 7 mm polarized intensity image of the source by Kemball et al. (1996) contains three-component structure, consisting of the core, a stationary component at 0.6 mas and a new component located between the two. The stationary component has a magnetic field perpendicular to the jet axis, as previously observed at 5 GHz by Cawthorne & Gabuzda (1996). The 22 GHz polarized intensity images of Gómez et al. (1999) revealed a sudden change in the polarization structure of the core region, which they ascribed to a newly ejected component.
Our well-sampled 43 GHz images (Fig. 38a) show that the highly variable (more than by a factor of 5) core is located at the eastern end of the jet. We have detected three moving components: , , and . The moving components emerge from the core at PA and move toward stationary component . Feature is located at PA at a distance mas, as is the case in the image of Kemball et al. (1996). The same stationary component was first detected in 1983 by Pauliny-Toth et al. (1987) and extensively analyzed by Gómez et al. (1999). Despite the similar trajectories of the moving components, their proper motions differ significantly, ranging from 0.14 to 0.53 mas yr-1 (Fig. 38b). The component with the slowest proper motion () is detected at five epochs and corresponds to component in the 22 and 43 GHz images of Gómez et al. (1999). In addition, Gómez et al. (1999) find a complex jet beyond stationary feature that extends to the north as well as to the south. In our images this structure is modeled by two components, (southern) and (northern).
If we register the images according to the position of the centroid of component , then either the position of the core appears to shift upstream after the ejection of a component, or the core nearly disappears from the images from time to time. This effect is most apparent at epochs 1995.47 and 1996.34. Although in 1996.34 this could be caused by a moving component blending with , hence translating its centroid first upstream and then downstream, such an explanation for epoch 1995.47 would require component suddenly to have deviated sharply from its constant proper motion. As is discussed by Marscher (1998), the change in position or disappearance of the core is consistent with the model in which the core represents a system of standing shocks whose position and perhaps strength change as the Mach number of the flow varies (Daly & Marscher 1988; Gómez et al. 1995).
5 Discussion
Previous studies based on VLBI observations of more limited samples of EGRET sources at lower frequencies have led to conflicting conclusions regarding possible differences or similarities in VLBI properties between -ray blazars and the general population of compact radio sources. [We use this term to represent a flux-limited sample of flat-spectrum radio sources, such as the CJF sample defined by Pearson et al. 1998.] Vermeulen & Cohen (1994) list proper motions of 13 EGRET sources, of which four show no motion, four have low apparent speeds — from 1.5 to — and the remainder have high superluminal velocities, up to . In their studies of EGRET blazars observed with geodetic VLBI, Piner & Kingham (1997a; 1997b; 1998) measured proper motions for five sources, finding high superluminal velocities in two. However, they saw no indication that EGRET blazars are more strongly beamed than non-EGRET blazars. In a VLBI investigation of southern EGRET sources, Tingay et al. (1996; 1998) found a tendency for less pronounced jet bending relative to similar compact radio sources not detected by EGRET. Kellermann et al. (1995) observed 26 -ray AGNs along with 23 radio sources not detected by EGRET, and identified no obvious difference in radio morphology between these two groups. Dondi & Ghisellini (1995) studied a sample of 46 -ray radio sources to conclude that -ray luminosity correlates better with radio luminosity than with either optical or X-ray luminosity. These authors also found a strong correlation between radio–optical and radio–-ray spectral indices. Zhou et al. (1997) determined that a significant correlation exists between compact radio flux density (i.e., that measured with VLBI) and the -radio flux of EGRET-detected AGNs, along with a significant correlation between the luminosities: L L. However, Mücke et al. (1997) applied a Spearman correlation analysis to simultaneously observed radio (cm-wave) and -ray fluxes, which indicated that there is no significant flux-flux correlation. Mattox et al. (1997a) established that EGRET did not detect a significant number of any type of AGN other than blazars and found that the radio sources identified with EGRET detections have greater correlated VLBI flux densities than the parent population of sources with flat radio spectra.
Our program of multi-epoch VLBA observations of 42 -ray blazars allows us to examine the radio morphology of parsec-scale jets in a more uniform manner than has been possible with these previous, less comprehensive or lower resolution observations. Using our data set, we can establish the salient features of the jet as close to the central engine as possible and relate the VLBI properties of -ray blazars to the -ray emission.
Fig. 39 plots the maximum (over the epochs of our observations) VLBI-core flux densities vs. the maximum -ray fluxes for all the sources in our sample. There is a positive correlation between these quantities, with a correlation coefficient of 0.45. This decreases slightly to 0.39 when each point is assigned a weight corresponding to 1/, where is the statistical uncertainty in the flux measurement. According to the t-test, both values of the correlation coefficient correspond to a probability of 95% that the fluxes are related. The -ray luminosity – radio luminosity dependence is displayed in Fig. 40. These are apparent (i.e., relativistically beamed) luminosities, calculated from the observed fluxes listed in Table 1 for the case of isotropic emission. K-corrections of the observed fluxes have been performed with spectral indices indicated in the same table. In the cases in which there is no value for the radio flux, this was estimated from VLBI data at the highest observed frequency (Table 4). Unmeasured spectral indices are taken equal to 0.0 in the radio band and 1.0 at -ray energies. The -ray luminosities correspond to frequency 1023 Hz. The measured flux density at 37 GHz (or estimated from VLBI-data at 43/22 GHz) is used to calculate the radio luminosity. Since luminosities are strongly correlated with redshift we examine the correlation between luminosities excluding the dependence on redshift using a partial correlation analysis (Padovani 1992). Let be the correlation coefficient between variables and . In the case of three variables the correlation coefficient between two of them, excluding the effect of the third one (), is
This method gives a partial coefficient of correlation between -ray and radio luminosities equal to 0.82. The solid line in Fig. 40 corresponds to the relation that best fits the data. If all the fluxes were equal, then the slope of this line would be 1.0 (the dotted line in Fig. 40) owing to the multiplication of both radio and -ray fluxes by the square of the distance to obtain the luminosities. The deviation from a slope of 1.0 — significant at the 2.5 level — indicates that a positive correlation between Lγ/Lradio and Lradio exists. This can be explained if the apparent -ray luminosity depends more strongly on the Doppler factor than does the radio luminosity, as expected (see Lister & Marscher 1999). However, we stress that a found correlation between these luminosities is rather marginal and should be confirmed by further observations, especially of low luminosity blazars.
5.1 Superluminal motion
In our sample of 31 quasars and 11 BL Lac objects we have obtained velocities for jet components in 23 quasars and 10 BL Lac objects. Of these, we have observed 16 quasars and 8 BL Lac objects to have multiple moving knots. The BL Lac objects with more than one moving knot can be separated into two groups: those with similar component speeds (0716741, MKN 421, and ON 231) and those with significantly different velocities (3C 66A, 0235164, 0829046, OJ 287, and BL Lac). The second group has characteristics similar to those of quasars with multiple moving knots. The proper motions in the majority of such quasars (CTA 26, 0528134, 0829046, 3C279, 1622297, and CTA 102) are higher farther from the core. (We do not, however, have sufficient time coverage to determine whether the motions of individual components accelerate.) The apparent velocities in some sources (3C 66A, 1222216, 1633382, and 3C 454.3) vary from one component to another at similar distances from the core. In some cases, the knots ejected later propagate along the same trajectory as the previous one, while in others (0235164, 1156295, and BL Lac) they follow somewhat different trajectories. Of the 33 objects with proper motions detected, 21 contain stationary features in the jet. Some of these standing components were observed at similar positions in previous VLBI studies (0234285, 0836710, 1127145, CTA 102, and 3C 454.3), which confirms their stationary nature. We do not include stationary components in our statistical analysis of moving components, i.e., we do not treat them as features similar to superluminal knots but with proper motions equal to zero. Rather, we consider the standing components to be a distinct phenomenon.
Fig. 41 shows the dependence of the apparent speeds on redshift , with each component having a separate entry. (Note that only three quasars are represented in the highest and lowest redshift bins.) The solid horizontal lines denote the arithmetically averaged velocity for quasars over redshift intervals of 0.5, with the standard deviation of these averages indicated by dashed error bars. The solid diagonal line fits the dependence of apparent speed on for BL Lac objects. We also plot stationary components (triangles) on this diagram to display their redshift distribution. The number of stationary features per redshift interval is, to first order, proportional to the number of sources and therefore independent of . The average value ( standard deviation) of apparent velocities in quasars (57 knots) is , twice as high as the average value for BL Lac objects ( for 28 knots). Both values are significantly faster than the average values of apparent velocities of quasars and the BL Lac objects in the Caltech-Jodrell Bank flat-spectrum sample (CJF) observed at 5 GHz (Pearson et al. 1998, Britzen et al. 1999). The mean apparent velocities of quasars tend to increase with redshift from a value of in the range to over the interval of highest redshifts, . The mean apparent velocities of BL Lac objects in our sample increases dramatically with distance at a rate of Mpc-1. A slight increase in apparent velocity with redshift for the CJF sample has been reported previously for both quasars and BL Lac objects (Britzen et al. 1999).
There are no sources with apparent velocities between and at redshifts . There is no obvious reason based on population statistics as to why this should be the case (cf. Lister & Marscher 1997), since a sample of highly beamed jets should contain some sources pointing almost directly toward the line of sight and therefore having low proper motions.
In Fig. 42 we plot apparent velocities vs. both radio and -ray apparent (i.e., under the assumption of isotropic emisson and no Doppler boosting) luminosity. Table 9 presents the results of a partial correlation analysis, where () is the coefficient of correlation between -ray (radio) luminosity and redshift, is the coefficient of correlation between apparent speed and redshift, () is the coefficient of correlation between apparent speed and -ray (radio) luminosity, and () is the coefficient of correlation between apparent speed and -ray (radio) luminosity excluding the dependence on redshift. A sufficiently strong correlation is apparent for the BL Lac objects, with a correlation coefficient of 0.66 for -ray luminosity and 0.47 for radio luminosity. For the quasars there is no correlation with radio luminosity (correlation coefficient of 0.13), while apparent velocities and -ray luminosity are weakly connected (correlation coefficient of 0.17). In general, a moderate correlation (0.31) is observed between apparent velocities and -ray luminosity of -ray blazars and it is twice as high as for the radio luminosity. Previously, Pearson et al. (1998) found a clear correlation between apparent velocity and apparent radio luminosity in the CJF sample at 5 GHz. An increase in apparent speed with luminosity could be explained by a positive correlation between luminosity and Lorentz factor, while a partial correlation analysis for -ray blazars indicates that the -ray luminosity more strongly depends on Lorentz factor than on radio luminosity. However, the Monte-Carlo simulations of Lister & Marscher (1997) showed that, in flux-limited samples, such a correlation is also expected from selection effects (owing to Doppler beaming and the Malmquist bias) even if there is no relationship between bulk Lorentz factor and luminosity.
Fig. 43 presents the distributions of the apparent velocities of the jet components in quasars and BL Lac objects. The distribution for quasars peaks at 8–9 , while the distribution for the BL Lac objects has a global maximum at low apparent speeds, 2–3 . The Kolmogorov-Smirnov test gives a probability of 99.9% that the values for the quasars and BL Lac objects belong to different distributions. The result that typical VLBI component speeds in BL Lac objects are systematically lower than those in quasars was found previously by Gabuzda et al. (1994) and Wehrle et al. (1992) at 3.6 and 6 cm. Although our distributions of apparent speeds show the same tendency, it is noteworthy that more than 30% of the BL Lac objects in our sample have very high apparent velocities, . Our sample of BL Lac objects partially overlaps with that of Gabuzda et al. (1994) (0716714, OJ 287, Mkn 421, ON 231, Mkn 501, BL Lac). Of these, only the first two have apparent speeds substantially higher in our study than found by Gabuzda et al. at lower frequencies. Our apparent velocity distribution for BL Lacs objects contains a high-velocity tail populated by components in sources in which we report the first detection of superluminal motion (3C 66A, 0235164, 0829046, and 1908201). This demonstrates that jet components in -ray bright BL Lac objects might have similar high apparent velocities as those in quasars. In addition, the source 0829046 shows proper motion over a wide range of apparent speeds covering the ranges typical for both BL Lac objects and quasars. The shift of the maximum of the distribution for quasars into higher apparent speeds and the high-velocity tail for BL Lac objects in our sample compared with the results of Caltech-Jodrell flat-spectrum radio source (CJF) survey (see Pearson et al. 1998) demonstrate that the apparent speeds of the -ray bright blazars are considerably faster than in general population of bright compact radio sources.
The highest apparent speeds that we measure exceed (for ). This is about half an order of magnitude higher than the theoretical limit for the bulk Lorentz factor of the jet flow, (e.g., Begelman et al. 1994). These high speeds correspond in many cases to components that are quite weak, hence they should be confirmed by further observations. Nevertheless, a number of the apparent speeds in excess of are quite well established. This suggests that the Lorentz factor of the jet may only reach its maximum value somewhere in the radio emitting portion of the jet rather than farther upstream where the intense radiation environment would cause Compton drag.
We detect no proper motions in six objects with sufficient time coverage to do so: 0234+285, 0804+499, 0954+658, 1606+106, 1739+522, and 2209+236. Several of these have been reported previously to have superluminal knots (see §4); therefore, our inability to detect motion over the course of our observations does not imply that a source never produces moving components.
5.2 Stationary Features in the Jets
In 27 of the 42 -ray blazars in our sample, we find a total of 45 components that show no motion respect to the core over the duration of our VLBA observations (see Table 6). Out of these 27 sources, 21 are observed to contain moving components as well, some of which propagate at very high apparent speeds, . Hence, the existence of standing features does not correspond to very slow flow speeds in the jet. Rather, stationary hotspots are a common characteristic of compact jets.
Figure 44 presents the distribution of the distances of stationary knots from their respective cores, in projection on the sky plane. The distribution shows a significant global maximum in the range of projected distances of 1– pc from the core, which corresponds to mas for 30% of the sources in the sample. In the few cases of simultaneous observations at different frequencies we can define the spectral indices of stationary and moving components (Table 7). Fig. 45 shows the dependence of spectral indices on distance from the core for stationary and moving knots. For moving knots the average spectral index ( standard deviation) is flatter than for stationary features (). In general, the spectral index of a component is steeper at greater distance from the core. The core itself usually has an inverted spectrum, with average spectral index .
Models for stationary components in supersonic jets fall into three categories: (1) standing recollimation shocks caused by pressure imbalances at the boundary between the jet fluid and the external medium; (2) sites of maximized Doppler beaming where a curved jet points most closely to the line of sight; and (3) stationary shocks where the jet bends abruptly, presumably as a result of striking an obstacle (dense cloud) that deflects it. Stationary knots near the core and, perhaps, the core itself most likely are caused by process (1) (Daly & Marscher 1988). Numerical simulations of the relativistic hydrodynamics and emission of jets (Gómez et al. 1995, 1997) show that when a moving component passes through a stationary feature produced by a standing shock, both components appear to be blended into a single feature and the position of the merged components appears to shift downstream with respect to the pre-disturbance location of the stationary knot. After the collision, the two components appear to split up, with the centroid of the quasi-stationary feature returning upstream. Within this scenario a superluminal component would not show any significant changes in its proper motion. This situation was observed by Gómez et al. (1999) for moving component and stationary component in 3C 454.3. Component corresponds to component in our designation, and we observed a similar behavior when moving components and, probably, approached (see Fig. 38b). In our sample there are a number of examples of this scenario: merging of component with stationary feature in 3C 66A; approach of component to stationary knot in 0420014; blending of component with stationary feature in 0827243; blending of component with component in 0836710; motion of knot through stationary feature in OJ 287; blending of component with knot in 1156295; and motion of component B1 through stationary feature in 1510089. Although the uncertainties in the positions of individual stationary features are usually greater than the shifts in their locations, the mean shift relative to the average position of stationary knots over all such events is significant: mas. Furthermore, there is no systematic change in proper motion of the moving components involved in these events.
In the cases in which a stationary feature is produced at a bend in the jet, the proper motion of a moving knot should change and the component should either become brighter or fainter as it curves around the bend. This has been observed in the best-observed event of this type, in 4C 39.25 (Alberdi et al. 1993). In our sample there are a few suitable examples of bright stationary features located at a bend in the jet: component in 0836710, component in 1127145, component in 1611343, and component in CTA 102. Only in two of these cases was a moving component observed near the stationary feature. In 1127145 a moving component approached stationary knot . Although component is very weak and observed only at three epochs, its proper motion determined from the two last epochs was three times less than the proper motion between the first two epochs (see Fig. 19b). Since component was very faint, the change in its flux is highly uncertain; however, the stationary knot () underwent a significant increase in flux. In the case of quasar 1611343, moving component decelerated and increased somewhat in flux density as it approached stationary feature (Fig. 28d). The lower proper motion of components observed beyond knot compared with that of components near the core might be explained by this scenario.
5.3 Jet Bending
Von Montigny et al. (1995b) suggested two ways to explain that not all radio loud AGNs with flat spectrum are detectable -ray sources. One possible reason is that the -ray emission may be more narrowly beamed than the radio emission. The second hypothesis was based on the possibility that EGRET-identified sources have preferentially straight jets while -ray-quiet AGNs have bent jets. In this case, if a jet bends downstream of the -ray emitting region before the radio emission is produced, the -ray emission could be beamed away from our line of sight but the radio emission could still be beamed toward us. This seems an improbable scenario, since it is much less likely for a jet to bend into a narrow cone about the line of sight than to bend away. Nevertheless, Tingay et al. (1998) found evidence supporting the second suggestion using the sample of 42 -ray blazars listed by Mattox et al. (1997a) and a list of 26 -ray-quiet radio sources from the sample of Pearson & Readhead (1988). However, Tingay et al. note that the VLBI images which they used for the EGRET-identified radio sources are less representative of their actual structure than are the VLBI images of the -ray-quiet radio sources due to the wide variety of VLBI arrays and observing frequencies employed.
Our sample of -ray blazars is sufficiently uniform to check whether bending is more or less prevalent in -ray bright blazars than in the general population. Indeed, as our images show, there is considerable bending of the jets of EGRET-detected blazars on parcec scales. The jet bending is quite similar to that found by Kellermann et al. (1998) in their 15 GHz survey: a number of jets have gradual curvature (3C 66A, 0836710, 1219285, 3C 273, 3C 279), some jets display sharp bends up to 90∘ or more (0954658, 1611343, MKN 501, 1908201), in other sources the jet appears to wiggle through several turns (0202149, 0458020, CTA 102), and some jets are quite broad within a few mas of the core (0235164, 1156296).
Table 8 lists the parameters related to bending for each source (see the description in the section on “Presentation of Results” above). (Note that bending near the core can be detected only over a size scale larger than the resolving beam.) Fig. 46 presents the distribution of jet position angles, demonstrating that there is no preferential direction of projected jet position angle for -ray blazars. The distribution of jet bending (Fig. 47) indicates that 46% of the sources in the sample have jets that curve by more than 20∘, with 63% of these (29% of the total) containing bends sharper than 50∘. In addition, we note that many sources that show no significant curvature within the 1% contour level isophote bend at lower contour levels (e.g., 0440003, 0716714, 0829046, and 1510089). According to Fig. 48, the first bend of the jet takes place in the innermost part of the jet, within a projected distance pc of the core. Our results demonstrate that EGRET sources contain jets with levels of bending similar those of compact radio sources not detected by EGRET (Tingay et al. 1998; Kellermann et al. 1998).
6 Summary
We have completed an extensive VLBA monitoring program of the majority of -ray bright blazars. Our findings can be summarized as follows:
-
1.
In our sample of 42 -ray bright blazars apparent superluminal jet velocities are measured in 33 sources. The results strongly support the thesis that -ray emission originates in a highly relativistic jet. A positive correlation between VLBI core flux and -ray flux suggests that the production of the -ray emission takes place in the most compact region of the relativistic jet, close to the VLBI-core.
-
2.
The distribution of apparent velocities of jet components peaks at , which is significantly higher than the average superluminal speed of jet components in the general population of strong compact radio sources. This follows the expectations of inverse Compton models in which the -rays are more highly beamed than is the radio synchrotron radiation.
-
3.
The maximum in the distribution of apparent speeds of jet components in BL Lac objects occurs at lower apparent speeds than is the case for quasars. However, the BL Lac distribution has a long high-velocity tail, corresponding to a substantial number of -ray bright BL Lac objects that have high apparent speeds similar to those in quasars.
-
4.
A higher level of correlation between apparent speeds of jet components and apparent -ray luminosity than between apparent speeds and radio luminosity further supports the conclusion that the -ray emission depends more strongly on the Lorentz factor of the jet flow than does the radio emission. This is also consistent with both synchrotron self-Compton and external inverse Compton models. It is possible that non-inverse Compton models could produce similar correlations between -ray flux and Lorentz factor. The -ray emission in such models generally arises in the high radiation environment close to the central engine. However, in a subsequent paper (Jorstad et al. 2001) we conclude from the relative timing of superluminal ejections and -ray flares that the -ray emission originates downstream of the radio core.
-
5.
The existence of a number of sources with multiple moving knots with different proper motions in the same source indicates that either the Lorentz factor of the jet flow or the pattern speed of bright features (or both) is variable.
-
6.
The majority of jets of -ray blazars bend significantly on parsec scales, although no more so than do jets of blazars not detected by EGRET.
-
7.
In 27 of the sources in the sample there is at least one non-core component that appears to be stationary during our observations. Stationary knots can be separated into two groups: those nearest to the core ( pc) and those that are farther downstream. The characteristics of these groups are different, which leads us to suggest that the first group corresponds to stationary shocks and the second to bends in the jet.
-
8.
Multi-frequency observations allow us to determined the spectral indices of jet components in 9 sources for 12 moving and 5 stationary knots. The spectra of jet components are those expected for optically thin synchrotron radio sources. The spectral index is steeper for components farther from the core. There is a possible difference between spectral indices of moving and stationary components in the sense that moving components have flatter spectra.
The population of bright -ray blazars detected by EGRET can therefore be categorized as highly superluminal, with apparent speeds as high as for a Hubble constant of 65 km s-1 Mpc-1 (). Furthermore, the jets tend to be bent, a sign of orientation close to the line of sight. We suggest that the jets of EGRET-detected sources might be almost directly aligned with the line of sight at the section where -ray emission originates. Such jets, if they bend (as most jets seem to do), have a much higher probability of curving away from the line of sight than toward it (i.e., almost all directions lead away from the line of sight). This causes a slight misalignment with the line of sight beyond the core, an orientation that is favorable to the detection of apparent superluminal motion.
The correlations presented here should be confirmed and perhaps strengthened through better time sampling of the -ray light curves of more blazars, coupled with regularly and closely spaced VLBA observations. The authors hope that a concerted effort can be carried out with the VLBA when the planned GLAST -ray mission provides well-sampled monitoring of the -ray fluxes of hundreds or even thousands of blazars.
| Source | Name | z | Source | Sγ | S37 | ||
|---|---|---|---|---|---|---|---|
| Type | 10-8cm-2s-1 | Jy | |||||
| 0202149 | 0.833? | Q | 52.826.4 | 1.230.28 | 3.930.10 | 0.490.06 | |
| 0219428 | 3C 66A | 0.444 | B | 25.35.8 | 1.010.14 | 1.560.06 | 0.100.05 |
| 0234285 | CTD 20 | 1.213 | Q | 31.411.6 | 1.530.22 | 4.190.26 | 0.050.03 |
| 0235164 | OD 160 | 0.94 | B | 65.18.8 | 0.850.1 | 6.840.12 | 0.930.15 |
| 0336019 | CTA 26 | 0.852 | Q | 177.636.6 | 0.840.25 | 3.560.31 | 0.190.08 |
| 0420014 | OA 129 | 0.915 | Q | 64.234.2 | 1.440.19 | 8.550.16 | 0.270.05 |
| 0440003 | NRA0 190 | 0.844 | Q | 85.912.0 | 1.370.18 | 1.420.19 | 0.170.04 |
| 0446112 | 1.207 | Q | 32.117.7 | 1.270.16 | 2.110.09 | 0.060.04 | |
| 0454234 | 1.009 | Q | 14.74.2 | 2.140.47 | |||
| 0458020 | 2.286 | Q | 68.241.3 | 1.450.27 | 2.840.10 | 0.370.03 | |
| 0528134 | 2.060 | Q | 147.19.3 | 1.460.04 | 10.870.18 | 0.090.05 | |
| 0716714 | 0.3 | B | 45.711.1 | 1.190.1 | 1.200.43 | 0.480.21 | |
| 0804499 | OJ 508 | 1.433 | Q | 15.16.1 | 1.150.45 | 3.400.08 | 0.060.02 |
| 0827243 | 2.046 | Q | 111.060.1 | 1.420.2 | 2.290.09 | 0.050.03 | |
| 0829046 | 0.18 | B | 33.516.5 | 1.470.40 | 1.250.06 | 0.280.05 | |
| 0836710 | 2.17 | Q | 33.49.0 | 1.620.16 | 2.200.11 | 0.330.06 | |
| 0851202 | OJ 287 | 0.306 | B | 15.86.9 | 1.030.35 | 5.960.28 | 0.140.05 |
| 0917449 | 2.18 | Q | 33.510.0 | 1.190.14 | |||
| 0954658 | 0.368 | B | 18.09.4 | 1.080.24 | |||
| 1101384 | MKN 421 | 0.031 | B | 27.16.9 | 0.570.15 | 0.870.11 | 0.320.10 |
| 1127145 | 1.187 | Q | 46.013.9 | 1.700.31 | |||
| 1156296 | 4C 29.45 | 0.729 | Q | 163.240.7 | 0.980.22 | 2.760.15 | 0.040.06 |
| 1219285 | ON 231 | 0.102 | B | 53.614.1 | 0.730.18 | 1.520.13 | 0.460.07 |
| 1222216 | 4C 21.35 | 0.435 | Q | 48.115.3 | 1.280.13 | ||
| 1226023 | 3C 273 | 0.158 | Q | 48.311.8 | 1.580.09 | 57.30.8 | 0.040.02 |
| 1253055 | 3C 279 | 0.538 | Q | 267.310.7 | 0.960.04 | 33.890.66 | 0.140.06 |
| 1406076 | 1.494 | Q | 128.423.4 | 1.290.11 | 1.360.11 | 0.290.07 | |
| 1510089 | 0.361 | Q | 49.418.3 | 1.470.21 | 4.700.17 | 0.280.04 | |
| 1606106 | 1.24 | Q | 62.413.0 | 1.630.24 | 2.010.12 | 0.060.03 | |
| 1611343 | DA 406 | 1.400 | Q | 51.312.2 | 1.420.15 | 4.950.11 | 0.150.04 |
| 1622253 | 0.786 | Q | 82.535.0 | 1.210.13 | |||
| 1622297 | 0.815 | Q | 321.833.5 | 1.070.07 | |||
| 1633382 | 4C 38.41 | 1.814 | Q | 107.59.6 | 1.150.09 | 3.650.11 | 0.040.03 |
| 1652398 | MKN 501 | 0.034 | B | 3213 | 1.480.10 | 0.080.04 | |
| 1730130 | NRAO 530 | 0.902 | Q | 104.834.7 | 1.230.10 | ||
| 1739522 | 1.38 | Q | 44.926.9 | 1.420.23 | 2.920.16 | 0.340.05 | |
| 1741038 | 1.054 | Q | 48.719.6 | 1.420.42 | 8.120.81 | 1.020.10 | |
| 1908201 | 0.2 | B | 37.120.3 | 1.390.18 | |||
| 2200420 | BL LAC | 0.069 | B | 39.911.6 | 1.600.28 | 5.600.12 | 0.130.04 |
| 2209236 | Q | 45.720.5 | 1.480.50 | ||||
| 2230114 | CTA 102 | 1.037 | Q | 51.615.0 | 1.450.14 | 7.540.24 | 0.280.05 |
| 2251158 | 3C 454.3 | 0.859 | Q | 116.118.1 | 1.210.06 | 16.030.30 | 0.170.03 |
| Epoch | Freq. [GHz] | Calibration Sources | Coeff. |
|---|---|---|---|
| 1993.86 | 22.2 | 1253055 | 1.000.10 |
| 1994.45 | 22.2 | 1253055 | 1.050.10 |
| 1994.65 | 22.2 | 0528134 | 1.100.10 |
| 1994.76 | 22.2 | 1606106 | 1.200.10 |
| 1995.01 | 22.2 | 0528134 | 1.250.10 |
| 1995.01 | 43.2 | 0528134, 2251158 | 1.570.20 |
| 1995.15 | 22.2 | 0528134 | 1.000.10 |
| 1995.15 | 43.2 | 0528134, 2251158 | 1.200.20 |
| 1995.31 | 22.2 | 0827243, 1156295, 1611343 | 1.180.10 |
| 1995.31 | 43.2 | 0528134, 2251158 | 1.300.20 |
| 1995.47 | 22.2 | 0716714 | 1.000.20 |
| 1995.47 | 43.2 | 2251158 | 1.570.20 |
| 1995.59 | 22.2 | 0234285 | 1.060.10 |
| 1995.59 | 43.2 | 2251158 | 1.600.20 |
| 1995.79 | 22.2 | 1406076 | 1.110.10 |
| 1995.79 | 43.2 | 02251158 | 1.520.20 |
| 1996.34 | 22.2 | 0234285, 1156295, 1606106, | 1.180.10 |
| 1611343, 1739522 | |||
| 1996.34 | 43.2 | 0528134, 2251158 | 1.290.20 |
| 1996.60 | 22.2 | 0234285, 1611343, 1156295 | 1.020.10 |
| 1996.60 | 43.2 | 0528134, 2251158 | 1.120.20 |
| 1996.90 | 22.2 | 0827243, 1156295, | 1.390.10 |
| 1606106, 1611343 | |||
| 1996.90 | 43.2 | 0528134, 2251158 | 1.400.20 |
| 1997.58 | 22.2 | 1156295, 1606106, | 1.160.10 |
| 1611343, 1739522 | |||
| 1997.58 | 43.2 | 0528134, 0420014, | 1.230.20 |
| 0446114 |
| Source | Freq. | NE | Epoch of | P.A. | Cont. | RMS | Fig. | |||
|---|---|---|---|---|---|---|---|---|---|---|
| [GHz] | [Jy/Beam] | [mas] | [mas] | [deg.] | [%] | [mJy/Beam] | ||||
| 0219428 | 43.2 | 2 | 1995.79 | 0.95 | 0.35 | 0.20 | 15 | 0.50 | 1.83 | 3a |
| 0219428 | 22.2 | 2 | 1994.65 | 0.90 | 0.75 | 0.40 | 10 | 1.00 | 10.8 | 3b |
| 0234285 | 22.2 | 4 | 1996.60 | 1.47 | 0.60 | 0.30 | 4 | 0.25 | 1.10 | 4 |
| 0235164 | 43.2 | 6 | 1995.47 | 0.96 | 0.30 | 0.15 | 0 | 0.25 | 2.05 | 5a |
| 0420014 | 43.2 | 7 | 1995.31 | 3.53 | 0.40 | 0.15 | 7 | 0.25 | 2.32 | 6a |
| 0446112 | 43.2 | 4 | 1995.47 | 0.82 | 0.40 | 0.15 | 2 | 0.25 | 2.03 | 7 |
| 0454234 | 43.2 | 2 | 1996.34 | 0.83 | 0.40 | 0.15 | 4 | 0.50 | 1.98 | 8 |
| 0458020 | 43.2 | 5 | 1995.31 | 1.53 | 0.45 | 0.17 | 3 | 0.25 | 3.20 | 9a |
| 0528134 | 43.2 | 8 | 1995.47 | 4.21 | 0.32 | 0.15 | 5 | 0.25 | 1.90 | 10a |
| 0528134 | 22.2 | 3 | 1994.65 | 3.82 | 0.60 | 0.25 | 4 | 0.25 | 7.29 | 10b |
| 0716714 | 43.2 | 2 | 1995.59 | 0.41 | 0.40 | 0.20 | 12 | 1.00 | 1.01 | 11a |
| 0716714 | 22.2 | 7 | 1997.58 | 1.01 | 0.45 | 0.30 | 10 | 0.25 | 1.40 | 11a |
| 0804499 | 22.2 | 3 | 1997.58 | 1.08 | 0.55 | 0.32 | 10 | 0.25 | 1.29 | 12 |
| 0827243 | 43.2 | 3 | 1996.90 | 1.40 | 0.30 | 0.16 | 6 | 0.50 | 1.68 | 13a |
| 0827243 | 22.2 | 3 | 1996.34 | 1.53 | 0.60 | 0.30 | 0 | 0.25 | 1.18 | 13a |
| 0829046 | 22.2 | 3 | 1996.60 | 0.98 | 0.70 | 0.33 | 8 | 0.25 | 1.15 | 14a |
| 0836710 | 43.2 | 2 | 1996.90 | 1.41 | 0.30 | 0.17 | 0 | 0.25 | 2.05 | 15a |
| 0836710 | 22.2 | 5 | 1997.58 | 1.79 | 0.42 | 0.33 | 2 | 0.25 | 1.26 | 15b |
| 0851202 | 43.2 | 7 | 1995.79 | 3.09 | 0.40 | 0.15 | 10 | 0.25 | 4.65 | 16a |
| 0851202 | 22.2 | 3 | 1995.47 | 1.22 | 0.75 | 0.25 | 10 | 0.25 | 2.31 | 16b |
| 0851202 | 15.4 | 2 | 1995.47 | 1.11 | 1.10 | 0.40 | 10 | 0.50 | 0.85 | 16c |
| 0917449 | 22.2 | 4 | 1995.01 | 1.19 | 0.55 | 0.30 | 20 | 0.25 | 1.70 | 17a |
| 0954658 | 22.2 | 3 | 1996.34 | 0.51 | 0.50 | 0.30 | 2 | 0.25 | 1.06 | 18 |
| 1127145 | 22.2 | 3 | 1996.90 | 0.97 | 0.85 | 0.32 | 5 | 0.25 | 1.33 | 19a |
| 1156295 | 22.2 | 5 | 1996.34 | 1.87 | 0.60 | 0.30 | 2 | 0.25 | 1.07 | 20a |
| 1219285 | 22.2 | 3 | 1997.58 | 0.30 | 0.65 | 0.32 | 5 | 0.50 | 1.27 | 21a |
| 1222216 | 22.2 | 2 | 1996.90 | 1.13 | 0.60 | 0.30 | 5 | 0.25 | 0.90 | 22a |
| 1226023 | 43.2 | 2 | 1995.15 | 6.66 | 0.38 | 0.16 | 2 | 0.50 | 4.38 | 23a |
| 1226023 | 22.2 | 4 | 1993.86 | 12.7 | 0.75 | 0.35 | 5 | 0.50 | 6.71 | 23b |
| 1226023 | 8.4 | 2 | 1993.86 | 11.5 | 1.60 | 0.70 | 5 | 0.25 | 3.73 | 23c |
| 1253055 | 43.2 | 6 | 1995.15 | 17.9 | 0.40 | 0.15 | 7 | 0.25 | 3.99 | 24a |
| 1253055 | 22.2 | 4 | 1993.86 | 13.4 | 0.80 | 0.30 | 8 | 0.25 | 8.21 | 24b |
| 1253055 | 8.4 | 2 | 1994.45 | 9.04 | 1.60 | 0.70 | 5 | 0.50 | 1.21 | 24c |
| 1406076 | 22.2 | 6 | 1994.76 | 0.93 | 0.80 | 0.30 | 6 | 1.00 | 8.23 | 25a |
| 1510089 | 43.2 | 6 | 1997.58 | 2.46 | 0.42 | 0.15 | 5 | 0.25 | 2.01 | 26a |
| 1606106 | 22.2 | 4 | 1997.58 | 1.25 | 0.65 | 0.30 | 2 | 0.25 | 1.19 | 27 |
| 1611343 | 43.2 | 2 | 1997.32 | 1.47 | 0.25 | 0.15 | 3 | 0.25 | 1.36 | 28a |
| 1611343 | 22.2 | 9 | 1995.31 | 3.56 | 0.55 | 0.30 | 4 | 0.125 | 1.93 | 28b |
| 1611343 | 15.4 | 2 | 1997.62 | 2.76 | 0.75 | 0.45 | 4 | 0.25 | 0.54 | 28c |
| 1622253 | 22.2 | 3 | 1997.58 | 3.20 | 0.80 | 0.28 | 5 | 0.25 | 2.67 | 29a |
| 1622297 | 43.2 | 4 | 1997.19 | 2.67 | 0.36 | 0.12 | 3 | 0.25 | 2.37 | 30a |
| 1622297 | 22.2 | 4 | 1997.19 | 2.94 | 0.80 | 0.26 | 2 | 0.25 | 1.20 | 30b |
| 1622297 | 15.4 | 4 | 1997.19 | 2.34 | 1.15 | 0.40 | 2 | 0.125 | 0.54 | 30c |
| 1633382 | 22.2 | 6 | 1995.31 | 2.22 | 0.55 | 0.30 | 4 | 0.25 | 1.85 | 31a |
| 1730130 | 43.2 | 4 | 1995.79 | 11.7 | 0.44 | 0.14 | 6 | 0.25 | 4.78 | 32a |
| 1730130 | 22.2 | 5 | 1996.34 | 9.58 | 0.75 | 0.30 | 4 | 0.125 | 0.92 | 32b |
| 1739522 | 22.2 | 3 | 1993.86 | 1.16 | 0.80 | 0.30 | 30 | 1.00 | 10.1 | 33 |
| 1741038 | 22.2 | 2 | 1997.58 | 5.67 | 0.80 | 0.30 | 9 | 0.25 | 1.72 | 34 |
| 1908201 | 22.2 | 3 | 1997.58 | 2.03 | 0.80 | 0.30 | 3 | 0.25 | 2.19 | 35a |
| 2209236 | 22.2 | 3 | 1996.90 | 1.99 | 0.60 | 0.30 | 2 | 0.125 | 0.96 | 36 |
| 2230114 | 43.2 | 7 | 1997.58 | 6.11 | 0.34 | 0.15 | 6 | 0.125 | 1.78 | 37a |
| 2251158 | 43.2 | 12 | 1995.15 | 5.50 | 0.32 | 0.14 | 2 | 0.25 | 2.25 | 38a |
| Source | Epoch | Freq. | Comp. | Flux | |||
|---|---|---|---|---|---|---|---|
| [GHz] | [Jy] | [mas] | [deg.] | [mas] | |||
| 0219428 | 1994.65 | 22.2 | A | 0.900.06 | 0.00.05 | 0.080.04 | |
| D3 | 0.09 | 0.56 | 158 | 0.22 | |||
| D2 | 0.04 | 2.75 | 166 | 0.03 | |||
| D1 | 0.05 | 4.62 | 173 | 0.28 | |||
| 0219428 | 1995.47 | 43.2 | A | 0.490.04 | 0.00.03 | 0.050.02 | |
| B3 | 0.41 | 0.11 | 151 | 0.08 | |||
| C | 0.05 | 0.51 | 154 | 0.17 | |||
| B2 | 0.06 | 0.81 | 158 | 0.13 | |||
| B1 | 0.05 | 02.02 | 171 | 0.62 | |||
| 0219428 | 1995.59 | 43.2 | A | 0.580.04 | 0.00.02 | 0.030.01 | |
| B3 | 0.18 | 0.21 | 146 | 0.01 | |||
| C | 0.08 | 0.58 | 155 | 0.13 | |||
| B2 | 0.08 | 0.78 | 164 | 0.47 | |||
| B1 | 0.05 | 02.18 | 176 | 0.66 | |||
| 0219428 | 1995.79 | 43.2 | A | 0.940.05 | 0.00.02 | 0.020.01 | |
| B3 | 0.14 | 0.30 | 148 | 0.11 | |||
| C | 0.07 | 0.59 | 162 | 0.24 | |||
| B2 | 0.03 | 1.17 | 165 | 0.39 | |||
| B1 | 0.05 | 2.64 | 180 | 0.44 | |||
| 0219428 | 1996.34 | 22.2 | A | 0.850.04 | 0.00.04 | 0.050.02 | |
| E4 | 0.13 | 0.32 | 151 | 0.08 | |||
| E3 | 0.11 | 0.72 | 162 | 0.26 | |||
| E2 | 0.03 | 1.69 | 169 | 0.42 | |||
| E1 | 0.06 | 2.47 | 178 | 0.62 | |||
| 0219428 | 1996.60 | 43.2 | A | 0.540.03 | 0.00.03 | 0.010.01 | |
| B4 | 0.22 | 0.51 | 156 | 0.07 | |||
| B3 | 0.06 | 0.98 | 163 | 0.44 | |||
| B1 | 0.05 | 2.46 | 177 | 0.69 | |||
| 0219428 | 1996.90 | 43.2 | A | 0.380.05 | 0.00.04 | 0.020.01 | |
| B5 | 0.15 | 0.11 | 153 | 0.07 | |||
| C | 0.05 | 0.48 | 157 | 0.13 | |||
| B4 | 0.04 | 0.86 | 165 | 0.27 | |||
| B3 | 0.02 | 1.35 | 164 | 0.16 | |||
| B1 | 0.05 | 2.41 | 171 | 0.85 | |||
| 0219428 | 1997.58 | 43.2 | A | 0.630.03 | 0.00.02 | 0.020.01 | |
| B6 | 0.19 | 0.20 | 152 | 0.09 | |||
| B5 | 0.09 | 0.57 | 160 | 0.23 | |||
| B4 | 0.07 | 1.03 | 161 | 0.38 | |||
| B3 | 0.05 | 01.80 | 170 | 0.49 | |||
| B1 | 0.05 | 02.70 | 176 | 0.41 | |||
| 0234285 | 1995.59 | 22.2 | A | 1.460.02 | 0.00.01 | 0.070.03 | |
| C1 | 0.100.04 | 0.330.06 | 205 | 0.0 | |||
| C2 | 0.120.07 | 1.150.1 | 184 | 0.230.03 | |||
| C3 | 0.230.04 | 3.10.3 | 154 | 0.90.2 | |||
| 0234285 | 1996.60 | 22.2 | A | 1.510.01 | 0.00.01 | 0.080.02 | |
| C1 | 0.05 | 0.33 | 25 | 0.0 | |||
| C2 | 0.05 | 0.95 | 21 | 0.32 | |||
| C3 | 0.230.04 | 3.20.25 | 102 | 1.00.2 | |||
| 0234285 | 1996.90 | 22.2 | A | 1.580.02 | 0.00.01 | 0.070.01 | |
| C1 | 0.06 | 0.37 | 23 | 0.0 | |||
| C2 | 0.06 | 1.12 | 20 | 0.41 | |||
| C3 | 0.240.08 | 3.20.3 | 122 | 0.90.15 | |||
| 0234285 | 1997.58 | 22.2 | A | 1.330.02 | 0.00.02 | 0.060.02 | |
| C1 | 0.250.05 | 0.250.04 | 221 | 0.120.03 | |||
| C2 | 0.04 | 1.11 | 19 | 0.28 | |||
| C3 | 0.210.07 | 3.20.3 | 112 | 0.90.2 | |||
| 0235164 | 1995.15 | 43.2 | A | 0.880.07 | 0.00.04 | 0.060.03 | |
| B1 | 0.21 | 0.09 | 29 | 0.3 | |||
| B2 | 0.08 | 0.25 | 9 | 0.2 | |||
| 0235164 | 1995.47 | 43.2 | A | 1.070.05 | 0.00.04 | 0.040.03 | |
| B1 | 0.04 | 0.23 | 27 | 0.2 | |||
| B2 | 0.04 | 0.34 | 9 | 0.1 | |||
| 0235164 | 1995.59 | 43.2 | A | 0.580.08 | 0.00.04 | 0.130.06 | |
| B1 | 0.02 | 0.46 | 37 | 0.3 | |||
| B2 | 0.03 | 0.40 | 11 | 0.2 | |||
| 0235164 | 1995.79 | 43.2 | A | 0.700.05 | 0.00.04 | 0.130.04 | |
| B1 | 0.02 | 0.68 | 26 | 0.2 | |||
| B2 | 0.01 | 0.67 | 20 | 0.3 | |||
| 0235164 | 1996.60 | 43.2 | A | 0.510.08 | 0.00.04 | 0.100.05 | |
| B3 | 0.01 | 0.65 | 29 | 0.2 | |||
| 0235164 | 1996.90 | 43.2 | A | 0.490.07 | 0.00.04 | 0.020.02 | |
| B4 | 0.01 | 1.00 | 27 | 0.2 | |||
| 0420014 | 1995.31 | 43.2 | A | 3.580.07 | 0.00.01 | 0.040.02 | |
| C1 | 0.03 | 0.67 | 170 | 0.07 | |||
| C2 | 0.05 | 1.53 | 155 | 0.14 | |||
| D1 | 0.03 | 1.88 | 171 | 0.08 | |||
| 0420014 | 1995.47 | 43.2 | A | 3.270.08 | 0.00.02 | 0.050.03 | |
| C1 | 0.03 | 0.61 | 169 | 0.07 | |||
| C2 | 0.05 | 1.76 | 153 | 0.12 | |||
| D2 | 0.05 | 1.85 | 179 | 0.10 | |||
| E1 | 0.03 | 2.9 | 177 | 0.13 | |||
| 0420014 | 1995.59 | 43.2 | A | 2.540.09 | 0.00.04 | 0.070.03 | |
| C2 | 0.08 | 1.78 | 155 | 0.17 | |||
| 0420014 | 1996.34 | 43.2 | A | 2.970.06 | 0.00.02 | 0.070.03 | |
| B | 0.09 | 0.21 | 137 | 0.05 | |||
| C1 | 0.02 | 0.76 | 168 | 0.07 | |||
| C2 | 0.07 | 1.83 | 164 | 0.15 | |||
| E2 | 0.06 | 3.20 | 175 | 0.10 | |||
| 0420014 | 1996.60 | 43.2 | A | 2.620.05 | 0.00.02 | 0.060.03 | |
| B | 0.190.06 | 0.260.05 | -1618 | 0.130.04 | |||
| C1 | 0.04 | 0.70 | 166 | 0.07 | |||
| C2 | 0.07 | 1.89 | 152 | 0.18 | |||
| 0420014 | 1996.90 | 43.2 | A | 2.040.07 | 0.00.04 | 0.060.03 | |
| B | 0.06 | 0.36 | 144 | 0.13 | |||
| C1 | 0.06 | 0.53 | 174 | 0.08 | |||
| C2 | 0.04 | 1.92 | 151 | 0.20 | |||
| E3 | 0.02 | 3.01 | 177 | 0.05 | |||
| 0420014 | 1997.58 | 43.2 | A | 2.050.08 | 0.00.04 | 0.070.04 | |
| C1B2 | 0.07 | 0.46 | 166 | 0.20 | |||
| C2 | 0.05 | 1.64 | 160 | 0.22 | |||
| 0446112 | 1995.47 | 43.2 | A | 0.510.08 | 0.00.04 | 0.040.02 | |
| B | 0.100.05 | 0.180.06 | 1134 | 0.180.06 | |||
| C | 0.01 | 0.48 | 120 | 0.06 | |||
| 0446112 | 1996.34 | 43.2 | A | 0.420.09 | 0.00.05 | 0.060.03 | |
| C | 0.02 | 0.45 | 133 | 0.01 | |||
| 0446112 | 1996.90 | 43.2 | A | 0.480.08 | 0.00.05 | 0.050.03 | |
| C | 0.02 | 0.47 | 127 | 0.10 | |||
| 0446112 | 1997.58 | 43.2 | A | 0.540.06 | 0.00.02 | 0.050.02 | |
| C | 0.01 | 0.45 | 140 | 0.01 | |||
| 0454234 | 1995.47 | 43.2 | A | 0.420.04 | 0.00.03 | 0.06 0.02 | |
| 0454234 | 1996.34 | 43.2 | A | 0.730.02 | 0.00.04 | 0.08 0.03 | |
| B | 0.02 | 0.44 | 148 | 0.01 | |||
| 0458020 | 1995.31 | 43.2 | A | 1.550.02 | 0.00.01 | 0.020.01 | |
| B1 | 0.07 | 0.85 | 17 | 0.12 | |||
| C2 | 0.07 | 1.44 | 12 | 0.08 | |||
| C1 | 0.05 | 1.14 | 38 | 0.31 | |||
| 0458020 | 1995.47 | 43.2 | A | 1.150.01 | 0.00.01 | 0.010.003 | |
| B2 | 0.600.03 | 0.200.04 | 72 | 0.070.04 | |||
| B1 | 0.310.04 | 0.710.05 | 203 | 0.080.03 | |||
| C2 | 0.04 | 1.26 | 2 | 0.24 | |||
| C1 | 0.08 | 1.27 | 37 | 0.48 | |||
| 0458020 | 1996.34 | 43.2 | A | 0.710.03 | 0.00.02 | 0.010.006 | |
| B2 | 0.05 | 0.36 | 6 | 0.04 | |||
| C2 | 0.02 | 1.54 | 12 | 0.02 | |||
| C1 | 0.09 | 1.50 | 40 | 0.50 | |||
| 0458020 | 1996.90 | 43.2 | A | 0.540.03 | 0.00.01 | 0.01 0.01 | |
| B2 | 0.07 | 0.44 | 6 | 0.12 | |||
| C2 | 0.02 | 1.51 | 7 | 0.34 | |||
| C1 | 0.06 | 1.70 | 35 | 0.67 | |||
| 0458020 | 1997.58 | 43.2 | A | 0.720.02 | 0.00.02 | 0.07 0.01 | |
| B2 | 0.09 | 0.51 | 4 | 0.04 | |||
| C2 | 0.03 | 1.47 | 1 | 0.28 | |||
| C1 | 0.03 | 1.31 | 36 | 0.01 | |||
| 0528134 | 1994.65 | 22.2 | A | 4.740.02 | 0.00.04 | 0.180.06 | |
| F3 | 0.670.08 | 0.380.02 | 531 | 0.120.02 | |||
| F2 | 0.10 | 0.62 | 45 | 0.01 | |||
| F1 | 0.07 | 0.95 | 76 | 0.05 | |||
| E1 | 0.04 | 1.3 | 26 | 0.07 | |||
| 0528134 | 1995.01 | 22.2 | A | 2.440.02 | 0.00.04 | 0.040.03 | |
| F4 | 1.690.06 | 0.190.01 | 971 | 0.110.03 | |||
| F3 | 0.360.08 | 0.420.02 | 622 | 0.060.05 | |||
| I1 | 0.08 | 0.59 | 98 | 0.33 | |||
| F2 | 0.280.08 | 0.680.04 | 552 | 0.240.04 | |||
| F1 | 0.10 | 0.78 | 83 | 0.47 | |||
| E1 | 0.01 | 1.7 | 41 | 0.20 | |||
| 0528134 | 1995.01 | 43.2 | A | 3.220.02 | 0.00.04 | 0.030.01 | |
| B2 | 0.850.08 | 0.190.05 | 1072 | 0.130.04 | |||
| B1 | 0.360.08 | 0.390.03 | 642 | 0.190.06 | |||
| 0528134 | 1995.15 | 22.2 | A | 2.780.03 | 0.00.02 | 0.010.01 | |
| F4 | 1.350.06 | 0.180.04 | 922 | 0.170.03 | |||
| F3 | 0.430.03 | 0.420.03 | 602 | 0.150.06 | |||
| I1 | 0.470.07 | 0.420.02 | 1093 | 0.300.02 | |||
| F2 | 0.160.04 | 0.860.04 | 513 | 0.320.05 | |||
| F1 | 0.02 | 0.99 | 79 | 0.27 | |||
| E1 | 0.06 | 2.1 | 32 | 0.37 | |||
| 0528134 | 1995.15 | 43.2 | A | 4.790.05 | 0.00.02 | 0.070.04 | |
| B2 | 0.740.03 | 0.220.04 | 1001 | 0.100.03 | |||
| B1 | 0.290.08 | 0.480.04 | 602 | 0.220.04 | |||
| 0528134 | 1995.31 | 43.2 | A | 5.460.06 | 0.00.02 | 0.070.05 | |
| B2 | 0.640.04 | 0.230.02 | 821 | 0.050.01 | |||
| B1 | 0.18 | 0.43 | 69 | 0.17 | |||
| D1 | 0.04 | 0.76 | 41 | 0.03 | |||
| 0528134 | 1995.47 | 43.2 | A | 4.100.02 | 0.00.03 | 0.030.01 | |
| B3 | 3.470.04 | 0.140.03 | 1162 | 0.090.03 | |||
| B2 | 0.320.02 | 0.360.02 | 731 | 0.150.06 | |||
| B1 | 0.07 | 0.64 | 73 | 0.27 | |||
| D1 | 0.07 | 1.42 | 53 | 0.05 | |||
| 0528134 | 1996.34 | 43.2 | A | 3.160.01 | 0.00.01 | 0.130.02 | |
| B4 | 1.780.02 | 0.140.02 | 863 | 0.020.01 | |||
| B3 | 1.770.02 | 0.280.04 | 891 | 0.220.04 | |||
| G1 | 0.06 | 0.40 | 84 | 0.05 | |||
| D3 | 0.03 | 0.57 | 38 | 0.05 | |||
| D2 | 0.03 | 1.3 | 62 | 0.05 | |||
| 0528134 | 1996.60 | 43.2 | A | 4.630.02 | 0.00.01 | 0.080.01 | |
| B4 | 2.490.08 | 0.150.03 | 871 | 0.130.02 | |||
| B3 | 1.280.03 | 0.310.04 | 841 | 0.120.02 | |||
| G1 | 0.210.05 | 0.440.04 | 812 | 0.010.01 | |||
| D3 | 0.03 | 0.69 | 36 | 0.05 | |||
| 0528134 | 1996.90 | 43.2 | A | 3.920.02 | 0.00.01 | 0.110.01 | |
| B4 | 1.080.03 | 0.210.02 | 792 | 0.180.03 | |||
| B3 | 0.400.05 | 0.360.03 | 791 | 0.100.02 | |||
| D3 | 0.05 | 0.71 | 32 | 0.12 | |||
| D4 | 0.04 | 0.94 | 67 | 0.01 | |||
| D5 | 0.07 | 1.2 | 40 | 0.05 | |||
| 0528134 | 1997.58 | 43.2 | A | 1.720.04 | 0.00.02 | 0.040.02 | |
| B4 | 0.630.02 | 0.320.01 | 712 | 0.230.02 | |||
| B3 | 0.250.02 | 0.540.04 | 572 | 0.200.07 | |||
| D3 | 0.18 | 0.97 | 37 | 0.13 | |||
| D4 | 0.07 | 1.6 | 58 | 0.16 | |||
| 0716714 | 1995.15 | 22.2 | A | 0.640.04 | 0.00.04 | 0.050.03 | |
| B2 | 0.07 | 0.11 | 25 | 0.09 | |||
| B1 | 0.01 | 0.95 | 17 | 0.01 | |||
| 0716714 | 1995.31 | 22.2 | A | 0.480.05 | 0.00.03 | 0.070.03 | |
| B2 | 0.01 | 0.28 | 2 | 0.02 | |||
| 0716714 | 1995.47 | 22.2 | A | 0.180.03 | 0.00.02 | 0.050.02 | |
| B2 | 0.01 | 0.42 | 10 | 0.20 | |||
| 0716714 | 1995.47 | 43.2 | A | 0.340.04 | 0.00.03 | 0.030.01 | |
| B2* | 0.05 | 0.54 | 1 | 0.03 | |||
| 0716714 | 1995.59 | 43.2 | A | 0.440.03 | 0.00.02 | 0.050.03 | |
| B2* | 0.03 | 0.60 | 11 | 0.13 | |||
| 0716714 | 1996.34 | 22.2 | A | 0.270.05 | 0.00.04 | 0.110.02 | |
| B3 | 0.04 | 0.48 | 5 | 0.11 | |||
| 0716714 | 1996.60 | 22.2 | A | 0.210.03 | 0.00.03 | 0.050.02 | |
| B3 | 0.01 | 0.52 | 3 | 0.20 | |||
| 0716714 | 1996.90 | 22.2 | A | 0.340.02 | 0.00.03 | 0.010.01 | |
| B4 | 0.05 | 0.18 | 13 | 0.16 | |||
| B3 | 0.01 | 1.29 | 4 | 0.30 | |||
| 0716714 | 1997.58 | 22.2 | A | 1.050.06 | 0.00.04 | 0.070.02 | |
| B5 | 0.04 | 0.23 | 25 | 0.01 | |||
| B4 | 0.03 | 0.76 | 2 | 0.43 | |||
| B3 | 0.01 | 1.9 | 8 | 0.6 | |||
| 0804449 | 1996.34 | 22.2 | A | 0.990.02 | 0.00.03 | 0.110.02 | |
| C1 | 0.03 | 0.38 | 82 | 0.38 | |||
| C2 | 0.03 | 1.05 | 132 | 0.44 | |||
| 0804449 | 1996.90 | 22.2 | A | 0.820.02 | 0.00.02 | 0.010.02 | |
| C1 | 0.05 | 0.21 | 48 | 0.29 | |||
| C2 | 0.03 | 0.84 | 130 | 0.41 | |||
| 0804449 | 1997.58 | 22.2 | A | 1.100.05 | 0.00.01 | 0.060.03 | |
| C1 | 0.03 | 0.27 | 43 | 0.18 | |||
| C2 | 0.02 | 0.91 | 128 | 0.36 | |||
| 0827243 | 1995.31 | 22.2 | A | 0.750.08 | 0.00.03 | 0.100.02 | |
| B1 | 0.370.05 | 0.290.04 | 1192 | 0.200.02 | |||
| D1 | 0.02 | 1.89 | 127 | 0.38 | |||
| D2 | 0.04 | 3.0 | 146 | 0.52 | |||
| 0827243 | 1996.34 | 22.2 | A | 1.560.09 | 0.00.02 | 0.060.02 | |
| C | 0.07 | 0.33 | 125 | 0.08 | |||
| B1 | 0.03 | 0.73 | 136 | 0.33 | |||
| D2 | 0.04 | 3.3 | 146 | 0.57 | |||
| 0827243 | 1996.60 | 43.2 | A | 1.480.05 | 0.00.01 | 0.070.01 | |
| C* | 0.110.05 | 0.340.08 | 1193 | 0.020.01 | |||
| B1* | 0.05 | 0.64 | 129 | 0.28 | |||
| D2* | 0.01 | 3.7 | 142 | 0.15 | |||
| 0827243 | 1996.90 | 22.2 | A | 0.960.04 | 0.00.01 | 0.050.01 | |
| C | 0.270.06 | 0.360.03 | 1095 | 0.110.06 | |||
| B1 | 0.02 | 0.95 | 138 | 0.23 | |||
| D2 | 0.03 | 3.5 | 146 | 0.37 | |||
| 0827243 | 1996.90 | 43.2 | A | 1.580.03 | 0.00.01 | 0.040.01 | |
| C* | 0.03 | 0.51 | 133 | 0.11 | |||
| B1* | 0.01 | 1.1 | 146 | 0.01 | |||
| D2* | 0.03 | 3.8 | 143 | 0.9 | |||
| 0827243 | 1997.58 | 43.2 | A | 1.160.08 | 0.00.03 | 0.040.01 | |
| C* | 0.110.04 | 0.260.05 | 1123 | 0.050.03 | |||
| D2* | 0.01 | 4.1 | 137 | 0.38 | |||
| 0829046 | 1996.60 | 22.2 | A | 0.970.02 | 0.00.04 | 0.060.01 | |
| C1 | 0.06 | 0.29 | 46 | 0.01 | |||
| C2 | 0.200.03 | 0.630.02 | 635 | 0.080.02 | |||
| B4 | 0.06 | 0.97 | 65 | 0.37 | |||
| B3 | 0.06 | 1.4 | 70 | 0.32 | |||
| B2 | 0.04 | 1.75 | 75 | 0.46 | |||
| D | 0.01 | 2.7 | 41 | 0.20 | |||
| B1 | 0.03 | 3.1 | 66 | 0.62 | |||
| 0829046 | 1996.90 | 22.2 | A | 0.810.05 | 0.00.02 | 0.040.02 | |
| C1 | 0.210.03 | 0.120.03 | 1254 | 0.090.04 | |||
| C2 | 0.410.07 | 0.610.03 | 593 | 0.180.06 | |||
| B4 | 0.04 | 1.1 | 66 | 0.40 | |||
| B3 | 0.09 | 1.7 | 75 | 0.55 | |||
| B2 | 0.05 | 2.2 | 64 | 0.56 | |||
| B1 | 0.03 | 3.7 | 67 | 0.42 | |||
| 0829046 | 1997.58 | 22.2 | A | 0.610.08 | 0.00.04 | 0.060.04 | |
| C1 | 0.090.05 | 0.140.02 | 684 | 0.080.02 | |||
| C2 | 0.130.04 | 0.550.04 | 612 | 0.200.04 | |||
| B4 | 0.03 | 1.34 | 71 | 0.45 | |||
| B3 | 0.04 | 2.1 | 66 | 0.27 | |||
| B2 | 0.06 | 2.6 | 74 | 0.37 | |||
| B1 | 0.01 | 4.5 | 52 | 0.63 | |||
| 0836710 | 1996.15 | 22.2 | A | 1.320.02 | 0.00.03 | 0.100.03 | |
| B | 0.080.04 | 0.670.06 | 1345 | 0.290.03 | |||
| C2 | 0.04 | 2.7 | 142 | 0.38 | |||
| C3 | 0.02 | 3.2 | 146 | 0.10 | |||
| 0836710 | 1996.15 | 43.2 | A | 1.560.04 | 0.00.05 | 0.070.02 | |
| C1* | 0.02 | 0.38 | 125 | 0.01 | |||
| B2 | 0.02 | 0.67 | 125 | 0.12 | |||
| B1 | 0.02 | 0.82 | 145 | 0.02 | |||
| E1 | 0.02 | 1.85 | 135 | 0.09 | |||
| C2* | 0.02 | 2.9 | 143 | 0.03 | |||
| C3* | 0.02 | 3.4 | 142 | 0.11 | |||
| 0836710 | 1996.34 | 22.2 | A | 1.270.04 | 0.00.03 | 0.060.03 | |
| C1 | 0.220.03 | 0.230.05 | 1333 | 0.150.02 | |||
| B | 0.090.06 | 1.080.04 | 1433 | 0.390.05 | |||
| C2 | 0.02 | 2.3 | 143 | 0.37 | |||
| C3 | 0.03 | 2.8 | 143 | 0.33 | |||
| 0836710 | 1996.60 | 22.2 | A | 1.510.04 | 0.00.03 | 0.060.03 | |
| C1 | 0.160.05 | 0.220.04 | 1404 | 0.170.03 | |||
| B | 0.080.04 | 1.050.06 | 1335 | 0.320.04 | |||
| C2 | 0.02 | 2.1 | 153 | 0.32 | |||
| C3 | 0.03 | 2.8 | 142 | 0.34 | |||
| 0836710 | 1996.90 | 22.2 | A | 1.710.05 | 0.00.02 | 0.070.02 | |
| C1 | 0.150.04 | 0.180.05 | 1415 | 0.030.02 | |||
| B | 0.070.03 | 1.150.09 | 1336 | 0.350.05 | |||
| C2 | 0.01 | 2.0 | 156 | 0.02 | |||
| C3 | 0.05 | 2.7 | 141 | 0.51 | |||
| 0836710 | 1996.90 | 43.2 | A | 1.580.05 | 0.00.03 | 0.060.03 | |
| B3 | 0.160.04 | 0.150.05 | 1544 | 0.020.02 | |||
| C1* | 0.02 | 0.30 | 135 | 0.01 | |||
| B2 | 0.03 | 1.02 | 130 | 0.19 | |||
| B1 | 0.02 | 1.28 | 138 | 0.05 | |||
| E1 | 0.01 | 1.75 | 138 | 0.02 | |||
| C2* | 0.01 | 2.7 | 142 | 0.18 | |||
| C3* | 0.02 | 3.3 | 144 | 0.30 | |||
| 0836710 | 1997.58 | 22.2 | A | 2.020.03 | 0.00.02 | 0.130.04 | |
| C1 | 0.080.05 | 0.340.05 | 1376 | 0.240.04 | |||
| B | 0.060.04 | 1.260.08 | 1325 | 0.260.04 | |||
| C3 | 0.06 | 2.7 | 143 | 0.46 | |||
| 0851202 | 1995.01 | 22.2 | A | 1.140.04 | 0.00.03 | 0.030.01 | |
| E1 | 0.250.03 | 0.210.03 | 1004 | 0.140.04 | |||
| D1 | 0.130.04 | 0.690.06 | 895 | 0.310.04 | |||
| E2 | 0.210.04 | 1.220.06 | 943 | 0.590.04 | |||
| 0851202 | 1995.01 | 43.2 | A | 1.410.03 | 0.00.03 | 0.020.02 | |
| C1 | 0.140.03 | 0.230.03 | 874 | 0.170.03 | |||
| B1 | 0.08 | 0.61 | 86 | 0.22 | |||
| C2 | 0.06 | 1.13 | 91 | 0.28 | |||
| 0851202 | 1995.31 | 15.4 | A | 0.920.02 | 0.00.05 | 0.150.04 | |
| G1 | 0.110.04 | 0.330.04 | 924 | 0.010.01 | |||
| F1 | 0.01 | 0.88 | 108 | 0.01 | |||
| G2 | 0.290.04 | 1.130.04 | 903 | 0.550.04 | |||
| 0851202 | 1995.31 | 22.2 | A | 1.190.04 | 0.00.03 | 0.120.03 | |
| E1 | 0.190.05 | 0.290.04 | 913 | 0.010.01 | |||
| D1 | 0.090.02 | 0.950.08 | 935 | 0.310.04 | |||
| E2 | 0.240.04 | 1.220.05 | 914 | 0.530.03 | |||
| 0851202 | 1995.31 | 43.2 | A | 1.340.04 | 0.00.04 | 0.060.03 | |
| C1 | 0.280.05 | 0.240.03 | 975 | 0.130.04 | |||
| B1 | 0.03 | 0.75 | 90 | 0.09 | |||
| C2 | 0.210.03 | 1.140.06 | 925 | 0.440.05 | |||
| C3 | 0.02 | 1.40 | 92 | 0.31 | |||
| 0851202 | 1995.47 | 15.4 | A | 1.170.05 | 0.00.05 | 0.130.04 | |
| G1 | 0.05 | 0.40 | 86 | 0.01 | |||
| F1 | 0.02 | 0.98 | 124 | 0.01 | |||
| G2 | 0.320.02 | 1.130.05 | 923 | 0.580.03 | |||
| 0851202 | 1995.47 | 22.2 | A | 1.260.04 | 0.00.04 | 0.060.03 | |
| E1 | 0.07 | 0.33 | 80 | 0.06 | |||
| D1 | 0.02 | 0.86 | 90 | 0.01 | |||
| E2 | 0.240.03 | 1.150.05 | 894 | 0.500.03 | |||
| 0851202 | 1995.47 | 43.2 | A | 1.600.06 | 0.00.03 | 0.050.02 | |
| C1 | 0.08 | 0.30 | 116 | 0.01 | |||
| B1 | 0.09 | 1.03 | 95 | 0.09 | |||
| C2 | 0.06 | 1.15 | 98 | 0.16 | |||
| 0851202 | 1995.79 | 43.2 | A | 3.190.08 | 0.00.05 | 0.040.03 | |
| C1 | 0.760.07 | 0.280.05 | 855 | 0.010.01 | |||
| B1+C2 | 0.120.04 | 1.290.10 | 905 | 0.220.04 | |||
| 0851202 | 1996.34 | 43.2 | A | 1.280.03 | 0.00.02 | 0.050.02 | |
| C1 | 0.06 | 0.21 | 111 | 0.01 | |||
| B2 | 0.280.04 | 0.360.04 | 993 | 0.400.03 | |||
| C2 | 0.03 | 1.09 | 97 | 0.25 | |||
| 0851202 | 1996.90 | 43.2 | A | 1.210.03 | 0.00.02 | 0.030.01 | |
| B3 | 0.200.02 | 0.110.04 | 913 | 0.050.02 | |||
| C1 | 0.150.03 | 0.210.04 | 1134 | 0.070.03 | |||
| B2 | 0.07 | 0.72 | 98 | 0.39 | |||
| C2 | 0.100.03 | 1.190.08 | 934 | 0.350.04 | |||
| 0851202 | 1997.58 | 43.2 | A | 1.450.04 | 0.00.03 | 0.050.02 | |
| C1 | 0.230.04 | 0.190.03 | 1194 | 0.050.02 | |||
| B3 | 0.05 | 0.40 | 114 | 0.27 | |||
| B2 | 0.06 | 1.03 | 106 | 0.18 | |||
| C2 | 0.090.03 | 1.380.09 | 935 | 0.490.05 | |||
| 0917449 | 1995.01 | 22.2 | A | 1.220.03 | 0.00.04 | 0.040.02 | |
| B | 0.09 | 0.62 | 177 | 0.23 | |||
| C1 | 0.04 | 0.78 | 151 | 0.12 | |||
| C2 | 0.100.05 | 1.480.07 | 1795 | 0.370.05 | |||
| 0917449 | 1996.60 | 22.2 | A | 1.080.05 | 0.00.04 | 0.050.03 | |
| B | 0.08 | 0.85 | 177 | 0.09 | |||
| C1 | 0.120.05 | 0.710.08 | 1666 | 0.250.04 | |||
| C2 | 0.190.03 | 1.490.06 | 1784 | 0.490.03 | |||
| 0917449 | 1996.90 | 22.2 | A | 0.830.05 | 0.00.03 | 0.050.03 | |
| B | 0.120.04 | 0.920.08 | 1785 | 0.150.02 | |||
| C1 | 0.090.03 | 0.610.07 | 1614 | 0.200.03 | |||
| C2 | 0.110.06 | 1.470.06 | 1745 | 0.440.05 | |||
| 0917449 | 1997.58 | 22.2 | A | 1.040.04 | 0.00.04 | 0.070.03 | |
| B | 0.120.05 | 0.990.07 | 1775 | 0.170.04 | |||
| C1 | 0.06 | 0.83 | 162 | 0.35 | |||
| C2 | 0.120.06 | 1.530.08 | 1746 | 0.400.03 | |||
| 0954658 | 1995.15 | 22.2 | A | 0.440.05 | 0.00.03 | 0.050.03 | |
| C1 | 0.05 | 0.41 | 17 | 0.14 | |||
| C2 | 0.05 | 0.91 | 22 | 0.40 | |||
| C3 | 0.02 | 2.17 | 74 | 0.53 | |||
| 0954658 | 1995.31 | 22.2 | A | 0.580.04 | 0.00.04 | 0.010.01 | |
| C1 | 0.05 | 0.38 | 19 | 0.17 | |||
| C2 | 0.03 | 0.92 | 17 | 0.10 | |||
| D1 | 0.03 | 1.12 | 31 | 0.48 | |||
| C3 | 0.02 | 2.29 | 66 | 0.36 | |||
| 0954658 | 1996.34 | 22.2 | A | 0.530.05 | 0.00.04 | 0.100.04 | |
| C1 | 0.170.06 | 0.300.08 | 304 | 0.140.04 | |||
| C2 | 0.08 | 0.86 | 20 | 0.42 | |||
| D2 | 0.02 | 1.02 | 28 | 0.35 | |||
| C3 | 0.02 | 2.07 | 56 | 0.58 | |||
| 1127145 | 1996.60 | 22.2 | A | 0.880.05 | 0.00.04 | 0.110.03 | |
| B2 | 0.190.04 | 0.550.07 | 753 | 0.300.06 | |||
| D1 | 0.04 | 1.09 | 85 | 0.37 | |||
| C1 | 0.03 | 2.19 | 76 | 0.22 | |||
| B1 | 0.02 | 2.78 | 84 | 0.17 | |||
| C2 | 0.290.05 | 4.080.11 | 844 | 0.630.15 | |||
| E1 | 0.02 | 5.25 | 93 | 0.10 | |||
| 1127145 | 1996.90 | 22.2 | A | 1.120.03 | 0.00.03 | 0.170.05 | |
| B2 | 0.230.04 | 0.580.05 | 864 | 0.270.04 | |||
| D1 | 0.01 | 1.41 | 90 | 0.35 | |||
| C1 | 0.03 | 2.15 | 76 | 0.23 | |||
| B1 | 0.03 | 3.09 | 81 | 0.43 | |||
| C2 | 0.380.04 | 4.090.10 | 835 | 0.660.08 | |||
| E1 | 0.02 | 5.34 | 91 | 0.15 | |||
| 1127145 | 1997.58 | 22.2 | A | 1.180.06 | 0.00.05 | 0.140.05 | |
| B3 | 0.510.06 | 0.370.04 | 923 | 0.210.03 | |||
| B2 | 0.130.05 | 0.800.06 | 965 | 0.310.05 | |||
| C1 | 0.02 | 2.28 | 79 | 0.25 | |||
| D2 | 0.01 | 2.72 | 86 | 0.12 | |||
| B1 | 0.01 | 3.32 | 85 | 0.19 | |||
| C2 | 0.510.05 | 4.210.08 | 834 | 0.710.10 | |||
| E1 | 0.02 | 5.26 | 89 | 0.23 | |||
| E2 | 0.02 | 5.63 | 72 | 0.43 | |||
| 1156295 | 1995.31 | 22.2 | A | 1.370.05 | 0.00.04 | 0.020.02 | |
| B1 | 0.370.04 | 0.260.04 | 223 | 0.180.04 | |||
| C | 0.03 | 0.59 | 2 | 0.08 | |||
| D1 | 0.05 | 2.8 | 1 | 1.6 | |||
| 1156295 | 1996.34 | 22.2 | A | 1.940.04 | 0.00.03 | 0.050.03 | |
| B2 | 0.450.06 | 0.380.05 | 264 | 0.200.04 | |||
| C | 0.09 | 0.70 | 14 | 0.41 | |||
| D1 | 0.04 | 3.9 | 1 | 1.4 | |||
| 1156295 | 1996.60 | 22.2 | A | 1.630.04 | 0.00.04 | 0.080.04 | |
| B3 | 0.340.05 | 0.200.04 | 194 | 0.130.03 | |||
| B2 | 0.260.04 | 0.440.04 | 233 | 0.160.03 | |||
| C | 0.06 | 0.74 | 11 | 0.27 | |||
| D1 | 0.03 | 3.9 | 3 | 1.1 | |||
| 1156295 | 1996.90 | 22.2 | A | 1.350.05 | 0.00.05 | 0.030.02 | |
| B3 | 0.350.04 | 0.280.06 | 224 | 0.080.04 | |||
| B2 | 0.320.06 | 0.500.08 | 175 | 0.170.04 | |||
| C | 0.08 | 0.74 | 11 | 0.27 | |||
| D1 | 0.05 | 3.9 | 0 | 1.9 | |||
| 1156295 | 1997.58 | 22.2 | A | 0.570.06 | 0.00.05 | 0.050.04 | |
| B2 | 0.070.04 | 0.790.08 | 215 | 0.240.05 | |||
| C+B3 | 0.210.05 | 0.710.06 | 93 | 0.370.06 | |||
| D1 | 0.03 | 4.1 | 2 | 1.5 | |||
| 1219285 | 1995.31 | 22.2 | A | 0.220.04 | 0.00.05 | 0.070.03 | |
| B3 | 0.05 | 0.49 | 98 | 0.31 | |||
| B2 | 0.01 | 1.63 | 96 | 0.19 | |||
| B1 | 0.02 | 2.33 | 114 | 0.30 | |||
| 1219285 | 1996.90 | 22.2 | A | 0.270.05 | 0.00.05 | 0.130.04 | |
| B9 | 0.03 | 0.32 | 106 | 0.07 | |||
| B8 | 0.05 | 1.08 | 102 | 0.34 | |||
| B7 | 0.06 | 1.74 | 98 | 0.20 | |||
| B6 | 0.03 | 2.36 | 112 | 0.45 | |||
| B5 | 0.02 | 3.00 | 110 | 0.23 | |||
| 1219285 | 1997.58 | 22.2 | A | 0.300.05 | 0.00.05 | 0.070.03 | |
| B9 | 0.03 | 0.45 | 97 | 0.13 | |||
| B8 | 0.04 | 1.19 | 106 | 0.31 | |||
| B7 | 0.090.03 | 2.150.08 | 1004 | 0.280.06 | |||
| B6 | 0.02 | 2.71 | 111 | 0.56 | |||
| B5 | 0.01 | 3.50 | 92 | 0.33 | |||
| B4 | 0.02 | 4.42 | 107 | 0.38 | |||
| 1222216 | 1996.90 | 22.2 | A | 1.160.05 | 0.00.04 | 0.060.03 | |
| B2 | 0.220.06 | 0.530.07 | 153 | 0.110.03 | |||
| B1 | 0.100.04 | 1.890.09 | 52 | 0.270.04 | |||
| D1 | 0.01 | 3.25 | 3 | 0.63 | |||
| D2 | 0.03 | 4.7 | 4 | 1.1 | |||
| 1222216 | 1997.58 | 22.2 | A | 0.760.06 | 0.00.05 | 0.060.04 | |
| B3 | 0.090.04 | 0.450.05 | 73 | 0.160.05 | |||
| B2 | 0.210.05 | 1.130.08 | 132 | 0.230.04 | |||
| B1 | 0.110.05 | 2.230.06 | 42 | 0.350.03 | |||
| D3 | 0.03 | 4.8 | 4 | 1.8 | |||
| 1226023 | 1993.86 | 8.4 | A | 19.80.3 | 0.00.1 | 0.9 0.2 | |
| J1 | 4.680.25 | 0.850.09 | 574 | 0.100.04 | |||
| H6 | 7.560.32 | 1.120.13 | 1023 | 1.00.15 | |||
| H5 | 1.630.20 | 4.430.45 | 1206 | 2.10.4 | |||
| H4 | 1.160.12 | 7.020.70 | 1218 | 0.30.2 | |||
| H3 | 3.070.18 | 7.840.65 | 1255 | 2.00.3 | |||
| H2 | 0.45 | 12.8 | 124 | 0.7 | |||
| H1 | 0.75 | 15.5 | 122 | 1.0 | |||
| 1226023 | 1993.86 | 22.2 | A | 14.60.5 | 0.00.06 | 0.22 0.04 | |
| B3 | 6.380.17 | 0.800.07 | 1215 | 0.500.12 | |||
| B2 | 2.780.24 | 1.470.21 | 1094 | 0.350.07 | |||
| B1 | 1.690.22 | 2.200.25 | 1084 | 0.340.05 | |||
| 1226023 | 1994.45 | 8.4 | A | 12.90.25 | 0.00.1 | 0.15 0.05 | |
| K8 | 5.410.40 | 0.610.15 | 1236 | 0.050.04 | |||
| K7 | 8.220.24 | 1.610.20 | 1145 | 0.870.08 | |||
| K6 | 1.260.15 | 6.610.40 | 1114 | 0.30.1 | |||
| K5 | 1.150.12 | 8.340.57 | 1114 | 0.180.07 | |||
| K4 | 1.020.18 | 10.70.75 | 945 | 0.150.06 | |||
| K3 | 1.320.28 | 11.20.75 | 1126 | 0.30.2 | |||
| K2 | 1.450.25 | 15.90.90 | 1128 | 1.20.3 | |||
| K1 | 1.690.20 | 16.31.0 | 1104 | 1.10.1 | |||
| 1226023 | 1994.45 | 22.2 | A | 3.230.15 | 0.00.07 | 0.19 0.06 | |
| B5 | 5.060.28 | 0.360.10 | 1418 | 0.290.07 | |||
| B4 | 6.050.25 | 0.690.06 | 1375 | 0.220.05 | |||
| B3 | 1.230.18 | 1.220.12 | 1275 | 0.360.08 | |||
| B2 | 0.490.12 | 1.780.15 | 1046 | 0.210.05 | |||
| B1 | 2.380.24 | 2.630.20 | 1105 | 0.670.12 | |||
| D1 | 0.480.22 | 6.330.45 | 1128 | 0.760.15 | |||
| 1226023 | 1995.01 | 22.2 | A | 9.680.32 | 0.00.07 | 0.20 0.06 | |
| B5 | 4.660.12 | 0.440.15 | 1154 | 0.220.05 | |||
| B4 | 7.200.15 | 1.060.08 | 1154 | 0.530.07 | |||
| B3 | 1.220.25 | 1.960.25 | 1127 | 0.480.08 | |||
| B2 | 0.75 | 2.4 | 110 | 0.25 | |||
| B1 | 2.100.15 | 3.200.18 | 1095 | 0.430.06 | |||
| D2 | 2.000.30 | 8.400.45 | 1208 | 1.090.15 | |||
| 1226023 | 1995.01 | 43.2 | A | 8.890.25 | 0.00.05 | 0.190.05 | |
| E3 | 2.170.24 | 0.380.10 | 1085 | 0.100.04 | |||
| E2 | 1.680.33 | 0.630.15 | 1287 | 0.100.06 | |||
| E1 | 3.190.28 | 1.180.13 | 1164 | 0.270.05 | |||
| G1 | 1.240.40 | 3.150.25 | 1106 | 0.710.10 | |||
| 1226023 | 1995.15 | 22.2 | A | 7.110.20 | 0.00.05 | 0.38 0.07 | |
| B5 | 4.530.15 | 0.510.09 | 1205 | 0.410.08 | |||
| B4 | 4.030.26 | 1.190.10 | 1185 | 0.430.07 | |||
| B3 | 0.53 | 2.28 | 102 | 0.30 | |||
| B2 | 0.40 | 2.50 | 100 | 0.15 | |||
| B1 | 2.300.18 | 3.120.25 | 1027 | 0.870.15 | |||
| D2 | 1.560.22 | 8.450.50 | 1218 | 1.130.15 | |||
| 1226023 | 1995.15 | 43.2 | A | 7.190.15 | 0.00.05 | 0.08 0.04 | |
| E3 | 3.710.20 | 0.350.05 | 1286 | 0.050.03 | |||
| E2 | 3.050.17 | 0.680.09 | 1205 | 0.130.04 | |||
| E1 | 3.580.15 | 1.100.10 | 1205 | 0.390.04 | |||
| F | 0.43 | 1.4 | 120 | 0.10 | |||
| G1 | 1.750.26 | 3.320.16 | 1117 | 0.800.15 | |||
| 1253055 | 1993.86 | 8.4 | A | 6.930.48 | 0.00.08 | 0.200.08 | |
| G | 2.140.32 | 0.960.18 | 1128 | 0.890.24 | |||
| D | 3.020.25 | 2.150.23 | 1206 | 0.570.10 | |||
| 1253055 | 1993.86 | 22.2 | A | 8.620.15 | 0.00.07 | 0.00 0.03 | |
| E2 | 6.750.24 | 0.110.08 | 1519 | 0.250.07 | |||
| F | 0.700.12 | 1.250.10 | 1155 | 0.470.06 | |||
| D | 2.380.15 | 2.420.15 | 1154 | 0.490.07 | |||
| 1253055 | 1994.45 | 8.4 | A | 9.520.25 | 0.00.10 | 0.300.10 | |
| G | 1.640.20 | 0.890.22 | 1229 | 0.860.20 | |||
| J | 0.820.15 | 1.460.15 | 636 | 0.440.12 | |||
| D | 4.110.30 | 2.220.16 | 1168 | 0.650.10 | |||
| 1253055 | 1994.45 | 22.2 | A | 12.20.20 | 0.00.05 | 0.10 0.04 | |
| E2 | 2.480.13 | 0.190.06 | 1245 | 0.190.05 | |||
| E1 | 0.700.15 | 0.720.10 | 1326 | 0.420.07 | |||
| F | 0.30 | 1.37 | 118 | 0.28 | |||
| D | 1.860.10 | 2.430.10 | 1175 | 0.460.05 | |||
| 1253055 | 1995.01 | 22.2 | A | 11.10.15 | 0.00.04 | 0.12 0.04 | |
| E2 | 2.480.21 | 0.370.08 | 1305 | 0.140.04 | |||
| E1 | 0.13 | 0.69 | 109 | 0.03 | |||
| D | 2.010.13 | 2.510.14 | 1165 | 0.510.06 | |||
| 1253055 | 1995.01 | 43.2 | A | 12.40.23 | 0.00.04 | 0.08 0.03 | |
| B2 | 1.020.16 | 0.180.07 | 1296 | 0.000.04 | |||
| B1 | 1.480.12 | 0.500.06 | 1265 | 0.190.05 | |||
| C | 0.12 | 1.38 | 130 | 0.00 | |||
| D | 1.160.10 | 2.560.12 | 1165 | 0.400.05 | |||
| 1253055 | 1995.15 | 22.2 | A | 8.790.18 | 0.00.04 | 0.12 0.05 | |
| E2 | 1.120.15 | 0.390.07 | 1314 | 0.150.04 | |||
| E1 | 1.100.18 | 0.670.10 | 1305 | 0.350.07 | |||
| F | 0.39 | 1.25 | 132 | 0.44 | |||
| D | 1.610.12 | 2.580.15 | 1165 | 0.390.05 | |||
| 1253055 | 1995.15 | 43.2 | A | 18.70.25 | 0.00.04 | 0.05 0.03 | |
| B1 | 2.420.15 | 0.450.06 | 1315 | 0.070.03 | |||
| b | 0.35 | 0.78 | 121 | 0.07 | |||
| C | 0.44 | 1.21 | 126 | 0.21 | |||
| D | 1.660.13 | 2.610.13 | 1166 | 0.520.08 | |||
| 1253055 | 1996.34 | 43.2 | A | 16.90.17 | 0.00.04 | 0.06 0.03 | |
| B3 | 5.300.25 | 0.130.08 | 1297 | 0.100.04 | |||
| B2 | 1.190.10 | 0.310.07 | 1205 | 0.170.05 | |||
| B1 | 0.12 | 0.77 | 137 | 0.23 | |||
| C | 0.18 | 1.19 | 126 | 0.11 | |||
| D | 1.320.15 | 3.010.15 | 1145 | 0.360.05 | |||
| 1253055 | 1996.60 | 43.2 | A | 14.00.22 | 0.00.05 | 0.08 0.04 | |
| B3 | 8.100.33 | 0.160.06 | 1356 | 0.220.06 | |||
| B2 | 0.700.25 | 0.450.08 | 1449 | 0.010.04 | |||
| B1 | 0.24 | 0.83 | 129 | 0.13 | |||
| C | 0.20 | 1.12 | 121 | 0.00 | |||
| D | 1.190.13 | 3.130.18 | 1154 | 0.230.06 | |||
| 1253055 | 1996.90 | 43.2 | A | 7.940.32 | 0.00.06 | 0.07 0.05 | |
| B3 | 6.160.35 | 0.200.08 | 1307 | 0.200.06 | |||
| B2 | 0.30 | 0.44 | 137 | 0.01 | |||
| C | 0.12 | 1.12 | 120 | 0.00 | |||
| D | 1.180.15 | 3.170.14 | 1155 | 0.220.07 | |||
| 1253055 | 1997.58 | 43.2 | A | 12.70.25 | 0.00.04 | 0.09 0.03 | |
| B3 | 7.550.21 | 0.350.06 | 1344 | 0.210.04 | |||
| B2 | 0.09 | 0.62 | 138 | 0.11 | |||
| C | 0.05 | 1.19 | 119 | 0.00 | |||
| D | 1.700.10 | 3.350.12 | 1144 | 0.190.06 | |||
| 1406076 | 1994.76 | 22.2 | A | 0.950.08 | 0.00.04 | 0.090.03 | |
| B2 | 0.06 | 0.23 | 80 | 0.03 | |||
| B1 | 0.03 | 0.76 | 105 | 0.21 | |||
| 1406076 | 1995.79 | 22.2 | A | 0.670.06 | 0.00.05 | 0.020.02 | |
| B3 | 0.160.05 | 0.150.06 | 546 | 0.160.05 | |||
| 1406076 | 1996.34 | 22.2 | A | 0.700.05 | 0.00.05 | 0.070.03 | |
| B4 | 0.130.06 | 0.180.04 | 1065 | 0.010.03 | |||
| B3 | 0.04 | 0.41 | 84 | 0.27 | |||
| 1406076 | 1996.60 | 22.2 | A | 0.860.07 | 0.00.05 | 0.090.03 | |
| B4 | 0.110.05 | 0.260.05 | 1094 | 0.130.04 | |||
| B3 | 0.02 | 0.56 | 86 | 0.24 | |||
| 1406076 | 1996.90 | 22.2 | A | 0.920.06 | 0.00.04 | 0.100.05 | |
| B4 | 0.090.05 | 0.310.06 | 757 | 0.140.04 | |||
| B3 | 0.03 | 0.73 | 141 | 0.32 | |||
| 1406076 | 1997.58 | 22.2 | A | 0.900.08 | 0.00.04 | 0.080.04 | |
| B4 | 0.080.03 | 0.680.06 | 1034 | 0.150.05 | |||
| B3 | 0.01 | 1.28 | 114 | 0.41 | |||
| 1510089 | 1995.79 | 43.2 | A | 1.110.06 | 0.00.04 | 0.040.02 | |
| C | 0.03 | 0.57 | 34 | 0.01 | |||
| D2 | 0.260.05 | 1.000.06 | 256 | 0.480.07 | |||
| D1 | 0.02 | 1.13 | 29 | 0.05 | |||
| 1510089 | 1996.34 | 43.2 | A | 1.920.05 | 0.00.04 | 0.060.03 | |
| B1 | 0.300.04 | 0.140.05 | 355 | 0.090.04 | |||
| C | 0.01 | 0.49 | 32 | 0.18 | |||
| D1 | 0.07 | 1.28 | 40 | 0.19 | |||
| D2 | 0.170.06 | 1.450.09 | 247 | 0.500.06 | |||
| 1510089 | 1996.60 | 43.2 | A | 1.120.05 | 0.00.03 | 0.060.03 | |
| B1 | 0.160.06 | 0.220.04 | 424 | 0.040.02 | |||
| C | 0.02 | 0.54 | 31 | 0.17 | |||
| D1 | 0.05 | 1.20 | 38 | 0.21 | |||
| D2 | 0.130.05 | 1.610.08 | 276 | 0.390.05 | |||
| 1510089 | 1996.90 | 43.2 | A | 0.630.04 | 0.00.03 | 0.060.03 | |
| C+B1 | 0.04 | 0.63 | 33 | 0.01 | |||
| D1 | 0.01 | 1.50 | 33 | 0.01 | |||
| D2 | 0.03 | 1.67 | 10 | 0.52 | |||
| 1510089 | 1997.58 | 43.2 | A | 2.510.05 | 0.00.04 | 0.060.02 | |
| B2 | 0.280.04 | 0.220.06 | 206 | 0.040.03 | |||
| C | 0.02 | 0.58 | 48 | 0.04 | |||
| B1 | 0.03 | 0.75 | 42 | 0.27 | |||
| 1606106 | 1994.76 | 22.2 | A | 0.830.06 | 0.00.05 | 0.090.04 | |
| C1 | 0.110.05 | 0.300.06 | 695 | 0.250.05 | |||
| C2 | 0.04 | 0.99 | 75 | 0.32 | |||
| C3 | 0.02 | 1.93 | 45 | 0.29 | |||
| 1606106 | 1996.34 | 22.2 | A | 0.920.05 | 0.00.04 | 0.090.05 | |
| C1 | 0.240.06 | 0.430.05 | 704 | 0.340.04 | |||
| C2 | 0.01 | 0.92 | 84 | 0.02 | |||
| C3 | 0.09 | 1.41 | 54 | 0.56 | |||
| 1606106 | 1996.90 | 22.2 | A | 1.200.06 | 0.00.04 | 0.060.03 | |
| C1 | 0.160.04 | 0.440.05 | 694 | 0.510.07 | |||
| C2 | 0.01 | 1.00 | 43 | 0.10 | |||
| C3 | 0.06 | 1.45 | 60 | 0.40 | |||
| 1606106 | 1997.58 | 22.2 | A | 1.220.05 | 0.00.06 | 0.080.04 | |
| C1 | 0.320.07 | 0.290.05 | 546 | 0.380.06 | |||
| C2 | 0.02 | 0.88 | 69 | 0.01 | |||
| C3 | 0.02 | 1.41 | 60 | 0.49 | |||
| 1611343 | 1994.76 | 22.2 | A | 2.860.07 | 0.00.05 | 0.040.02 | |
| C1 | 0.400.06 | 0.260.08 | 1665 | 0.120.04 | |||
| B3 | 0.110.05 | 1.410.10 | 1778 | 0.220.05 | |||
| C2 | 0.530.08 | 2.970.25 | 1717 | 1.1 0.15 | |||
| 1611343 | 1995.15 | 22.2 | A | 3.310.06 | 0.00.04 | 0.060.03 | |
| C1 | 0.450.05 | 0.270.06 | 1655 | 0.110.04 | |||
| B3 | 0.11 | 1.97 | 179 | 0.32 | |||
| C2 | 0.230.06 | 2.760.18 | 1796 | 0.760.08 | |||
| B2 | 0.260.07 | 2.970.20 | 1676 | 0.770.09 | |||
| B1 | 0.130.05 | 3.490.15 | 1557 | 1.460.15 | |||
| 1611343 | 1995.31 | 22.2 | A | 3.450.05 | 0.00.04 | 0.070.03 | |
| C1 | 0.320.05 | 0.230.10 | 1616 | 0.110.03 | |||
| B3 | 0.14 | 2.00 | 178 | 0.36 | |||
| C2 | 0.260.04 | 2.780.18 | 1785 | 0.630.07 | |||
| B2 | 0.200.06 | 2.990.20 | 1615 | 0.690.09 | |||
| B1 | 0.07 | 3.16 | 169 | 0.27 | |||
| 1611343 | 1996.34 | 22.2 | A | 2.900.06 | 0.00.05 | 0.090.04 | |
| C1 | 0.140.04 | 0.380.05 | 1704 | 0.010.02 | |||
| B3 | 0.12 | 2.30 | 179 | 0.43 | |||
| C2 | 0.300.05 | 2.790.15 | 1795 | 0.850.07 | |||
| B2 | 0.240.06 | 3.170.15 | 1666 | 0.720.06 | |||
| B1 | 0.200.05 | 3.400.20 | 1565 | 0.800.09 | |||
| 1611343 | 1996.60 | 22.2 | A | 2.670.05 | 0.00.05 | 0.060.03 | |
| C1 | 0.270.05 | 0.300.06 | 1695 | 0.140.03 | |||
| C2 | 0.250.06 | 2.740.15 | 1794 | 0.690.06 | |||
| B2 | 0.360.06 | 3.210.15 | 1664 | 0.890.05 | |||
| B1 | 0.100.05 | 3.610.15 | 1507 | 0.870.08 | |||
| 1611343 | 1996.90 | 22.2 | A | 2.670.05 | 0.00.04 | 0.050.03 | |
| C1 | 0.200.05 | 0.250.09 | 1706 | 0.090.04 | |||
| B4 | 0.10 | 0.85 | 154 | 0.01 | |||
| C2 | 0.240.06 | 2.780.15 | 1785 | 0.590.06 | |||
| B2 | 0.430.08 | 3.240.15 | 1667 | 1.00.09 | |||
| B1 | 0.100.05 | 3.840.20 | 1487 | 0.880.09 | |||
| 1611343 | 1997.32 | 15.4 | A | 2.410.06 | 0.00.06 | 0.060.04 | |
| F1 | 0.110.05 | 0.430.06 | 1646 | 0.220.06 | |||
| F2 | 0.090.04 | 1.480.15 | 1765 | 0.420.07 | |||
| F3 | 0.440.08 | 2.830.18 | 1786 | 0.790.08 | |||
| G1 | 0.450.07 | 3.430.20 | 1626 | 1.270.12 | |||
| 1611343 | 1997.32 | 22.2 | A | 2.160.05 | 0.00.04 | 0.050.03 | |
| C1 | 0.240.04 | 0.210.08 | 1685 | 0.110.04 | |||
| B4 | 0.10 | 1.26 | 176 | 0.25 | |||
| C2 | 0.290.06 | 2.830.10 | 1784 | 0.690.05 | |||
| B2 | 0.190.05 | 3.460.13 | 1675 | 0.970.06 | |||
| B1 | 0.110.06 | 3.710.20 | 1576 | 0.900.08 | |||
| 1611343 | 1997.32 | 43.2 | A | 1.650.06 | 0.00.04 | 0.070.03 | |
| E1 | 0.250.06 | 0.160.05 | 1694 | 0.110.04 | |||
| E2 | 0.05 | 0.61 | 154 | 0.22 | |||
| E3 | 0.04 | 1.45 | 176 | 0.59 | |||
| E4 | 0.04 | 2.31 | 179 | 0.25 | |||
| E5 | 0.07 | 2.94 | 176 | 0.31 | |||
| D1 | 0.08 | 3.29 | 166 | 0.75 | |||
| 1611343 | 1997.58 | 22.2 | A | 2.820.06 | 0.00.05 | 0.100.04 | |
| C1 | 0.130.04 | 0.460.09 | 1586 | 0.190.05 | |||
| B4 | 0.09 | 1.33 | 174 | 0.28 | |||
| C2 | 0.420.05 | 2.890.10 | 1764 | 0.650.05 | |||
| B2 | 0.140.06 | 3.440.15 | 1606 | 0.420.06 | |||
| B1 | 0.090.05 | 3.860.20 | 1476 | 0.960.09 | |||
| 1611343 | 1997.62 | 15.4 | A | 2.790.08 | 0.00.06 | 0.100.05 | |
| F1 | 0.110.05 | 0.420.06 | 1577 | 0.010.02 | |||
| F2 | 0.090.05 | 1.750.10 | 1765 | 0.430.07 | |||
| F3 | 0.540.08 | 2.980.15 | 1765 | 0.950.06 | |||
| G1 | 0.310.08 | 3.590.15 | 1586 | 1.120.10 | |||
| 1611343 | 1997.62 | 22.2 | A | 2.010.05 | 0.00.04 | 0.070.04 | |
| C1 | 0.580.06 | 0.150.10 | 1556 | 0.110.03 | |||
| B4 | 0.06 | 1.20 | 177 | 0.11 | |||
| C2 | 0.260.08 | 2.940.12 | 1746 | 0.350.05 | |||
| B2 | 0.330.06 | 3.450.15 | 1656 | 1.170.13 | |||
| B1 | 0.02 | 4.08 | 147 | 0.17 | |||
| 1611343 | 1997.62 | 43.2 | A | 1.270.05 | 0.00.04 | 0.090.04 | |
| E1 | 0.620.05 | 0.130.06 | 1506 | 0.090.04 | |||
| E2 | 0.04 | 0.59 | 157 | 0.22 | |||
| E3 | 0.01 | 1.40 | 173 | 0.01 | |||
| E4 | 0.02 | 2.23 | 178 | 0.16 | |||
| E5 | 0.160.06 | 2.970.15 | 1786 | 0.630.08 | |||
| D1 | 0.130.05 | 3.400.15 | 1635 | 1.000.10 | |||
| 1622253 | 1996.60 | 22.2 | A | 0.810.05 | 0.00.06 | 0.130.04 | |
| B | 0.11 | 0.38 | 71 | 0.14 | |||
| D1 | 0.01 | 1.56 | 1 | 0.46 | |||
| 1622253 | 1996.90 | 22.2 | A | 0.600.06 | 0.00.05 | 0.070.03 | |
| B | 0.10 | 0.41 | 59 | 0.27 | |||
| D2 | 0.02 | 1.69 | 4 | 0.30 | |||
| 1622253 | 1997.58 | 22.2 | A | 3.340.04 | 0.00.04 | 0.080.04 | |
| B | 0.05 | 0.85 | 49 | 0.06 | |||
| D3 | 0.08 | 1.11 | 4 | 1.58 | |||
| 1622297 | 1995.57 | 15.4 | A | 0.480.10 | 0.00.08 | 0.00 | |
| E2 | 0.470.09 | 0.370.08 | 478 | 0.380.07 | |||
| E1 | 0.09 | 0.76 | 110 | 0.21 | |||
| F2 | 0.03 | 2.42 | 84 | 1.9 | |||
| F1 | 0.07 | 4.8 | 76 | 1.6 | |||
| G | 0.02 | 15.4 | 68 | 1.5 | |||
| 1622297 | 1995.79 | 43.2 | A | 1.900.05 | 0.00.04 | 0.080.03 | |
| B1 | 0.110.05 | 0.530.05 | 505 | 0.060.03 | |||
| 1622297 | 1996.34 | 15.4 | A | 2.210.08 | 0.00.06 | 0.170.05 | |
| E2 | 0.150.06 | 0.680.09 | 456 | 0.320.06 | |||
| E1 | 0.12 | 1.14 | 106 | 0.58 | |||
| F2 | 0.03 | 2.94 | 99 | 1.6 | |||
| F1 | 0.08 | 5.0 | 75 | 1.9 | |||
| G | 0.03 | 15.4 | 69 | 1.7 | |||
| 1622297 | 1996.34 | 22.2 | A | 1.230.04 | 0.00.04 | 0.170.05 | |
| D2 | 0.390.05 | 0.160.04 | 575 | 0.080.04 | |||
| D1 | 0.130.04 | 0.700.06 | 974 | 0.520.06 | |||
| 1622297 | 1996.34 | 43.2 | A | 1.680.06 | 0.00.04 | 0.050.03 | |
| B2 | 0.830.08 | 0.190.04 | 643 | 0.080.03 | |||
| B1 | 0.06 | 0.83 | 50 | 0.16 | |||
| 1622297 | 1996.76 | 15.4 | A | 1.380.10 | 0.00.08 | 0.00 | |
| E3 | 0.700.08 | 0.200.08 | 678 | 0.310.06 | |||
| E2 | 0.08 | 0.85 | 59 | 0.53 | |||
| E1 | 0.04 | 1.20 | 111 | 0.41 | |||
| F2 | 0.01 | 2.50 | 93 | 0.66 | |||
| F1 | 0.07 | 5.1 | 75 | 1.6 | |||
| G | 0.02 | 15.45 | 70 | 1.2 | |||
| 1622297 | 1996.76 | 22.2 | A | 1.790.06 | 0.00.05 | 0.100.04 | |
| D2 | 0.610.05 | 0.240.06 | 634 | 0.230.05 | |||
| D1 | 0.05 | 0.89 | 95 | 0.45 | |||
| 1622297 | 1996.76 | 43.2 | A | 2.760.05 | 0.00.04 | 0.070.02 | |
| B2 | 0.310.06 | 0.240.05 | 784 | 0.130.04 | |||
| 1622297 | 1997.19 | 15.4 | A | 2.310.08 | 0.00.06 | 0.100.04 | |
| E3 | 0.710.06 | 0.310.09 | 815 | 0.000.02 | |||
| E2 | 0.01 | 0.99 | 121 | 0.00 | |||
| E1 | 0.07 | 1.29 | 88 | 0.00 | |||
| F2 | 0.02 | 3.26 | 87 | 1.2 | |||
| F1 | 0.05 | 5.3 | 74 | 1.5 | |||
| G | 0.03 | 15.5 | 69 | 1.8 | |||
| 1622297 | 1997.19 | 22.2 | A | 2.880.07 | 0.00.05 | 0.060.03 | |
| D2 | 0.690.06 | 0.270.05 | 694 | 0.280.05 | |||
| D1 | 0.08 | 0.91 | 66 | 0.21 | |||
| 1622297 | 1997.19 | 43.2 | A | 3.080.05 | 0.00.04 | 0.050.03 | |
| B2 | 0.290.04 | 0.500.06 | 446 | 0.180.05 | |||
| 1622297 | 1997.58 | 22.2 | A | 1.260.06 | 0.00.05 | 0.110.04 | |
| D2 | 0.560.05 | 0.320.06 | 725 | 0.370.06 | |||
| 1633382 | 1994.76 | 22.2 | A | 1.450.04 | 0.00.03 | 0.070.03 | |
| B2 | 0.210.06 | 0.560.05 | 903 | 0.370.05 | |||
| B1 | 0.250.04 | 1.090.04 | 874 | 0.390.03 | |||
| 1633382 | 1995.15 | 22.2 | A | 1.990.06 | 0.00.04 | 0.100.04 | |
| B2 | 0.160.03 | 0.490.05 | 884 | 0.470.04 | |||
| B1 | 0.390.04 | 1.150.05 | 874 | 0.560.04 | |||
| 1633382 | 1995.31 | 22.2 | A | 2.320.05 | 0.00.04 | 0.050.03 | |
| B2 | 0.200.04 | 0.530.05 | 874 | 0.260.03 | |||
| B1 | 0.410.05 | 1.180.05 | 874 | 0.100.04 | |||
| 1633382 | 1995.79 | 22.2 | A | 1.280.04 | 0.00.03 | 0.010.01 | |
| B3 | 0.600.07 | 0.130.04 | 715 | 0.120.04 | |||
| B2 | 0.110.04 | 0.490.05 | 903 | 0.420.04 | |||
| B1 | 0.580.05 | 1.280.04 | 873 | 0.570.04 | |||
| 1633382 | 1996.34 | 22.2 | A | 1.030.06 | 0.00.05 | 0.050.03 | |
| B3 | 0.340.05 | 0.200.05 | 744 | 0.260.03 | |||
| B2 | 0.02 | 0.55 | 90 | 0.10 | |||
| B1 | 0.570.04 | 1.350.06 | 874 | 0.520.05 | |||
| 1633382 | 1996.90 | 22.2 | A | 1.250.05 | 0.00.04 | 0.170.05 | |
| B3 | 0.110.04 | 0.280.05 | 556 | 0.010.02 | |||
| B2 | 0.110.04 | 0.660.06 | 844 | 0.520.05 | |||
| B1 | 0.560.05 | 1.520.05 | 884 | 0.560.04 | |||
| 1730130 | 1994.48 | 22.2 | A | 4.780.08 | 0.00.06 | 0.040.02 | |
| C | 0.190.06 | 1.160.12 | 145 | 0.420.05 | |||
| 1730130 | 1994.59 | 22.2 | A | 4.130.10 | 0.00.05 | 0.010.02 | |
| C | 0.09 | 1.61 | 2 | 0.28 | |||
| D2 | 0.05 | 1.17 | 34 | 0.24 | |||
| E | 0.16 | 0.73 | 63 | 0.02 | |||
| 1730130 | 1995.15 | 22.2 | A | 8.250.17 | 0.00.06 | 0.090.03 | |
| D2 | 0.03 | 1.19 | 21 | 0.12 | |||
| C | 0.260.05 | 1.230.07 | 24 | 0.360.04 | |||
| D1 | 0.28 | 3.58 | 14 | 0.71 | |||
| 1730130 | 1995.79 | 22.2 | A | 9.880.15 | 0.00.08 | 0.090.05 | |
| D3 | 0.580.06 | 0.310.05 | 235 | 0.280.04 | |||
| C | 0.170.05 | 1.580.06 | 13 | 0.400.03 | |||
| D1 | 0.22 | 3.90 | 15 | 0.60 | |||
| 1730130 | 1995.79 | 43.2 | A | 15.50.3 | 0.00.06 | 0.100.04 | |
| B1 | 0.490.07 | 0.380.04 | 104 | 0.150.04 | |||
| 1730130 | 1996.34 | 22.2 | A | 10.40.2 | 0.00.06 | 0.100.03 | |
| D3 | 0.520.05 | 0.620.08 | 164 | 0.350.05 | |||
| C | 0.07 | 1.46 | 10 | 0.06 | |||
| D1 | 0.11 | 4.71 | 13 | 0.87 | |||
| 1730130 | 1996.34 | 43.2 | A | 3.300.07 | 0.00.05 | 0.050.03 | |
| B2 | 9.670.28 | 0.190.05 | 314 | 0.090.04 | |||
| B1 | 1.460.09 | 0.450.06 | 2 3 | 0.260.05 | |||
| 1730130 | 1996.60 | 43.2 | A | 2.280.06 | 0.00.05 | 0.080.04 | |
| B2 | 8.550.15 | 0.240.05 | 323 | 0.070.03 | |||
| B1 | 0.360.05 | 0.500.05 | 185 | 0.140.03 | |||
| 1730130 | 1996.90 | 43.2 | A | 2.320.08 | 0.00.05 | 0.080.05 | |
| B2 | 8.950.15 | 0.320.06 | 324 | 0.060.04 | |||
| B1 | 0.360.07 | 0.720.05 | 7 4 | 0.070.04 | |||
| 1739522 | 1993.86 | 22.2 | A | 1.160.07 | 0.00.06 | 0.090.04 | |
| B1 | 0.380.05 | 0.430.06 | 776 | 0.610.06 | |||
| D2 | 0.02 | 2.10 | 55 | 0.21 | |||
| D1 | 0.02 | 5.34 | 26 | 0.37 | |||
| 1739522 | 1996.34 | 22.2 | A | 0.780.05 | 0.00.04 | 0.060.03 | |
| 1739522 | 1997.58 | 22.2 | A | 0.980.05 | 0.00.05 | 0.070.04 | |
| B2 | 0.910.06 | 0.160.08 | 1098 | 0.240.05 | |||
| D3 | 0.02 | 1.04 | 32 | 0.34 | |||
| 1741038 | 1995.76 | 22.2 | A | 3.950.04 | 0.00.04 | 0.120.03 | |
| B1 | 0.10 | 1.16 | 157 | 0.21 | |||
| 1741038 | 1997.58 | 22.2 | A | 6.260.06 | 0.00.05 | 0.140.05 | |
| B2 | 0.38 | 0.30 | 111 | 0.05 | |||
| B1 | 0.02 | 1.59 | 158 | 0.48 | |||
| 1908201 | 1996.60 | 22.2 | A | 1.320.06 | 0.00.04 | 0.050.02 | |
| C | 0.150.05 | 0.530.06 | 104 | 0.230.05 | |||
| B2 | 0.04 | 0.93 | 23 | 0.07 | |||
| B1 | 0.03 | 1.80 | 14 | 0.11 | |||
| D1 | 0.07 | 2.4 | 43 | 0.72 | |||
| 1908201 | 1996.90 | 22.2 | A | 1.680.05 | 0.00.05 | 0.000.04 | |
| C | 0.140.03 | 0.490.04 | 133 | 0.090.03 | |||
| B2 | 0.230.05 | 1.160.07 | 73 | 0.270.04 | |||
| D2 | 0.08 | 2.6 | 37 | 0.62 | |||
| D3 | 0.05 | 3.4 | 15 | 0.70 | |||
| 1908201 | 1997.58 | 22.2 | A | 2.130.04 | 0.00.04 | 0.070.03 | |
| B3 | 0.530.04 | 0.310.05 | 185 | 0.180.04 | |||
| C | 0.01 | 0.56 | 11 | 0.02 | |||
| B2 | 0.06 | 2.06 | 4 | 0.64 | |||
| D4 | 0.05 | 2.6 | 47 | 0.58 | |||
| D5 | 0.06 | 2.9 | 24 | 0.65 | |||
| 2209236 | 1996.60 | 22.2 | A | 1.750.06 | 0.00.05 | 0.140.05 | |
| B1 | 0.110.04 | 0.290.07 | 355 | 0.020.03 | |||
| C | 0.02 | 1.41 | 14 | 0.38 | |||
| 2209236 | 1996.90 | 22.2 | A | 1.720.05 | 0.00.04 | 0.080.03 | |
| B2 | 0.650.05 | 0.180.06 | 514 | 0.120.03 | |||
| C | 0.03 | 1.38 | 16 | 0.41 | |||
| 2209236 | 1997.58 | 22.2 | A | 0.680.04 | 0.00.04 | 0.040.02 | |
| B3 | 0.480.06 | 0.210.05 | 335 | 0.110.03 | |||
| C | 0.05 | 1.40 | 17 | 0.56 | |||
| 2230114 | 1995.15 | 43.2 | A | 1.450.02 | 0.00.03 | 0.060.01 | |
| B1 | 0.160.04 | 0.270.04 | 1263 | 0.200.03 | |||
| C | 0.240.03 | 1.780.06 | 1424 | 0.570.04 | |||
| C1 | 0.06 | 4.8 | 163 | 1.1 | |||
| C2 | 0.15 | 7.1 | 159 | 1.0 | |||
| 2230114 | 1995.31 | 43.2 | A | 1.590.05 | 0.00.04 | 0.050.02 | |
| B1 | 0.160.03 | 0.360.03 | 1332 | 0.220.04 | |||
| C | 0.280.04 | 1.870.05 | 1413 | 0.520.05 | |||
| C2 | 0.04 | 7.4 | 158 | 0.5 | |||
| 2230114 | 1995.59 | 43.2 | A | 1.580.04 | 0.00.04 | 0.030.01 | |
| B1 | 0.170.04 | 0.440.05 | 1313 | 0.130.03 | |||
| C | 0.390.05 | 1.910.05 | 1413 | 0.530.04 | |||
| C1 | 0.02 | 4.8 | 167 | 0.2 | |||
| C2 | 0.14 | 7.3 | 156 | 1.3 | |||
| 2230114 | 1996.34 | 43.2 | A | 1.970.06 | 0.00.02 | 0.060.01 | |
| B2 | 0.07 | 0.40 | 127 | 0.13 | |||
| B1 | 0.05 | 0.70 | 131 | 0.19 | |||
| C | 0.320.04 | 1.910.04 | 1403 | 0.570.03 | |||
| C1 | 0.02 | 4.7 | 168 | 0.2 | |||
| C2 | 0.18 | 7.2 | 156 | 1.5 | |||
| 2230114 | 1996.60 | 43.2 | A | 1.530.02 | 0.00.02 | 0.010.01 | |
| B3 | 0.270.03 | 0.130.04 | 1325 | 0.040.02 | |||
| B2 | 0.05 | 0.47 | 131 | 0.12 | |||
| B1 | 0.04 | 0.78 | 128 | 0.15 | |||
| C | 0.310.03 | 1.920.05 | 1403 | 0.660.05 | |||
| C1 | 0.04 | 4.3 | 165 | 1.0 | |||
| C2 | 0.14 | 7.3 | 156 | 1.7 | |||
| 2230114 | 1996.90 | 43.2 | A | 2.350.02 | 0.00.03 | 0.020.01 | |
| B3 | 0.130.04 | 0.200.03 | 1323 | 0.040.04 | |||
| B2 | 0.07 | 0.59 | 135 | 0.24 | |||
| B1 | 0.05 | 0.86 | 121 | 0.41 | |||
| C | 0.300.04 | 1.910.05 | 1394 | 0.760.06 | |||
| C1 | 0.06 | 4.3 | 165 | 0.7 | |||
| C2 | 0.21 | 7.4 | 158 | 2.2 | |||
| 2230114 | 1997.58 | 43.2 | A | 6.530.06 | 0.00.04 | 0.050.02 | |
| B3 | 0.080.02 | 0.370.04 | 1354 | 0.230.05 | |||
| C | 0.210.05 | 1.840.05 | 1393 | 0.550.04 | |||
| C1 | 0.04 | 4.2 | 164 | 0.7 | |||
| C2 | 0.11 | 7.1 | 157 | 1.2 | |||
| 2251158 | 1995.01 | 43.2 | A | 3.080.09 | 0.00.04 | 0.040.03 | |
| B1 | 1.320.06 | 0.300.07 | 743 | 0.200.06 | |||
| C | 3.230.09 | 0.650.03 | 632 | 0.210.01 | |||
| D1 | 0.30 | 0.81 | 96 | 0.01 | |||
| 2251158 | 1995.15 | 43.2 | A | 6.310.10 | 0.00.03 | 0.050.03 | |
| B1 | 1.540.08 | 0.370.08 | 745 | 0.200.05 | |||
| C | 1.200.14 | 0.640.02 | 652 | 0.080.02 | |||
| D1 | 0.83 | 0.72 | 94 | 0.47 | |||
| D2 | 1.02 | 0.77 | 57 | 0.23 | |||
| 2251158 | 1995.31 | 43.2 | A | 1.390.07 | 0.00.04 | 0.080.04 | |
| B2 | 4.430.16 | 0.060.04 | 816 | 0.070.03 | |||
| B1 | 1.730.12 | 0.460.06 | 668 | 0.300.05 | |||
| C | 1.300.09 | 0.640.03 | 653 | 0.100.04 | |||
| D1 | 0.65 | 0.73 | 92 | 0.37 | |||
| D2 | 0.85 | 0.79 | 54 | 0.22 | |||
| 2251158 | 1995.47 | 43.2 | A | 1.150.08 | 0.00.04 | 0.070.03 | |
| B2 | 3.910.12 | 0.140.02 | 784 | 0.070.02 | |||
| C | 1.730.15 | 0.630.04 | 642 | 0.180.05 | |||
| D1 | 0.46 | 0.80 | 105 | 0.27 | |||
| D2 | 0.93 | 0.85 | 54 | 0.14 | |||
| 2251158 | 1995.59 | 43.2 | A | 1.020.06 | 0.00.03 | 0.010.01 | |
| B2 | 3.170.16 | 0.170.02 | 744 | 0.060.04 | |||
| C | 2.130.19 | 0.630.06 | 672 | 0.170.02 | |||
| D1 | 0.43 | 0.81 | 107 | 0.37 | |||
| D2 | 0.64 | 0.82 | 50 | 0.20 | |||
| 2251158 | 1995.79 | 43.2 | A | 1.260.05 | 0.00.03 | 0.050.01 | |
| B2 | 2.660.02 | 0.240.03 | 785 | 0.090.02 | |||
| C | 1.670.13 | 0.600.05 | 631 | 0.160.08 | |||
| D1 | 0.41 | 0.72 | 103 | 0.35 | |||
| D2 | 0.97 | 0.76 | 55 | 0.19 | |||
| 2251158 | 1996.34 | 43.2 | A | 1.100.04 | 0.00.02 | 0.080.01 | |
| b3 | 1.720.04 | 0.190.05 | 883 | 0.160.04 | |||
| B2 | 1.540.08 | 0.530.06 | 797 | 0.200.05 | |||
| C | 2.320.10 | 0.640.04 | 672 | 0.260.07 | |||
| D1 | 0.65 | 0.73 | 92 | 0.37 | |||
| D2 | 0.85 | 0.79 | 54 | 0.22 | |||
| 2251158 | 1996.60 | 43.2 | A | 1.800.10 | 0.00.04 | 0.020.02 | |
| B3 | 1.240.08 | 0.150.03 | 812 | 0.220.03 | |||
| B2 | 1.770.25 | 0.590.07 | 635 | 0.260.09 | |||
| C | 1.430.18 | 0.650.05 | 652 | 0.150.06 | |||
| D1 | 0.23 | 0.91 | 98 | 0.35 | |||
| D2 | 0.83 | 0.79 | 55 | 0.17 | |||
| 2251158 | 1996.90 | 43.2 | A | 1.900.03 | 0.00.02 | 0.010.01 | |
| B3 | 1.270.03 | 0.170.01 | 946 | 0.050.01 | |||
| B2 | 0.910.20 | 0.610.12 | 719 | 0.250.08 | |||
| C | 1.370.25 | 0.680.07 | 683 | 0.060.05 | |||
| D1 | 0.15 | 0.89 | 102 | 0.11 | |||
| D2 | 0.34 | 0.89 | 55 | 0.14 | |||
| 2251158 | 1996.98 | 43.2 | A | 1.830.04 | 0.00.03 | 0.090.02 | |
| B3 | 1.420.06 | 0.170.02 | 788 | 0.170.04 | |||
| B2 | 0.600.07 | 0.560.08 | 798 | 0.170.05 | |||
| C | 1.250.15 | 0.680.05 | 736 | 0.330.07 | |||
| D1 | 0.12 | 1.17 | 109 | 0.10 | |||
| D2 | 0.17 | 0.91 | 46 | 0.02 | |||
| 2251158 | 1997.19 | 43.2 | A | 2.220.08 | 0.00.04 | 0.120.04 | |
| B3 | 0.820.06 | 0.250.02 | 902 | 0.120.02 | |||
| C | 1.170.11 | 0.650.02 | 603 | 0.200.03 | |||
| D1 | 0.36 | 0.70 | 114 | 0.17 | |||
| 2251158 | 1997.58 | 43.2 | A | 1.130.03 | 0.00.02 | 0.030.01 | |
| B3 | 1.660.07 | 0.270.01 | 804 | 0.200.02 | |||
| C | 1.250.15 | 0.600.02 | 566 | 0.340.03 | |||
| D1 | 0.28 | 0.84 | 95 | 0.36 | |||
| D2 | 0.35 | 1.15 | 39 | 0.13 |
| Source | z | Comp. | [mas yr-1] | [h-1] | Figure | |
|---|---|---|---|---|---|---|
| 0202149 | 0.833 | B | 0.180.01 | 5.20.3 | 1994.830.06 | (a)(a)Fig. 15 in Pyatunina et al. 2000 |
| 0219428 | 0.444 | B4 | 0.570.14 | 9.92.4 | 1995.670.33 | 3c |
| B3 | 0.820.03 | 14.20.5 | 1995.370.02 | |||
| B2 | 1.110.20 | 19.33.5 | 1994.80.3 | |||
| 023564 | 0.94 | B1 | 0.930.16 | 29.65.1 | 1995.10.2 | 5b |
| B2 | 0.610.16 | 19.45.1 | 1994.80.2 | |||
| 0336019 | 0.852 | C4 | 0.180.07 | 5.32.1 | 1995.130.16 | (b)(b)Fig. 7 in Mattox et al. 2001 |
| C3 | 0.420.04 | 12.41.2 | 1993.90.1 | |||
| 0420140 | 0.915 | B | 0.200.02 | 6.20.6 | 1995.280.03 | 6c |
| 0440003 | 0.844 | B | 0.340.03 | 10.00.9 | 1994.210.19 | (c)(c)Fig. 4 in Yurchenko, Marchenko-Jorstad, & Marscher 2000 |
| 0458020 | 2.286 | B2 | 0.150.01 | 9.10.6 | 1994.020.08 | 9b |
| 0528134 | 2.06 | F2 | 0.40.2 | 22.611.3 | 1993.21.6 | 10c |
| B1F3 | 0.260.10 | 14.75.7 | 1993.40.7 | |||
| B2F4 | 0.330.09 | 18.75.1 | 1994.50.15 | |||
| B3 | 0.190.02 | 10.81.1 | 1994.810.02 | |||
| B4 | 0.150.02 | 8.51.1 | 1995.510.06 | |||
| 0716741 | 0.3 | B2 | 1.10.15 | 13.61.9 | 1995.050.07 | 11b |
| B3 | 1.20.2 | 14.82.5 | 1996.00.2 | |||
| B4 | 0.9 | 11.1 | 1996.7 | |||
| 0827243 | 2.046 | B1 | 0.440.10 | 24.85.6 | 1994.710.07 | 13b |
| D2 | 0.480.09 | 27.05.1 | 19891 | |||
| 0829046 | 0.18 | B1 | 1.40.2 | 10.71.5 | 1994.30.1 | 14b |
| B2 | 0.820.21 | 6.41.7 | 1994.360.17 | |||
| B3 | 0.700.10 | 5.40.7 | 1994.530.07 | |||
| B4 | 0.370.02 | 2.90.15 | 1993.980.05 | |||
| 0836710 | 2.17 | B | 0.240.02 | 14.11.2 | 1992.110.25 | 15c |
| 0851202 | 0.306 | B3 | 0.43 | 5.4 | 1996.64 | 16d |
| B2 | 0.540.05 | 6.80.7 | 1995.630.06 | |||
| B1D1F1 | 0.670.16 | 8.42.0 | 1994.10.25 | |||
| 0917449 | 2.18 | B | 0.150.02 | 8.81.2 | 1990.80.25 | 17b |
| 1101384 | 0.031 | 0.9 | 1.3 | (d)(d)Fig. 4 in Marscher 1999 | ||
| 1.35 | 2.0 | |||||
| 1127145 | 1.187 | B2 | 0.270.05 | 10.31.9 | 1994.620.08 | 19b |
| B1 | 0.520.16 | 19.86.1 | 1991.11.4 | |||
| 1156295 | 0.729 | B2 | 0.340.04 | 8.91.0 | 1995.280.03 | 20b |
| B3 | 0.540.09 | 14.12.3 | 1996.30.2 | |||
| 1219285 | 0.102 | B9 | 0.13 | 0.6 | 1994.4 | 21b |
| B3+B8 | 0.320.05 | 1.50.2 | 1993.70.2 | |||
| B7 | 0.60 | 2.8 | 1994.0 | |||
| B2+B6 | 0.470.01 | 2.20.1 | 1991.90.1 | |||
| B1+B5 | 0.500.07 | 2.30.3 | 1990.70.6 | |||
| 1222216 | 0.435 | B1 | 0.5 | 8.5 | 1993.1 | 22b |
| B2 | 0.9 | 15.4 | 1996.3 | |||
| 1226023 | 0.158 | B5+E2 | 0.330.18 | 2.31.2 | 1993.41.3 | 23d |
| B4+E1 | 0.850.18 | 5.91.2 | 1993.70.3 | |||
| B3 | 0.660.07 | 4.50.5 | 1992.40.3 | |||
| B2 | 0.610.06 | 4.20.4 | 1991.30.37 | |||
| B1+G1 | 0.680.04 | 4.70.3 | 1990.40.3 | |||
| H5+K6+D1 | 1.60.2 | 11.11.4 | 1990.60.7 | 23e | ||
| H3+K5+D2 | 0.700.09 | 4.80.6 | 1982.61.7 | |||
| 1253055 | 0.538 | B3 | 0.180.02 | 3.70.4 | 1995.70.1 | 24d |
| B2 | 0.170.02 | 3.50.4 | 1994.20.1 | |||
| E2+B1 | 0.270.02 | 5.50.4 | 1993.50.2 | |||
| D | 0.310.02 | 6.30.4 | 1986.80.6 | |||
| 1406076 | 1.494 | B3 | 0.630.05 | 28.42.3 | 1995.650.05 | 25b |
| B4 | 0.410.06 | 18.22.7 | 1996.00.2 | |||
| 1510089 | 0.361 | B1 | 0.510.04 | 7.40.6 | 1996.10.1 | 26b |
| D1 | 0.280.14 | 4.12.0 | 1991.82.1 | |||
| D2 | 0.630.10 | 9.21.5 | 1994.10.2 | |||
| 1611343 | 1.40 | B4 | 0.570.22 | 249 | 1995.31.4 | 28d |
| B3 | 0.490.18 | 218 | 1991.41.6 | |||
| B2 | 0.180.02 | 7.70.9 | 1979.01.4 | |||
| B1 | 0.310.05 | 13.32.1 | 1984.71.7 | |||
| 1622253 | 0.786 | B | 0.510.13 | 14.13.6 | 1995.950.26 | 29b |
| 1622297 | 0.815 | B2+D2+E3 | 0.140.03 | 3.90.7 | 1995.070.13 | 30d |
| B1+D1+E2 | 0.340.04 | 9.71.1 | 1994.260.09 | |||
| E1 | 0.330.06 | 9.31.8 | 1993.10.4 | |||
| F2 | 0.300.03 | 8.60.9 | 1979.51.7 | 30e | ||
| F1 | 0.400.29 | 11.48.3 | 1989.58.6 | |||
| 1633382 | 1.814 | B3 | 0.140.01 | 7.30.5 | 1994.840.05 | 31b |
| B1 | 0.200.02 | 10.41.0 | 1989.20.4 | |||
| 1652398 | 0.034 | 0.960.10 | 1.50.2 | |||
| 1730130 | 0.902 | B2 | 0.230.02 | 7.10.6 | 1995.540.05 | 32c |
| B1 | 0.280.10 | 8.63.1 | 1994.570.17 | |||
| 1908201 | 0.2 | B2 | 1.20.1 | 10.30.9 | 1995.90.1 | 35b |
| 2200420 | 0.069 | S10 | 1.150.09 | 3.60.3 | 1996.870.06 | (e)(e)Fig. 24 in Denn, Mutel, & Marscher 2000 |
| S9 | 1.910.10 | 6.00.3 | 1996.240.05 | |||
| S8 | 0.710.05 | 2.20.2 | 1994.200.05 | |||
| S7 | 1.360.17 | 4.30.5 | 1994.120.13 | |||
| 2230114 | 1.037 | B3 | 0.250.01 | 8.60.3 | 1996.080.02 | 37c |
| B2 | 0.340.04 | 11.71.4 | 1995.190.04 | |||
| B1 | 0.330.01 | 11.30.3 | 1994.280.02 | |||
| 2251158 | 0.859 | B3 | 0.140.03 | 4.20.9 | 1995.590.14 | 38b |
| B2 | 0.340.04 | 10.11.2 | 1995.050.05 | |||
| B1 | 0.530.02 | 15.70.6 | 1994.450.03 |
| Source | z | Freq.[GHz] | Comp. | [mas] | [deg.] |
|---|---|---|---|---|---|
| 0202149(a)(a)in Pyatunina et al. 2000 | 0.833 | 43.2 | C | 0.530.01 | 793 |
| D | 5.150.02 | -572 | |||
| 0219428 | 0.444 | 43.2 | C | 0.530.02 | 1571 |
| 0234285 | 1.213 | 22.2 | C1 | 0.320.02 | 231 |
| C2 | 1.080.04 | 201 | |||
| C3 | 3.200.03 | 121 | |||
| 0336140(b)(b)in Mattox et al. 2001 | 0.852 | 43.2 | C2 | 1.20.2 | 776 |
| 22.2 | C2 | 1.180.08 | 808 | ||
| 0420140 | 0.915 | 43.2 | C1 | 0.650.12 | 1691 |
| C2 | 1.80.2 | 1562 | |||
| 0440003(c)(c)in Yurchenko, Marchenko-Jorstad, & Marscher 2000 | 0.844 | 22.2 | C | 1.280.02 | 1231 |
| 0446112 | 1.207 | 43.2 | C | 0.460.01 | 1304 |
| 0458020 | 2.286 | 43.2 | C2 | 1.380.16 | 317 |
| C1 | 1.400.17 | 372 | |||
| 0804449 | 1.433 | 22.2 | C1 | 0.290.04 | 5810 |
| C2 | 0.930.05 | 1301 | |||
| 0827243 | 2.046 | 43.2 | C* | 0.430.08 | 1267 |
| 22.2 | C | 0.340.02 | 1178 | ||
| 0829046 | 0.18 | 22.2 | C1 | 0.180.04 | 8019 |
| C2 | 0.600.02 | 611 | |||
| 0836710 | 2.17 | 22.2 | C1 | 0.240.04 | 1365 |
| 22.2 | C2+C3 | 2.70.2 | 1452 | ||
| 43.2 | C2*+C3* | 3.100.14 | 1431 | ||
| 0851202 | 0.306 | 43.2 | C1 | 0.240.04 | 10414 |
| 22.2 | E1 | 0.280.03 | 905 | ||
| 43.2 | C2 | 1.200.11 | 933 | ||
| 22.2 | E2 | 1.200.02 | 911 | ||
| 0917449 | 2.18 | 22.2 | C1 | 0.730.04 | 1603 |
| C2 | 1.490.01 | 1771 | |||
| 0954658 | 0.368 | 22.2 | C1 | 0.360.03 | 223 |
| C2 | 0.900.02 | 201 | |||
| C3 | 2.180.05 | 654 | |||
| 1127145 | 1.187 | 22.2 | C1 | 2.210.03 | 771 |
| C2 | 4.130.03 | 831 | |||
| 1156295 | 0.729 | 22.2 | C | 0.700.03 | 102 |
| 1253055 | 0.538 | 43.2 | C | 1.200.04 | 1242 |
| 22.2 | F | 1.290.03 | 1224 | ||
| 8.4 | G | 0.930.03 | 1175 | ||
| 1510089 | 0.361 | 43.2 | C | 0.560.02 | 363 |
| 1606106 | 1.24 | 22.2 | C1 | 0.370.04 | 663 |
| C2 | 0.950.02 | 687 | |||
| 1611343 | 1.40 | 43.2 | E1 | 0.150.02 | 16010 |
| 22.2 | C1 | 0.280.03 | 1652 | ||
| 43.2 | E5 | 2.960.02 | 1771 | ||
| 22.2 | C2 | 2.810.02 | 1781 | ||
| 15.4 | F3 | 2.910.08 | 1771 | ||
| 1622297 | 0.815 | 15.4 | G | 15.40.1 | 691 |
| 1730130 | 0.902 | 22.2 | C | 1.410.07 | 62 |
| 1908201 | 0.2 | 22.2 | C | 0.530.02 | 111 |
| 2209236 | 22.2 | C | 1.400.02 | 162 | |
| 2230114 | 1.037 | 43.2 | C | 1.880.02 | 1401 |
| C1 | 4.50.1 | 1651 | |||
| C2 | 7.250.05 | 1571 | |||
| 2251158 | 0.859 | 43.2 | C | 0.640.01 | 661 |
| Name | Component | Type of Comp. | Range of Freq.[GHz] | |
|---|---|---|---|---|
| 0336019 | A | S | 1543 | 0.60.1 |
| 0336019 | C2 | S | 1543 | 0.730.09 |
| 0336019 | C3 | M | 1543 | 0.680.14 |
| 0336019 | C4 | M | 2243 | 0.310.09 |
| 0528134 | A | S | 2243 | 0.60.2 |
| 0528134 | B1 | M | 2243 | 0.30.3 |
| 0528134 | B2 | M | 2243 | 0.950.05 |
| 0836710 | A | S | 2243 | 0.050.15 |
| 0836710 | B | M | 2243 | 0.770.25 |
| 0836710 | C2+C3 | S | 2243 | 1.50.4 |
| 0851202 | A | S | 1543 | 0.320.02 |
| 0851202 | C2 | S | 1543 | 1.30.3 |
| 1226023 | A | S | 822 | 0.330.05 |
| 1226023 | A | S | 2243 | 0.060.08 |
| 1226023 | B1 | M | 2243 | 0.530.26 |
| 1226023 | B4 | M | 2243 | 0.730.35 |
| 1226023 | B5 | M | 2243 | 1.10.4 |
| 1253055 | A | S | 822 | 0.240.02 |
| 1253055 | A | S | 2243 | 0.60.5 |
| 1253055 | C | S | 2243 | 1.10.3 |
| 1253055 | D | M | 2243 | 0.870.15 |
| 1611343 | A | S | 1543 | 0.60.2 |
| 1611343 | C2 | S | 1543 | 1.50.3 |
| 1622297 | A | S | 1543 | 0.50.2 |
| 1622297 | B1 | M | 1543 | 0.910.05 |
| 1692297 | B2 | M | 1543 | 0.860.08 |
| 1730130 | A | S | 2243 | 0.670.06 |
| 1730130 | B1 | M | 2243 | 0.240.15 |
| Name | Sjet/Score | |||
|---|---|---|---|---|
| [deg] | [deg] | [mas] | ||
| 0202149 | 32 | 73 | 0.4 | 1.78 |
| 0219428 | 158 | 29 | 1.0 | 1.06 |
| 0234285 | 20 | 0 | 0.66 | |
| 0235164 | 0 | 59 | 0.15 | 0.14 |
| 0336019 | 75 | 28 | 0.6 | 0.34 |
| 0420014 | 166 | 16 | 0.6 | 0.14 |
| 0440003 | 123 | 0 | 1.49 | |
| 0446112 | 143 | 0 | 0.84 | |
| 0454234 | ||||
| 0458020 | 7 | 70 | 1.0 | 0.64 |
| 0528134 | 81 | 45 | 0.75 | 1.44 |
| 0716714 | 10 | 0 | 0.07 | |
| 0804499 | 136 | 85 | 1.0 | 0.19 |
| 0827243 | 134 | 17 | 1.2 | 1.24 |
| 0829046 | 72 | 0 | 0.68 | |
| 0836710 | 130 | 20 | 1.1 | 0.65 |
| 0851202 | 86 | 0 | 0.52 | |
| 0917449 | 180 | 0 | 0.88 | |
| 0954658 | 22 | 53 | 1.65 | 0.34 |
| 1101384 | 42 | 13 | 1.9 | 0.14 |
| 1127145 | 96 | 15 | 1.35 | 1.12 |
| 1156296 | 0 | 31 | 0.30 | 0.79 |
| 1219285 | 102 | 30 | 2.35 | 0.39 |
| 1222216 | 14 | 18 | 1.0 | 0.75 |
| 1226023 | 108 | 16 | 3.2 | 1.93 |
| 1253055 | 113 | 18 | 1.1 | 1.32 |
| 1406076 | 81 | 0 | 0.46 | |
| 1510089 | 32 | 0 | 0.16 | |
| 1606106 | 62 | 31 | 1.2 | 0.37 |
| 1611343 | 173 | 105 | 2.8 | 1.42 |
| 1622253 | 57 | 0 | 0.30 | |
| 1622297 | 83 | 27 | 2.0 | 0.80 |
| 1633382 | 85 | 0 | 1.86 | |
| 1652398 | 154 | 90 | 3.0 | |
| 1730130 | 17 | 123 | 0.22 | 6.13 |
| 1739522 | 61 | 0 | 0.66 | |
| 1741038 | 140 | 52 | 0.7 | 0.41 |
| 1908201 | 25 | 104 | 1.9 | 0.25 |
| 2200420 | 167 | 0 | ||
| 2209236 | 12 | 0 | ||
| 2230114 | 132 | 55 | 1.8 | 0.69 |
| 2251158 | 66 | 54 | 0.6 | 9.65 |
| Coeff. | BL Lacs | Quasars | All |
|---|---|---|---|
| 0.841 | 0.716 | 0.771 | |
| 0.892 | 0.875 | 0.867 | |
| 0.830 | 0.366 | 0.427 | |
| 0.840 | 0.070 | 0.415 | |
| 0.906 | 0.399 | 0.512 | |
| 0.471 | 0.13 | 0.149 | |
| 0.659 | 0.174 | 0.314 |
References
- (1) Alberdi, A., et al. 1993, ApJ, 402, 160
- (2) Aller, M.F, Aller, H.D., & Hughes, P.A. 1999, BAAS, 195, 1609
- (3) Altschuler, D. R., et al. 1984, AJ, 89, 1784
- (4) Antonucci, R.R.J. & Ulvestad, J.S. 1985, ApJ, 294, 158
- (5) Bååth, L.B. 1987, in Superluminal Radio Sources, eds. Zensus J.A. & Pearson T.J., Cambridge: Cambridge Univ. Press, 206
- (6) Barthel P.D., C.E., Conway, J.E., Meyers, S.T., Pearson, T.J., & Readhead, A.C.S. 1995, ApJ, 444, 21
- (7) Begelman, M.C., Rees, M.J., & Sikora, M. 1994, ApJ, 429, L57
- (8) Bondi, M., et al. 1996, A&A, 308, 415
- (9) Bower, G.C., Backer, D.C., Wright, M., & Forster, J.R. 1997, ApJ, 484, 118
- (10) Britzen, S., et al. 1999, in BL Lac Phenomenon, eds. Takalo, L.O. & Sillanpää A., ASP Conf. Ser., 159, 431
- (11) Britzen, S., Witzel, A., Krichbaum, T.P., Roland, J, & Wagner, S.J. 1998, in IAU Colloq. 164, Radio Emission from Galactic and Extragalactic Compact Sources, eds. Zensus, J.A., Taylor, G.B., & Wrobel J.M., ASP Conf. Ser., 144, 43
- (12) Cawthorne, T.V. & Gabuzda, D.C. 1996, MNRAS, 278, 861
- (13) Chu, H.S., Bååth, L.B., Rantakyrö, F.T., Zhang, H.S., & Nicholson, G. 1996, A&A, 307, 15
- (14) Cotton, W. D., & Spangler, S. R. 1979, ApJ, 228, L63
- (15) Daly, R.A., & Marscher, A.P. 1988, ApJ, 334, 539
- (16) Denn, G.R., Mutel, R.L., & Marscher, A.P. 2000, ApJS, 129, 61
- (17) Dondi, L. & Ghisellini G. 1995, MNRAS, 273, 583
- (18) Fey, A.L. & Charlot, P. 1997, ApJS, 111, 95
- (19) Fey, A.L., Clegg, A.W., & Fomalont, E.B. 1996, ApJS, 105, 299
- (20) Fichtel, C.E., et al. 1993, A&AS, 97, 13
- (21) Flatters, C. 1996, SLIME User’s Guide and Reference Manual, NRAO
- (22) Gabuzda, D.C., et al. 1998, A&A, 333, 445
- (23) Gabuzda, D.C. & Cawthorne, T.V. 1996, MNRAS, 283, 759
- (24) Gabuzda, D.C., Mullan C.M., Cawthorne, T.V., Wardle, J.F.C., & Roberts, D.H. 1994, ApJ, 435, 140
- (25) Gabuzda, D.C., Cawthorne, T.V., Roberts, D.H., & Wardle, J.F.C. 1992, ApJ, 388, 40
- (26) Gabuzda, D.C., Wardle, J.F.C., & Roberts, D.H. 1989, ApJ, 336, L59
- (27) Gómez, J.L., Marscher A.P., & Alberdi, A. 1999, ApJ, 522, 74
- (28) Gómez, J.L., Marti, J.M., Marscher A.P., Ibáñez, J.M., & Alberdi, A. 1997, ApJ, 482, L33
- (29) Gómez, J.L., Marti, J.M., Marscher A.P., Ibáñez, J.M., & Marcaide, J.M. 1995, ApJ, 449, L19
- (30) Grandi, P., et al. 1996, ApJ, 459, 73
- (31) Hartman, R.C., et al. 1999, ApJS, 123, 79
- (32) Homan, D.C. & Wardle, J.F.C. 1999, AJ, 118, 1942
- (33) Hooimeyer, J.R., Schilizzi, R.T., Miley, G.K., & Barthel, P.D. 1992, A&A, 261, 5
- (34) Hummel, C.A., et al. 1992, A&A, 266, 93
- (35) Jorstad, S.G., et al. 2001, in preparation
- (36) Kellermann, K.I., Vermeulen, R.C., Zensus, J.A., & Cohen, M.H. 1998, AJ, 115, 1295
- (37) Kemball, A.J., Diamond, P.J., & Pauliny-Toth, I.I.K. 1996, ApJ, 464, L55
- (38) Krichbaum, T.P., Kraus, A., Otterbein, K., Britzen, S., Witzel, A., & Zensus, J.A. 1998, in IAU Colloq. 164, Radio Emission from Galactic and Extragalactic Compact Sources, eds. Zensus, J.A., Taylor, G.B., & Wrobel J.M., ASP Conf. Ser., 144, 37
- (39) Krichbaum, T.P., et al. 1990, A&A, 230, 271
- (40) Kollgaard, R.I., Wardle, J.F.C., Roberts, D.H., & Gabuzda, D.C. 1992, AJ, 104, 1687
- (41) Lainela, M., et al. 1999, ApJ, 521, 561
- (42) Lister, M.L. & Marscher, A.P. 1999, Astroparticle Physics, 11, 65
- (43) Lister, M.L., Marscher, A.P., & Gear, W.K. 1998, ApJ, 504, 702
- (44) Lister, M.L. & Marscher, A.P. 1997, ApJ, 476, 572
- (45) Mantovani, F., Junor, W., Valerio, C., & McHardy, I. 1999, A&A, 346, 397
- (46) Marscher, A.P., Jorstad, S.G., Mattox, J.R., & Wehrle, A.E. 2001, in preparation
- (47) Marscher, A.P. 1999, Astroparticle Physics, 11, 19
- (48) Marscher, A.P. 1998, in IAU Colloq. 164, Radio Emission from Galactic and Extragalactic Compact Sources, eds. Zensus, J.A., Taylor, G.B., & Wrobel J.M., ASP Conf. Ser., 144, 25
- (49) Mattox, J.R., et al. 2001, submitted to ApJ
- (50) Mattox, J.R., Schachter, J., Molnar, L., Hartman, R.C., & Patnail, A.R. 1997a, ApJ, 481, 95
- (51) Mattox, J.R., et al. 1997b, ApJ, 476, 692
- (52) McHardy, I., Lawson, A., Newsam, A., Marscher, A., Robson, I., & Stevens, J. 1999, MNRAS, 310, 571
- (53) McHardy, I.M., Marscher A.P., Gear, W.K., Muxlow, T., Lehto, H.J., & Abraham, R.G. 1990, MNRAS, 246, 305
- (54) Michelson, P., et al. 1993, BAAS, 182, 4409
- (55) Mücke, A, et al. 1997, A&A, 320, 33
- (56) Mukherjee, R, et al. 1997, ApJ, 490, 116
- (57) Otterbein, K., et al. 1998, A&A, 334, 489
- (58) Padovani, P. 1992, A&A, 256, 399
- (59) Pauliny-Toth, I.I.K 1998, in IAU Colloq. 164, Radio Emission from Galactic and Extragalactic Compact Sources, ed. Zensus, J.A., Taylor, G.B., & Wrobel J.M., ASP Conf. Ser., 144, 75
- (60) Pauliny-Toth, I.I.K., et al. 1987, Nature, 328, 778
- (61) Pearson, T.J., et al. 1998, in IAU Colloq. 164, Radio Emission from Galactic and Extragalactic Compact Sources, eds. Zensus, J.A., Taylor, G.B., & Wrobel J.M., ASP Conf. Ser., 144, 17
- (62) Pearson, T.J. & Readhead, A.C.S. 1988, ApJ, 328, 114
- (63) Pearson, T.J. & Zensus, J.A. 1987, in Superluminal Radio Sources, eds. Zensus J.A. & Pearson T.J., Cambridge: Cambridge Univ. Press, 1
- (64) Perley, R.A. 1982, AJ, 87, 859
- (65) Piner, B.G., et al. 1999, BAAS, 195, 1504
- (66) Piner, B.G. & Kingham, K.A. 1998, ApJ, 507, 706
- (67) Piner, B.G. & Kingham, K.A. 1997a, ApJ, 479, 684
- (68) Piner, B.G. & Kingham, K.A. 1997b, ApJ, 485, L61
- (69) Pohl, M., et al. 1995, A&A, 303, 383
- (70) Polatidis, A.G., et al. 1995, ApJS, 98, 1
- (71) Price, R., Gower, A.C., Hutchings, J.B., Talon, S., Duncan, D., & Ross, G. 1993, ApJS, 86, 365
- (72) Pyatunina, T.B., et al. 2000, A&A, 358, 451
- (73) Rantakyrö, F.T., Bååth, L.B., Dallacassa, D., Jones, D.L., & Wehrle, A.E. 1996, A&A, 310, 66
- (74) Shepherd, M.C., Pearson, T.J., & Taylor, G.B. 1994, BAAS, 26, 987
- (75) Sillanpää, A., et al. 1996, A&A, 315, 13
- (76) Singh, K.P., Shrader, C.R., & George, I.M. 1997, ApJ, 491, 515
- (77) Sitko, M.L., Schmidt, G.D., & Stein, W.A. 1985, ApJS, 59, 323
- (78) Smith, P.S., Balonek, T.J., Elston, R., & Heckert, P.A. 1987, ApJS, 64, 459
- (79) Tateyama, C.E., Kingham, K.A., Kaufmann, P., Piner, B.G., Botti, L.C.L., & de Lucena, A.M.P 1999, ApJ, 520, 627
- (80) Tingay, S.J., Murphy, D.W., & Edwards, P.G. 1998, ApJ, 500, 673
- (81) Thompson, D.J., et al. 1993, ApJ, 415, 13
- (82) Unwin, S.C., Wehrle, A.E., Xu, W., Zook, A.C., & Marscher, A.P. 1998, in IAU Colloq. 164, Radio Emission from Galactic and Extragalactic Compact Sources, ed. Zensus, J.A., Taylor, G.B., & Wrobel J.M., ASP Conf. Ser., 144, 69
- (83) Valtaoja, E. & Teraesränta, H. 1996, A&AS, 120, 491
- (84) Valtaoja, E., Lahteenmäki, A., & Teräesranta, H. 1992, A&AS, 95, 73
- (85) Vermeulen, R.C. & Cohen, M.H. 1994, ApJ, 430, 467
- (86) von Montigny, C., et al. 1997, ApJ, 483, 161
- (87) von Montigny, C., et al. 1995a, ApJ, 440, 525
- (88) von Montigny, C., et al. 1995b, A&A, 299, 680
- (89) Wagner, S.J., et al. 1996, AJ, 111, 2187
- (90) Wagner, S.J., et al. 1995, A&A, 298, 688
- (91) Wajima, K., Lovell, J.E.J., Kobayashi, H., Hirabayashi, H., Fujisawa, K., & Tsuboi, M. 2000, PASJ, 52, 329
- (92) Wardle, J.F.C., Homan, D.C., Ojha, R., & Roberts, D.H. 1998, Nature, 395, 457
- (93) Wehrle, A. E., et al. 2001, ApJ, in press
- (94) Wehrle, A. E., et al. 1998, ApJ, 497, 178
- (95) Wehrle, A. E., et al. 1992, ApJ, 391, 589
- (96) Wehrle, A. E. & Cohen, M. 1989, ApJ, 346, L69
- (97) Whitney, A. R., et al. 1971, Science, 173, 225
- (98) Witzel, A., et al. 1988, A&A, 206, 245
- (99) Xie, G. Z., et al. 1994, A&AS, 106, 361
- (100) Xu, W., Readhead, A. C. S., Pearson, T. J., Polatidis, A. G., & Wilkinson, P. N. 1995, ApJS, 99, 297
- (101) Yurchenko, A. V., Marchenko-Jorstad, S. G., & Marscher, A. P. 2000, A&A, 358, 428
- (102) Zhou, Y. Y., Lu, Y. J., Wang, T. G., Yu, K. N., & Young, E. C. M. 1997, ApJ, 484, 47