Far-Infrared Source Counts and the Diffuse Infrared Background
Abstract
The cosmic far-infrared background is now well measured from 140 m to 1 mm. Uncertainties remain at 100 m (and even more at 60 m). These are dominated by limitations of the zodiacal model. The nature of sources dominating the background near its maximum are beginning to be studied through deep surveys carried out with ISOPHOT. These surveys show very steep number counts and fluctuations of the background due to unresolved sources.
Institut d’Astrophysique Spatiale, Orsay, 91405, France
1. The Cosmic Far-InfraRed Background (CFIRB)
1.1. Determination of the CFIRB above 100 m: another Approach
In the parts of the sky with no molecular clouds or dense HII regions, the far-IR emission can be written as the sum of dust emission associated with the neutral gas and with the diffuse ionised gas, interplanetary dust emission, the CFIRB, and the cosmic microwave background and its dipole. In previous studies (Puget et al. 1996; Fixsen et al. 1998; Hauser et al. 1998), dust emission associated with the ionised gas which could not be traced independently has been either not subtracted properly or neglected.
Lagache et al. (1999) have for the first time detected dust emission in the ionised gas and shown that the emissivity (which is the IR emission normalised to unit hydrogen column density) of dust in the ionised gas is nearly the same as in the neutral gas. This has consequences for the determination of the CFIRB. Following this first detection, Lagache et al. (2000) have combined HI and WHAM Hα data (Reynolds et al. 1998) with far-IR COBE data in order to derive dust properties in the diffuse ionised gas as well as to make a proper determination of the CFIRB. After careful pixel selection they describe the far-infrared dust emission as a function of the HI and H+ column densities by:
| (1) |
where N(HI) and N(H+) are the column densities normalised to 1020 hydrogen atoms and ions per square centimeter respectively. The coefficients A, B and the constant term C are determined simultaneously using regression fits. They show that about 25 of the IR emission comes from dust associated with the diffuse ionised gas which is in very good agreement with the first determination of Lagache et al. (1999). The CFIRB spectrum obtained using this galactic far-infrared emission decomposition is shown in Figure 1 together with the CFIRB FIRAS determination of Lagache et al. (1999) in the Lockman Hole region. We see very good agreement between the two spectra, as well with the Fixsen et al. (1998) determination (Figure 2). Fixsen et al. (1998) used an infrared tracer for the interstellar component which is equivalent as long as the dust emission spectrum from the diffuse neutral and ionised interstellar gas are very similar. This hypothesis is confirmed by the Lagache et al. (2000) analysis.

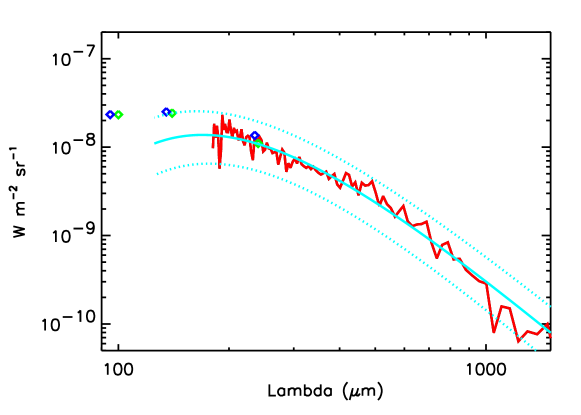
At 140 and 240 m, the values obtained for the CFIRB
are 1.130.54 MJy/sr and 0.880.55 MJy/sr respectively.
For each selected pixel, Lagache et al. (2000) compute
the residual emission, R = IR - AN(HI) - BN(H+).
Uncertainties in the CFIRB have been derived from the width of the histogram
of R (statistical uncertainties derived from the regression analysis are negligible).
The CFIRB values obtained, although much more noisy
(due to the small fraction of the sky used), are in very
good agreement with the determination of Hauser et al. (1998).
At 140 m, the CFIRB value of Lagache et al. (1999) is smaller
than that derived here since the assumed WIM (Warm Ionised
gas) dust spectrum was overestimated (the WIM dust spectrum was
very noisy below 200 m and the estimated dust
temperature was higher).
At 100 m,
assuming an accurate subtraction of the zodiacal emission,
the far-IR emission decomposition gives:
ICFIRB(100)= 0.780.21 MJy/sr. This is the first
time that two independent gas tracers for the HI and the
H+ have been used to determine the background at 100
m.
The CFIRB value of 0.78 MJy/sr can be compared to the non-isotropic residual
emission found by Hauser et al. (1998). The average over three regions
of the residual emission, equal
to 0.730.20 MJy/sr, is in very good agreement with the
determination of Lagache et al. (2000).
So we see, using different approaches, that we are now converging on the shape and level of the CFIRB above 100 m.
1.2. Where are the Main Uncertainties?
There are two main uncertainties in the CIRB (Cosmic InfraRed
Background)
determination in the IR and sub-mm domain:
(1) Dust emission associated with the ionised gas and
(2) Zodiacal emission.
If the spectrum of dust associated
with the ionised and neutral gas is the same, a CFIRB
determination using color ratios should give the same values
as other methods implying independent HI and Hα
gas tracers.
However, one has to note that methods based on
the intercept of the far-IR/HI correlation
for the determination of the CFIRB
are dangerous. For example, for the parts of the sky selected
by Lagache et al. (2000), this intercept is about 0.91 MJy/sr, which
is quite different from the value of the CFIRB.
The zodiacal emission was obtained by Kelsall et al. (1998) relying on its time variability. Other models have been built for the zodiacal emission which is critical to a determination of the CIRB in the near infrared (Wright 2000; Finkbeiner et al. 2000). The accuracy of these models can be estimated by comparing the residuals observed at wavelengths were the zodiacal emission is maximum (12 and 25 m). For example, on the one hand, the Kelsall et al. (1998) model leads to residuals of about Wm-2sr-1 at these wavelengths. On the other hand, upper limits on the CIRB have been established in this wavelength range using TeV gamma rays from extragalactic sources at the level of 10-8 Wm-2sr-1 (e.g., Biller et al. 1995). This is not in contradiction with the estimate of uncertainties in the Kelsall et al. zodiacal model by Hauser et al. (1998), who give only upper limits for the CIRB. Nevertheless this result, together with the fact that the residuals follow a zodiacal emission spectrum, suggests that this best model underestimates the zodiacal emission as the other contributions (instrumental and interstellar) are significantly smaller. We can thus make a conservative estimate of the amount of zodiacal emission which is not removed by this model at 12 and 25 m to be Wm-2sr-1. The amounts not removed at 60 and 100 m are thus Wm-2sr-1 and Wm-2sr-1 (using the Kelsall et al. smooth high latitude zodiacal cloud color ratios). This reduces the CIRB at 100 m from 0.78 to 0.50 MJy/sr. At 60 m the extra zodiacal emission to be removed ( Wm-2sr-1) is comparable to the residuals, and thus no meaningful value can be obtained on the CIRB at this wavelength.
2. Resolving the CFIRB at 170 m
2.1. The FIRBACK Deep Survey
FIRBACK is a survey of 4 square degrees in 3 high galactic latitude fields,
chosen to have as low a HI column-density as possible,
typically , and as much multiwavelength coverage as
possible.
Observations were carried out with the ESA Infrared Space Observatory, ISO, (Kessler et al. 1996)
using the ISOPHOT photometer (Lemke et al. 1996) with the
C200 camera and C160 broadband filter centered at m.
A detailed description of the reduction, data processing, and calibration will be discussed in
Lagache & Dole (2001); the analysis of the complete survey is
discussed in Dole et al. (2001).
Eighty-six sources are detected above the sensitivity limit of the survey (200 mJy, 5).
The number of sources detected above 120 mJy () is 235. The first result of this
survey is the high number of sources observed when compared to
no, or moderate, evolution models for infrared galaxies. Extensive simulations were done to
establish noise properties, incompleteness (80 at 200 mJy) and Eddington bias; the cumulative
number counts were then established from this catalog.
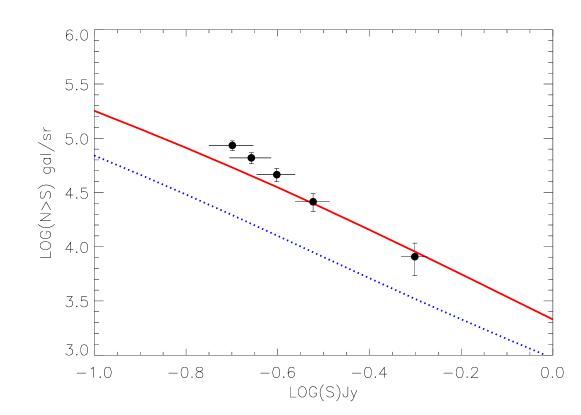
These number counts are extremely steep, , indicating very strong
cosmological evolution of infrared galaxies.
This is illustrated in Figure 3(taken from Dole et al. 2000). Two models from Guiderdoni et al. (1998)
are shown. It can be noticed that the semi-empirical model “E”, which was built to explain the
infrared background, fits the counts well but falls slightly short of explaining the steepness of
the counts.
Number counts in a small field (0.25 square degrees) have already been published (Puget et al.
1999). This field was observed as a “feasibility demonstration” of the FIRBACK survey at a time when
the limitations to weak source detection with ISOPHOT were not yet well understood. The counts given in
Puget et al. (1999)
are compatible with the counts shown in Fig. 3.
Integrating these counts for all sources detected above 120 mJy (3) gives a brightness of 1.6 nW m-2 sr-1 or 8 of the CIRB at 170 m. If we extrapolate the counts to weaker fluxes with a slope -2, we find that the background is fully accounted for by sources brighter than about 10 mJy. As we expect the counts to flatten in a progressive way we predict that the background at 170 m is likely to be dominated by sources of a few mJy.
Considering the rather low angular resolution allowed by a 60 cm telescope at this wavelength, the identification of these sources with optically detected sources is difficult. Starburst galaxies are expected to be radio sources with a well defined ratio of infrared to radio flux. Radio surveys have been carried out in the FIRBACK fields with the VLA for the two northern fields (Ciliegi et al. 1998) and the Australian Telescope for the southern field. Furthermore, 15 m observations have been carried out with the ISOCAM instrument aboard ISO (Oliver et al. 2000). These two sets of observations are the best tools for initiating the identification process when counterparts are available — which is the case for about 50 of our sources. Confirming the identification is best done with ground based millimeter or submillimeter observations with SCUBA, CSO or the IRAM 30 meter telescope. The last step is optical identification using the radio positions if a millimeter or submillimeter detection has confirmed the FIRBACK-radio tentative identification. This process is frustratingly slow. On the one hand, a substantial fraction of the sources are relatively nearby moderate starburst galaxies with bright optical counterparts (redshift less than 0.3, far infrared luminosities of a few 1011 L⊙). On the other hand, a small fraction of the sources have very weak or no optical counterpart and are likely to be associated with distant (redshift larger than 1) ultraluminous starburst or dust enshrouded AGNs.
2.2. The Lockman Hole Survey
A survey of comparable depth has been carried out in the Lockman hole (Kawara et al. 1998; Matsuhara et al. 2000). The number counts at 170 m are in excellent agreement with the counts from the FIRBACK survey. It should be noticed that the Lockman hole is one of the fields with the lowest cirrus content. The agreement in the number counts confirms that, for point sources, the contamination of the extragalactic source counts by small scale cirrus structure is negligible. This is also in agreement with the conclusions of the analysis reported in the next section, which discusses the fluctuations of the background. The difference in the power spectra of the cirrus component and of the extragalactic component leads to a negligible cirrus contribution to the power spectrum at the highest spatial frequencies explored by this survey.
3. The 170 m CFIRB Fluctuations
3.1. Why Search for the CFIRB Fluctuations?
The CFIRB is taken to consist of sources with number counts as a function of flux which can be represented, for the present discussion, by a simple power law:
| (2) |
Obviously, these number counts need to flatten at low fluxes
to insure a finite value of the background. Thus, we assume that =0
for , where is the flux where the counts flatten.
For the simple euclidian case (=1.5), the CFIRB integral
is dominated by sources near and
its fluctuations are dominated by sources which are just below the detection
limit . It is well known that strong cosmological
evolution, associated with a strong negative K-correction, could lead to a very steep
number count distribution (see, for example, Guiderdoni et al. 1998 and Franceschini et al. 1998).
The present far-IR observations indeed show a very steep slope of
=2.2 (Dole et al. 2000). In this case,
the CFIRB integral is still dominated by sources near , but
its fluctuations are now also dominated by sources close to
. Thus, it is essential to study the
extragalactic background fluctuations, which are likely to have a substantial
contribution from sources with a flux comparable to those dominating the
CFIRB intensity (sources that are not just below the sensitivity
limit).
To see if we can detect the CFIRB fluctuations, we need wide field
far-IR observations with high angular resolution and very high signal to noise ratio.
The FIRBACK project fulfills all these conditions.
To search for CFIRB fluctuations, we have first used the so-called
“Marano 1” field, for which we obtained 4 independent coadded
maps which allow us to properly determine the instrumental noise
(Lagache & Puget 2000).
In this field, we have a signal to noise ratio of about 300
and we detect 24 sources
that we remove from the original map.
We first carry out an analysis on this field, and then extend it to the other FIRBACK fields.
3.2. CFIRB Fluctuation Mean Level
FIRBACK maps show background fluctuations which consist of two components that we want to
separate,
galactic cirrus fluctuations and, if present, extragalactic fluctuations.
Our separation of the extragalactic and galactic fluctuations is based on a power spectrum decomposition. This method allows us to discriminate between the two components using the statistical properties of their spatial behaviour. Fig. 4 shows the power spectrum of the “Marano 1” field. In the plane of the detector, the power spectrum measured on the map can be expressed in the form:
| (3) |
where is the instrumental noise power spectrum measured
using the 4 independent maps of the Marano 1 field (Lagache & Puget 2000),
and are the cirrus and
unresolved extragalactic source power spectra respectively,
and is the power spectrum of the point spread function, PSF. For our analysis,
we remove from .

We know from previous work that the cirrus far-infrared
emission power spectrum has a steep slope,
(Gautier et al. 1992; Kogut et al. 1996; Herbstmeier et al. 1998; Wright 1998;
Schlegel et al. 1998; Miville-Deschênes et al. in preparation).
These observations cover the relevant spatial frequency range and have been recently extended
up to 1 arcmin using HI data of very diffuse regions (Miville-Deschênes 1999).
The extragalactic
component is unknown but certainly much flatter (see the discussion in Lagache &
Puget 2000).
We thus conclude
that the steep spectrum observed in our data at 0.15 arcmin-1
(Fig. 4) can only be due to cirrus emission.
The break in the power spectrum at 0.2 arcmin-1 is
very unlikely to be due to the cirrus emission itself which is
known not to exhibit any preferred scale (Falgarone et al. 1998).
Thus, the normalisation of our cirrus power spectrum is directly determined
using the low frequency data points and assuming a dependence.
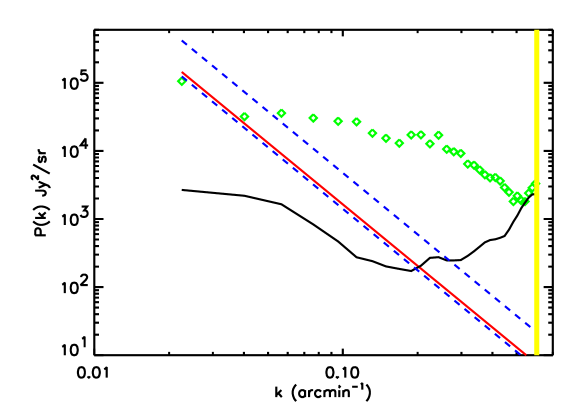
We clearly see in Figure 4 an excess over between
=0.25 and 0.6 arcmin-1, which is more than a factor of 10
at =0.4 arcmin-1. Any reasonable power law spectrum
for the cirrus component multiplied by the footprint
leads, as can be easily seen in Fig. 4, to a very steep
spectrum at spatial frequency 0.2 arcmin-1,
which is very different from the observed spectrum.
Moreover, the excess is more than
10 times larger than the measured instrumental noise power spectrum.
Therefore, as no other major source of fluctuations
is expected at this wavelength, the large excess observed between
k=0.25 and 0.6 arcmin-1 is interpreted as due
to unresolved extragalactic sources.


The Marano 1 field cannot be used to
constrain the clustering of galaxies due to its rather small size.
However, the extragalactic source power spectrum mean level can be determined.
We obtain = 7400 Jy2/sr, which is in very good
agreement with the spectrum predicted by Guiderdoni et al. (1997).
This gives CFIRB rms fluctuations around 0.07 MJy/sr (for
a range of spatial frequencies up to 5 arcmin-1).
These fluctuations are at the 9 percent level,
which is very close to the predictions of Haiman & Knox (2000).
The same analysis can be applied to the other and larger FIRBACK
fields (N1 and N2). Fig. 5 shows the fluctuation
power spectrum () obtained for the FIRBACK/ELAIS N2 field in the plane of the sky.
Again, we clearly see a large excess over .
From Eq. 3, we deduce:
We see in the N1 and N2 fields (Fig. 6 and 7) an
increase by a factor of 5 to 10 of from small to large
scales. This increase cannot be due to cirrus: for example, the removal of
10 times the cirrus leads to the same increase (dashed line in the two figures). So,
it seems that we have with FIRBACK the first indication of IR sources clustering.
Although the present analysis cannot be conclusive on this question, it clearly
shows that the FIRBACK survey has the required sensitivity and is free enough from
contamination to deal with this question.
If we remove from the N1 and N2 maps all detected sources (200 mJy, 5),
we obtain CIB fluctuations which are compatible with a Poissonian
distribution (Fig. 8). We need in fact in this case an independent cirrus
template (like that for the HI gas) to remove the galactic contribution more correctly
and see if correlations are present.

In summary, we have seen that the fluctuations probe the CFIRB dominant source
population. We detect the clustering of the detected FIRBACK sources.
On the contrary, the dominant contribution
to the CIB fluctuations seems to be compatible with a Poissonian distribution.
It is important to note that the level of the extragalactic fluctuations derived from FIRBACK fields is in very good agreement with the Matsuhara et al. (2000, and this conference) study in the Lockman Hole region, where the interstellar dust contamination is negligible. The presence of correlated extragalactic fluctuations should be studied using all the extragalactic ISOPHOT fields and independent cirrus tracers.
References
- 1 Biller, S. D., et al. 1995, ApJ, 445, 227
- 2 Ciliegi, P., McMahon, R. G., & Miley, G. 1998, MNRAS, 302, 222
- 3 Dole, H. 2000, PhD thesis, Paris XI University
- 4 Dole, H., et al. 2001, to be submitted
- 5 Dole, H., Gispert, R., Lagache, G., et al., 2000, in “ISO Surveys of a Dusty Universe”, Lecture Notes in Physics, eds. D. Lemke, M. Stickel, K. Wilke, Springer
- 6 Falgarone, E. 1998, in Starbursts: Triggers, Nature and Evolution, Les Houches School, eds. B. Guiderdoni & A. Kembhavi
- 7 Finkbeiner, D. P., Davies, M., & Schlegel, D. J. 2000, ApJ, 544, 81
- 8 Fixsen, D. J., et al. 1998, ApJ, 508, 123
- 9 Franceschini, A., Andreani, P., & Danese, L. 1998, MNRAS, 296, 709
- 10 Gautier, T. N. III, Boulanger, F., Pérault, M., & Puget, J. L. 1992, AJ, 103, 1313
- 11 Guiderdoni, B., Hivon, E., Bouchet, F., & Maffei, B. 1998, MNRAS, 295, 877
- 12 Guiderdoni, B., Bouchet, B., Puget, J. L., et al. 1997, Nature, 390, 257
- 13 Haiman, Z., Knox, L. 2000, ApJ, 530, 124
- 14 Hauser, M. G., et al. 1998, ApJ, 508, 25
- 15 Herbstmeier, U., et al. 1998, A&A, 332, 739
- 16 Kawara, K., Sato, Y., & Matsuhara, H. 1998, A&A, 336, 9
- 17 Kelsall, T., Weiland, J. L., & Franz, B. A. 1998, ApJ, 508, 44
- 18 Kessler, M. F., et al. 1996, A&A, 315, L27
- 19 Kogut, A., et al. 1996, ApJ, 460, 1
- 20 Lagache, G., et al. 1999, A&A, 344, 322
- 21 Lagache, G., et al. 2000 A&A, 354, 247
- 22 Lagache, G. & Dole, H. 2001, to be submitted
- 23 Lagache, G., & Puget, J-L. 2000, A&A, 355, 17
- 24 Lemke, D., et al. 1996, A&A, 315, L64
- 25 Matsuhara, H., Kawara, K., & Sato, Y. 2000, A&A, 361, 407
- 26 Miville-Deschênes, M. A. 1999, PhD thesis, Paris XI University
- 27 Oliver, S., Rowan-Robinson, M., & Alexander, D. M. 2000, MNRAS, 316, 749
- 28 Puget, J. L., et al. 1996, A&A, 308, L5
- 29 Puget, J. L., et al. 1999, A&A, 354, 29
- 30 Reynolds, R. J., et al. 1998, PASA, 15, 14
- 31 Schlegel, D. J., Finkbeiner, D. P., & Davis, M., 1998, ApJ, 500, 525
- 32 Wright, E. L. 1998, ApJ, 496, 1
- 33 Wright, E. L. 2000, astro-ph/0004192
Discussion
Martin Harwit: While the SCUBA sources might be predominantly at high redshifts, and cannot be ruled out as being at high , the background is so low there that these galaxies are not major factors as far as production of heavy elements or massive star formation is concerned. Otherwise the abundance of chemical elements at high redshifts would be seen to be much higher.
Jean-Loup Puget: Yes. In the model I presented the bulk of the energy comes from redshifts around , as do the heavy elements.
Ray Norris: At higher redshift, metallicity will decrease, so presumably the dust fraction will decrease. To what extent can this account for your observed luminosity evolution?
Puget: The luminosity function I showed is a purely empirical one fitting both the background and the counts at 15, 170, and 850 m. The dust contribution, which should decrease at large , has to be combined with morphology of the galaxies. Local starbursts show much larger extinction than the average one.