BLAST – A Balloon-borne Large Aperture Submillimeter Telescope
A new generation of sub-orbital platforms will be operational in the next few years. These new telescopes will operate from airborne and balloon-borne platforms where the atmosphere is transparent enough to allow sensitive measurements to be made in the submillimeter bands. The telescopes will take advantage of state-of-the-art instrumentation including large format bolometer arrays and spectrometers. Other papers in this volume will deal specifically with the potential of these bands. In this paper will review the capabilities the BLAST balloon-borne telescope.
1 Introduction to BLAST
The “Balloon-borne Large-Aperture Sub-millimeter Telescope” (BLAST) incorporates a 2.0 m mirror with plans to increase to a 2.5 m mirror. The telescope will operate on a Long Duration Balloon (LDB) platform with large format bolometer arrays at 250, 350 and 500 m. BLAST will address some of the most important Galactic and cosmological questions regarding the formation and evolution of stars, galaxies and clusters. It will conduct large-area sensitive Galactic and extragalactic surveys which will: (i) identify large numbers of distant high-redshift galaxies; (ii) measure cold pre-stellar sources associated with the earliest stages of star and planet formation; (iii) make high-resolution maps of diffuse Galactic emission from low to high Galactic latitudes.
The primary advantage of BLAST over existing and planned bolometer arrays such as SCUBA on the JCMT, SHARC on the CSO (including their respective upgrades) and HAWC on SOFIA is the dramatically increased atmospheric transmission at balloon altitudes which results in greatly enhanced sensitivity at wavelengths m. BLAST complements FIRST satellite by overlapping the FIRST frequency coverage and will have the ability to test new technologies for future space-based missions. BLAST is the only instrument with sufficient field of view, sensitivity, and integration time to conduct follow-up surveys of SIRTF/MIPS at 200-400 m.
2 Science Goals of BLAST
BLAST will be the first balloon-borne telescope to take advantage of the bolometric focal plane arrays being developed for FIRST. It will be capable of probing the sub-mm with high spatial resolution and sensitivity providing the opportunity to conduct unique Galactic and extragalactic surveys. Compared to the pioneering flights of PRONAOS , BLAST will have an advantage of times the mapping speed. The scientific motivations for BLAST are similar to those of FIRST and are achievable within 3–5 years with a series of LDB flights.
We expect BLAST to achieve the following science goals:
-
•
Conduct large-area extragalactic 200–500 m surveys and detect and high- galaxies in the test flight and long-duration flights respectively.
-
•
Measure the confusion noise at 200–500 m thereby laying the foundation for future BLAST and FIRST survey strategies. It will also allow a study of the clustering of dust-emitting galaxies over an important range of angular scales.
-
•
Combine the BLAST 200–500 m spectral energy distributions (SEDs) and source counts with those of SCUBA at 850 m. This will determine the redshifts, rest-frame luminosities, star formation rates (SFRs), and evolutionary history of starburst galaxies in the high- universe It will aslo identify the galaxy populations responsible for producing the far-IR background.
-
•
Conduct Galactic surveys of molecular clouds and identify dense, cold pre-stellar (Class–0) cores associated with the earliest stages of star formation. Combining the 200-500 m BLAST data with SCUBA data at 850 m will determine their density and temperature structures which are sensitive to the details of the clouds collapse.
-
•
Survey the diffuse Galactic emission and make detailed comparisons with surveys at longer and shorter wavelengths (CGPS, SCUBA, MSX).
-
•
Observe objects within our solar system including the planets and large asteroids.
3 Extragalactic Surveys
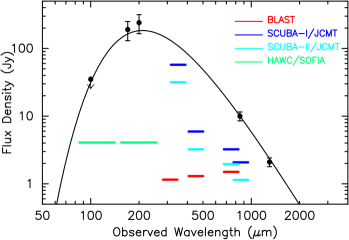
The first extragalactic sub-mm (850 micron) surveys have already been completed by SCUBA covering areas of 0.002–0.12 deg2 with respective depths in the range . Observations of starburst galaxies in the high- universe at sub-mm wavelengths have a particular advantage compared to the optical and FIR due to the strong negative k-correction which enhances the observed sub-mm fluxes by factors of 3–10 at (Figure 1). The combination of SCUBA surveys with the necessary shorter wavelength sub-mm data from experiments like BLAST (and later from FIRST) will provide powerful constraints on our understanding of the models and processes by which galaxies and clusters form and subsequently evolve. The following preliminary results from SCUBA surveys (see other contributions to this Proceedings) alone have already made a significant impact on several cosmological questions and have demonstrated the importance of further shorter wavelength sub-mm cosmological studies:
-
•
Approximately 30–50% of the FIR–sub-mm background detected by COBE has been resolved into individual galaxies at flux densities mJy. Existing surveys, which are confusion-limited at about this flux level, are within a factor of only a few in sensitivity of resolving the entire sub-mm/FIR background.
-
•
Sub-mm sources generally appear to be associated with optical and weak radio galaxies, although there is still much debate about the fraction of sources at .
-
•
The faint sub-mm source-counts at 850 m are reasonably well determined between 1–8 mJy and significantly exceed a no-evolution model, requiring roughly evolution out to , but with little constraint at higher redshifts.
-
•
At high-redshift () the sub-mm surveys appear to find times the star formation rate observed in the optical surveys, although the effects of dust obscuration and incompleteness in the optical are still debated.
3.1 Why an LDB experiment at 200–500 m?
Detailed interpretation of the sub-mm sources is severely hindered by uncertainties in their redshift distributions and luminosities. These uncertainties result directly from the sub-mm positional errors of that are typical for even the highest S/N sub-mm detections, and from the lack of sub-mm data measuring the redshifted FIR spectral peak at 200–450 m .


This ambiguity in the redshift of individual sub-mm sources will be resolved with the BLAST surveys. The complementary depths of the BLAST 200-500 m and SCUBA 850 m surveys provide a measure of the 200/850 m flux ratio, which is an extremely powerful and independent diagnostic of the redshift (Figure 2). For example if there are 5 SCUBA sources ( mJy) with no BLAST 5 counterparts at 300 m, i.e. mJy, then the 300/850 m flux ratio must be . This implies that the sub-mm source must be a galaxy at for all typical starburst SEDs.


3.2 Predicted Source-counts and Extragalactic Confusion
The BLAST surveys will measure the surface-density of the brighter sources (20–1000 mJy) at m, extending the flux range of the sub-mm source-counts from to . This will allow an accurate determination of the model that describes the evolution of high- starburst galaxies . A prediction of the 200–m source-counts can be derived from preliminary evolutionary models that fit the observed counts at FIR and sub-mm-wavelengths (Figure 3).
Due to extragalactic sources, SCUBA 850 m surveys with 15′′ resolution are confused at a depth of which corresponds to a source density . Extrapolation to shorter wavelengths implies that confusion at m will begin to become significant at –mJy. Representative estimates of the extragalactic 3 confusion noise at 300–500 m are 30 mJy for a primary mirror diameter of 2.0 m (appropriate for the test-flight) and 25 mJy for a 2.5 m primary (planned for the LDB flight). The initial BLAST surveys will measure the true confusion level and hence will influence the strategies for both future BLAST and FIRST surveys at 200–500 m. A statistical analysis and correlation analysis of the noise in our surveys will yield information on the source counts well below the conventional confusion limit.
During the first 6 hour test flight BLAST may conduct a extragalactic survey of the Lockman Hole and ISO ELAIS regions at 300–750 m with a 1 sensitivity of mJy. The alternative surveys outlined in table 3.1 will detect similar numbers of galaxies at the different flux levels, and therefore we can choose to match the BLAST surveys to the coverage of the existing and future 850 m SCUBA and 1100 m BOLOCAM/CSO surveys in addition to the future high-resolution deep AXAF and XMM surveys of these regions (Figure 4). The X-ray follow-up data are crucial for determining the fraction of AGN in such samples .
By combining these data with mid-IR observations from SIRTF we can accurately measure the spectral energy distributions across the rest-frame FIR peak, constrain the redshifts, bolometric luminosities, SFRs and evolutionary history of high- starburst galaxies. Together with a deep 20 cm VLA survey , deep near-IR and optical imaging, we will determine the nature of the population of high- galaxies that contribute the dominant fraction of the extragalactic FIR-mm background.
| 6 hour 300 m test-flight survey strategies: D=2.0 m, | ||||||
|---|---|---|---|---|---|---|
| survey area | 1 depth | no. of pixels | no. of detected galaxies | no. of galaxies | ||
| (sq. degrees) | ||||||
| 0.24 | 7 mJy | 2352 | 120 | 34 | 110 | 18 |
| 0.55 | 10 mJy | 4800 | 150 | 40 | 135 | 20 |
| 1.1 | 15 mJy | 10800 | 135 | 30 | 125 | 16 |
| 4.4 | 30 mJy | 43200 | 120 | 30 | 110 | 13 |
| 50 hour 300 m LDB survey strategies: D=2.5 m, | ||||||
|---|---|---|---|---|---|---|
| survey area | 1 depth | no. of pixels | no. of detected galaxies | no. of galaxies | ||
| (sq. degrees) | ||||||
| 1.7 | 5 mJy | 16777 | 1420 | 450 | 1300 | 250 |
| 3.3 | 7 mJy | 32884 | 1670 | 480 | 1530 | 250 |
| 6.8 | 10 mJy | 67111 | 1870 | 500 | 1680 | 250 |
| 15.4 | 15 mJy | 151000 | 1890 | 420 | 1740 | 220 |
| 61.6 | 30 mJy | 604000 | 1680 | 420 | 1530 | 180 |
4 Galactic Plane Surveys
Over the last decade, sub-mm astronomy has revealed a class of heavily embedded, pre-stellar cores that are “invisible” or faint at FIR wavelengths, and yet are relatively strong sub-mm sources . These low-mass Class 0 and Class I sources are beginning their main accretion phase prior to collapse, and hence represent the earliest and most exciting stages of star-formation. The mechanism by which these young, accreting protostars form and evolve is still poorly understood. BLAST will carry out a significant unbiased census of star-forming cores in a large number of molecular clouds as part of a sensitive large-area Galactic plane survey.
By conducting the BLAST survey in fields previously observed by IRAS and ISO, and in the future with SIRTF and SOFIA, we can determine the relative fraction of Class 0 and Class I sources. This fraction will indicate the dynamical timescale for accretion and subsequent collapse. We can also trace how this fraction changes with the level of overall star formation in different molecular cloud complexes, since the environment of the parent cloud (ionization field, shocks, turbulent fragmentation) is expected to effect the early evolution of the condensing cores.
Figure 5 illustrates that BLAST will have sufficient sensitivity at 300-450 m to detect the pre-stellar and protostellar clumps within individual molecular clouds and to measure the radial density profiles in the extended envelopes of the protostars. These will discriminate between thermally-supported or magnetically-supported cores. Molecular lines provide powerful signatures of infall and the BLAST LDB surveys will provide a dramatic increase in the statistical samples of pre-stellar cores for spectroscopic follow-up at mm-wavelengths.
These data will measure the variations in column densities and sub-mm spectral indices which reflect variations in the temperatures (10–30 K) and/or dust emissivity () within the star forming envelopes . The combination of longer wavelength surveys (e.g. SCUBA/JCMT at 850 m and BOLOCAM/CSO at 1100 m), and short sub-mm wavelength data (BLAST at 350, 250 m) can resolve this ambiguity since BLAST will be more sensitive to temperature variations of the cold dust (T K). Having determined the dust temperature we can then estimate the mass and luminosity distribution of the pre-stellar clumps.
Although the origin of the stellar initial mass function is not well understood, it is probably determined at the earliest stage of pre-stellar collapse, so it is important to have a large, complete sample of Class 0 cores. In 6 hours BLAST will conduct a 50 deg2 300 m survey of molecular clouds, including Orion, Taurus and Ophiuchus, with a 3 sensitivity of 300 mJy. This is equivalent to a mass sensitivity M⊙.
5 LDB Surveys
The 250 hour LDB flights will concentrate on larger and deeper surveys of Galactic and extragalactic target regions. The increased observation time and the planned addition of a larger primary will increase sensitivities and resolution while lowering confusion limits, thereby improving the statistics of the sub-mm source-counts. In particular, increased counts at faint flux levels will provide the best discrimination between the possible evolutionary models and will follow up on the more extensive SCUBA, SIRTF, AXAF and XMM surveys. As Table 3 indicates, the improved instrument will detect thousands of high- galaxies during one of several 50 hour surveys in a single LDB flight. Possible LDB extragalactic survey targets include: (i) for Northern hemisphere flights, the Lockman Hole, and ELAIS N2, ELAIS N1, the HDF-North and flanking fields and future LMT 1100 m surveys; (ii) for Southern hemisphere flights, the MARANO field and the HDF-South.
We will also survey a large () fraction of the Galactic plane concentrating on regions undergoing high and low-mass star formation.
6 Instrument
The design and specifications of BLAST are driven by science goals, availability of existing instrumentation and the practical limitations of ballooning. The following sections describe the instrumental requirements needed to meet the science goals.
The decision to use an LDB platform for this experiment takes into consideration a combination of sensitivity, cost, and time-scale. When comparing this experiment to ground-based or airborne observations, the clear advantage is greater atmospheric transmission (Figure 6) at balloon altitudes (35-40 km). The high atmospheric emission at lower altitudes (SOFIA and SCUBA) limits the instrument sensitivity and, in some of the higher frequency bands, makes the measurement virtually impossible without the use sub-orbital and orbital platforms.

6.1 Optical Design:
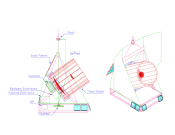
The BLAST gondola is designed to hold a mirror up to 2.5 m in diameter. The test flight will use a 2.0 m spherical mirror currently being fabricated as part of the FIRST development. A schematic of the gondola and telescope is shown in Figure 7. The secondary mirror will be designed to give diffraction limited performance over a FOV at the Cassegrain focus at m. The estimated antenna efficiency is and is determined by a combination of the 10 m rms surface roughness of the primary and the quality of the re-imaging optics.
| Telescope: | Temperature | 300K (230K for North American Flight) |
| Used diameter | 1.9 m (secondary mirror is pupil stop) | |
| Emissivity | 0.04 | |
| Detectors: | Bolometer optical NEP | |
| Bolometer quantum efficiency | 0.8 | |
| Bolometer feed-horn efficiency | 0.7 | |
| Throughput for each pixel | feed-horns) | |
| Bolometers: | Central wavelengths | 250 350 500 m |
| Number of pixels | 149 88 43 | |
| Beam FWHM | 30 41 59 arcseconds | |
| Field of view for each array | 6.5 x 13 arcminutes | |
| Overall instrument transmission | 30% | |
| Filter widths () | 3 | |
| Observing efficiency | 90% |
Radiation from the telescope will enter the cryostat through a 5–6 cm diameter vacuum window near the Cassegrain focus. We will use a telescope focal ratio of f/5 to place the position of the focus 20 cm behind the central hole in the primary. The window will be made from 50 m thick polypropylene that has 0.1% loss. Blocking filters at the intermediate cold stages of 77 K and 20 K will reduce the radiation loading on the LHe to 10 mW.
| Band (m) | 250 | 350 | 500 |
| Backgrnd. power (pW) | 25.6 | 18.3 | 13.5 |
| Backgrnd.-lim. NEP | 20 | 14 | 10 |
| NEFD mJy- | 236 | 241 | 239 |
| (1 deg2) mJy | 38 | 36 | 36 |
| (1 deg2) mJy | 15.5 | 14.7 | 14.6 |
The radiation will be re-imaged onto the detector arrays using a pair of cooled off-axis parabolic mirrors arranged in a “Gaussian beam telescope” configuration. This configuration makes additional corrections for aberrations in the main telescope and provides a flat focal plane with phase centers independent of wavelength for single mode Gaussian beams. A cold aperture or Lyot stop will be located between the two re-imaging mirrors at the position of an image of the primary mirror to provide additional sidelobe rejection. The second parabolic mirror has a focal length equal to its distance from this aperture to insure that all of the detectors in the array have illumination centered on the Lyot stop. The off-axis angle of the final re-imaging mirror allows us to place dichroic beam splitters in front of the focal plane making possible simultaneous measurements by different arrays at different wavelengths. For the first flight of BLAST, we plan to use detector arrays similar to those being developed for the SPIRE instrument on FIRST.
6.2 Detectors.
The BLAST focal plane will consist of arrays of 149, 88 and 43 detectors at 250, 350, and 500 m respectively. The detectors will be silicon nitride micromesh (“spider-web”) bolometric detectors coupled with feedhorn arrays. The detector and feedhorn technology is well established and has been tested using the BOLOCAM instrument in late 1999. The sensitivity of the detectors is limited by photon shot noise from the telescope and atmospheric emission. Table 2 gives the telescope and detector parameters. We estimate a total emissivity for the warm optics of % dominated by blockage from the secondary mirror and supports. We estimate the optical efficiency of the cold filters and optics to be based on measurements with similar bolometers coupled to horn arrays at millimeter wavelengths in the BOLOCAM test dewar. The estimated detector NEFD’s assuming a 10% bandwidth are given in Table 3
7 Conclusion
BLAST will be the first balloon-borne instrument to take advantage of a new generation of bolometric arrays. The transparency of the atmosphere at balloon altitudes will allow it to observe in the sub-millimeter band where measurements are difficult from the ground. The combination of state-of-the-art detectors on a sub-orbital observing platform will give us the opportunity to collect data which will revolutionize our view of the sub-millimeter sky. This class of intermediate missions will provide an integral step in our understanding of this field in the pre–FIRST era. After an initial test flight in 2002, the instrument will have its first Long Duration Balloon flight from Antarctica in 2003.
References
References
- [1] Andre, P., Ward-Thompson, D.W., Barsony, M., 1993, ApJ, 406, 122
- [2] Almaini, O., Lawrence, A., Boyle, B.J., 2000, MNRAS, 314, 138
- [3] Bachiller R., Tafalla M., 1999, in The Origina of Stars and Planetary Systems”, eds. C.J. Lada, N.D. Kylafis, Kluwer, Dordrecht, 227
- [4] Beichman, C.A., Myers, P.C., Emerson, J.P., 1986, ApJ, 307, 337
- [5] Blain, A.W., Smail, I, Ivison, R.J., Kneib, J.P., 1999, MNRAS, 302, 602
- [6] Bock, J.J., Glenn, J., Grannan, S.M., Irwin, K.D., Lange, A.E., Leduc, H.G., Turner, A.D., 1998, Proc. SPIE, 3357, 297-304
- [7] Bock, J.J., Leduc, H.G., 1997, The Far Infrared and Submillimetre Universe, Ed. Wilson, A., 349
- [8] Borys, C., Chapman, S., Scott, D., 1999, MNRAS, 308, 527
- [9] Chandler C.J., Richer J.S., 2000, ApJ, 530, 851
- [10] Chapman, S.C., Scott, D., Borys, C., Fahlman, G.G., 2000, submitted to MNRAS, astro-ph/0009067
- [11] Ciliegi, P., McMahon, R.G., Miley, G., Gruppioni, C., Rowan-Robinson, M., Cesarsky, C., Danese, L., Franceschini, A., Genzel, R., Lawrence, A., Lemke, D., Oliver, S., Puget, J.L., Rocca-Volmerange, B., 1999, MNRAS, 302, 222
- [12] Griffin M., Swinyard B., Vigroux L., 2000, in Munich SPIE Symposium, in press
- [13] Guiderdoni, B., Hivon, E., Bouchet, F.R., Maffei, B., 1998, MNRAS, 295, 877
-
[14]
HAWC WWW page,
- [15] Holland, W.S., Robson, E.I., Gear W.K., Cunningham, C.R., Lighfoot, J.F., Jenness, T., Ivison, R.J., Stevens, J.A., Ade, P.A.R., Griffin, M.J., Duncan, W.D., Murphy, J.A., Naylor, D.A., 1999, MNRAS, 303, 659
- [16] Hughes, D., Serjeant, S., Dunlop, J., Rowan-Robinson, M., Blain, A., Mann, R.G., Ivison, R., Peacock, J., Efstathiou, A., Gear, W., Oliver, S., Lawrence, A., Longair, M., Goldschmidt, P., Jenness, T., 1998, Nature, 394, 241
- [17] Hunter, T.R., Benford, D.J., Serabyn, E. 1996, PASP, 108, 104
- [18] Lagache, G., Abergel, A., Boulanger, F., Puget, J.L., 1998, A&A, 333, 709
- [19] Lamarre, J.M., Giard, M., Pointecouteau, E., Bernard, J.P., Serra, G., Pajot, F., Desert, F.X., Ristorcelli, I., Torre, J.P., Church, S., Coron, N., Puget, J.L., Bock J.J., 1998, ApJ, 507, L5
- [20] Lilly, S., Eales, S., Gear, W.K., Hammer, F., Le Fevre, O., Crampton, D., Bond, R., Dunne, L., 1999, astro-ph/9901047, in press
- [21] Mardones, D., Myers, P.C., Tafalla, M., Wilner, D.J., Bachiller, R., Garay, G., 1997, ApJ, 489, 719.
- [22] Puget, J.L., Lagache, G., Clements, D.L., Reach, W.T., Aussel, K., Bouchet, F.R., Cesarsky, C., Desert, F.X., Dole, H., Elbaz, D., Franceschini, A., Guiderdoni,B., Moorwood, A.F.M., 1999, A&A, 345, 29
- [23] Scott, D., Lagache G., Borys C., Chapman S.C., Halpern M., Sajina A., et al., 2000, A&A, 357, L5
- [24] Smail, I., Ivison, Blain, A.W., 1997, MNRAS, 490, L5
- [25] Ward-Thompson, D.W., Scott, P.F., Hills, R.E., Andre, P., 1999, MNRAS, 305, 143