A Large-Scale Jet and FR I Radio Source in a Spiral Galaxy: The Host Properties and External Environment
Abstract
We have identified a large ( kpc), powerful double radio source whose host galaxy is clearly a disk and most likely a spiral. This FR I-like radio galaxy is located very near the center of the Richness Class 0 cluster Abell 428. The existence of such an object violates a fundamental paradigm for radio loud AGN’s. In paper I (Ledlow,Owen, & Keel,1998,ApJ,495,227), we showed that this object was most consistent with a spiral host classification with optical emission-line ratios and colors suggestive of an active nucleus. However, we were not able to confirm actual radio jet emission based on the maps available at that time. In this paper, we present new, higher resolution radio imaging, a radio/mm continuum spectrum for the nucleus, a detection of HI absorption against the bright radio core, an upper-limit to CO emission and the gas mass, and 70 (68 new) optical redshifts measured in the direction of Abell 428. We confirm the existence of a radio jet at 20cm, extending 42 into the southern lobe. At 3.6cm, we also detect a nuclear jet similar in length to that in M87, although 10 times weaker. We believe that this is the first detection of a radio jet on these scales in a disk/spiral host galaxy. The nuclear radio spectrum is similar to many blazar or QSO like objects, suggesting that the galaxy harbors an imbedded and obscured AGN. We model a turnover in the spectrum at low frequencies as a result of Free-Free absorption. We detect very strong and narrow HI absorption, with nearly the entire 20 cm continuum flux of the core being absorbed, implying an unusually large optical depth (). The most consistent model is that we are viewing the nucleus through a disk-like distribution of gas in the ISM, possibly through a spiral arm or a warp to account for the above average column density. From the radial velocity distribution, we find that Abell 428 is in fact made up of at least 2 clumps of galaxies separated by km sec-1, which themselves appear to be imbedded in a nearly continuous distribution of galaxies over 13000 km sec-1in velocity space. Thus, the environment around this unusual radio source is more like that of a poor galaxy group imbedded in a filament-like structure viewed end-on.
1 Introduction
It has been a standard paradigm and accepted fact for some time that giant double-lobed, jet-fed radio sources (Fanaroff & Riley types I or II; Fanaroff & Riley (1974)) are hosted by elliptical galaxies or distorted versions thereof (i.e.such as merger remnants). The reasons for such a strong correlation between the AGN phenomena and galaxy type has been interpreted as telling us something about the central engine and black holes in different hosts. Alternatively (or additionally), the strong morphological correlation may be related to the fragile jets being disrupted by the dense, rich ISM in spiral galaxies. The fact that nuclear jets are a common feature in Seyfert galaxies is a strong argument for the latter (Baum et al., 1993).
While there have been a number of possible counterexamples to the elliptical/spiral dichotomy, they have all turned out to be either source misidentifications or gas-rich merger products more consistent with an elliptical or bulge-dominated host to the imbedded AGN (such as 3C305, Heckman et al. (1985)). However, in Paper I (Ledlow, Owen, & Keel, 1998), we presented the discovery of 0313-192 in Abell 428, which appears to be the first confirmed case of a powerful ( W Hz-1) double radio source in a clearly disk-dominated host. This object was found from a radio survey of more than 500 Abell clusters (Owen & Ledlow (1997), and references therein). From additional optical and NIR observations, the galaxy appears to contain a Seyfert or narrow-line AGN. The intrinsic luminosity, however, is not known due to possibly significant line-of-sight reddening as the galaxy is seen nearly edge-on. Evidence supporting the spiral classification includes a measured rotation curve from both O[III] and H, a dust-lane bisecting the inner bulge, structure suggestive of spiral (or ring-like) structure from deep B-band imaging, surface-brightness profile decomposition showing a very strong disk component, and a nearly perfect agreement with the predicted B-band Tully-Fisher relation for a Sa-Sb type galaxy. In addition to a probable imbedded AGN, the emission-line ratios in the disk are consistent with typical disk HII regions excited by OB stars. And interestingly, 0313-192 appears not to be involved in any type of merging event.
Aside from being intrinsically interesting in itself, 0313-192 offers a potential testbed for understanding the whole issue of why spirals generally do not produce powerful jets and double radio sources, which could have an impact on blackhole, jets, and AGN physics from many different angles. While all available evidence would seem to suggest a spiral classification for the host galaxy and an FR I-like radio source, Ledlow, Owen, & Keel (1998) were unable to confirm the presence of extended, large-scale jet emission in 0313-192. With the goal of looking for both the inferred jets and additional properties which might explain the peculiar nature of this object, we have reobserved 0313-192 with the VLA at both higher resolution and sensitivity. In this paper we report the results of these observations as well as a search for HI and CO (sections 2.1-2.3), a radio continuum spectrum of the nucleus ( section 2.4), and multifiber spectroscopic observations of the cluster field to understand the properties of the external environment (section 3). We discuss the nature of this source as gleaned from these observations in section 4, and summarize with our conclusions in section 5.
2 Radio Observations
2.1 VLA Imaging
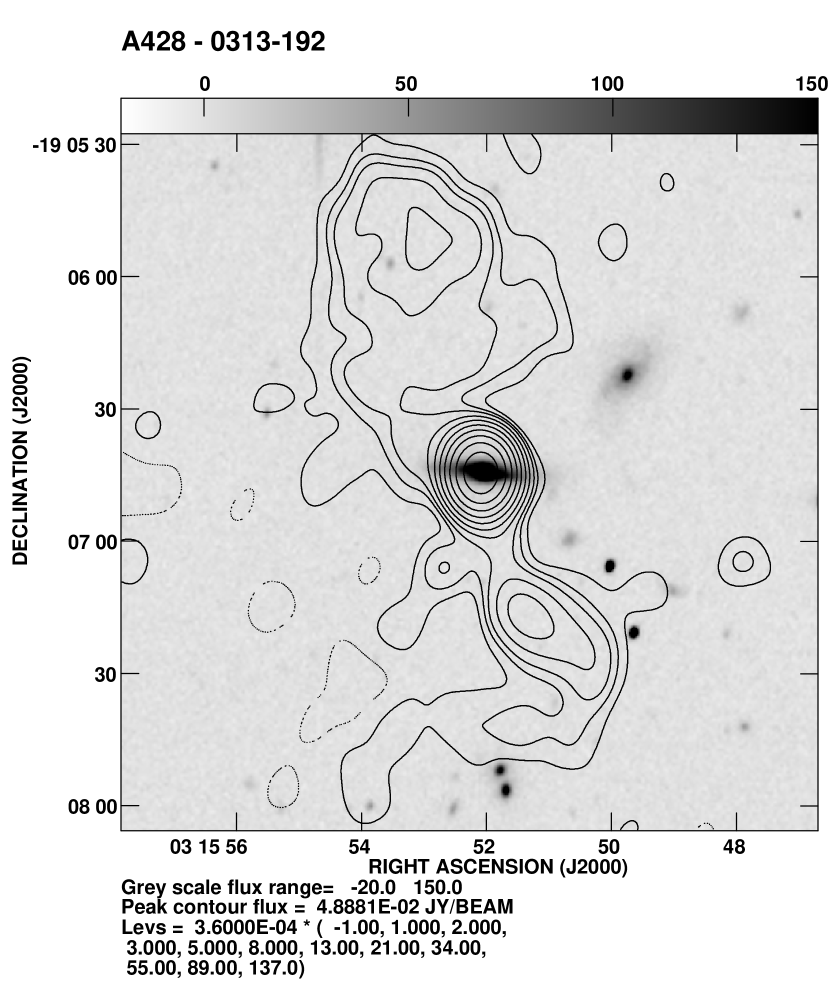
We reproduce the VLA image and optical (R-band) overlay of 0313-192 from Ledlow, Owen, & Keel (1998) and Owen & Ledlow (1997) in Figure 1. This image was produced from VLA snapshots in both the B and C-arrays, with a resultant beam of at PA=-1.9∘. The two lobes extend 100 kpc both north and south of the galaxy. We measure a total flux density of 98 mJy on this map, nearly half (48 mJy) originates in the unresolved core. The northern radio lobe measures 32 mJy, the southern lobe 18 mJy. From both the morphology and the measured radio power (), we classify 0313-192 as a FR I radio galaxy. The morphology is very similar to the “fat-double” class. The host galaxy is nearly the faintest radio source in our complete survey of Abell clusters (Ledlow & Owen, 1996), and the only one consistent with a spiral/disk morphology. While at this resolution we do not detect actual jet emission, the nature of the radio morphology would certainly imply the existence of jets as a necessary mechanism for filling the large-scale lobes. We can rule out star formation as the origin of the radio emission based on the radio/FIR relation and -value (Helou, Soifer, & Rowan-Robinson, 1985). Ledlow, Owen, & Keel (1998) found (as compared to for star formation). The optical and radio cores align to better than 1.
We report new VLA observations from 4,5 November 1996 in the A configuration. We observed 0313-192 for 4.3 hours at 3.6 cm (X-band) using the continuum correlator and a 50 MHz bandwidth, and for 4.3 hours at 20cm (L-band) with the spectral-line correlator (4IF mode; 7 channels at 3.125 MHZ with 2 IF’s and 2 polarizations), with a total effective bandwidth of 43.7 MHz over each IF sideband. The noise-level on the maps are 13 Jy and 24 Jy at 3.6 and 20 cm respectively. We used the source 0432+416 (8.6 Jy at 20cm) as the bandpass calibrator. The resultant beams are at PA=-6.1∘ at 20cm and at PA=3.2∘ at 3.6cm. We also observed 0313-192 on 11 October 1997 in the hybrid DnC configuration at 20cm with resolution 28 arcsec. Total on-source integration was 2 hours. The observations were once again made in the 4IF spectral-line mode in order to minimize bandwidth smearing and to allow for easier removal of interference. The RMS noise on the map is 36 Jy. In all cases we used 3C48 as the primary flux calibrator. All datasets were CLEANed and self-calibrated using the AIPS (Astronomical Imaging Processing System) software package.
In Figure 2 we show the low-resolution 20cm image of 0313-192 from the DnC configuration. The image is tapered to a beam-size of in order to bring out the low surface brightness emission in the lobes. In comparison to Figure 1, we actually see that the lobes are likely more extended than previously thought. From the map in Figure 2, we estimate a size of kpc (281 arcsec), extending from a declination of to . We measure an integrated flux-density of 106 mJy from this image (as compared to 98 mJy from the map in Fig 1), corresponding to a radio power of W Hz-1. At this radio power, 0313-192 is actually substantially bigger (by a factor of 3) than predicted from the Power-Size diagram for both cluster and non-cluster radio galaxies (Ledlow, Owen, & Eilek, 2000). In the radio-optical luminosity plane, 0313-192 lies exactly on the dividing line between FR I and FR II sources, and hence at the upper-extreme of FR I properties for the host luminosity.
We show the A-array high-resolution maps in Figures 3 and 4. In Figure 3, we show the 3.6cm image, indicating clear evidence for a nuclear jet oriented 143∘ to the SW (measured North to West). The jet is 1.6″ in length measured from the core to hot-spot, or 1.9 kpc. At 0.3″/beam, our resolution is 316 pc. We estimate a flux-density for the jet of 729 Jy at 3.6cm corresponding to W Hz-1. This jet is nearly identical in length to the M87 jet, although it is 10 times fainter (Owen, Hardee, & Cornwell, 1989; Meisenheimer, 1999). While nuclear jets are frequently seen in Seyfert galaxy samples (spiral hosts), the size of these jets are nearly always much smaller than seen in 0313-192, typically of order pc to hundreds of pc (Kukula et al., 1999, 1995; Ulvestad, Antonucci, & Goodrich, 1995). Thus, even on the kpc-scale, 0313-192 appears unlike the typical radio source found in an AGN/spiral-host.
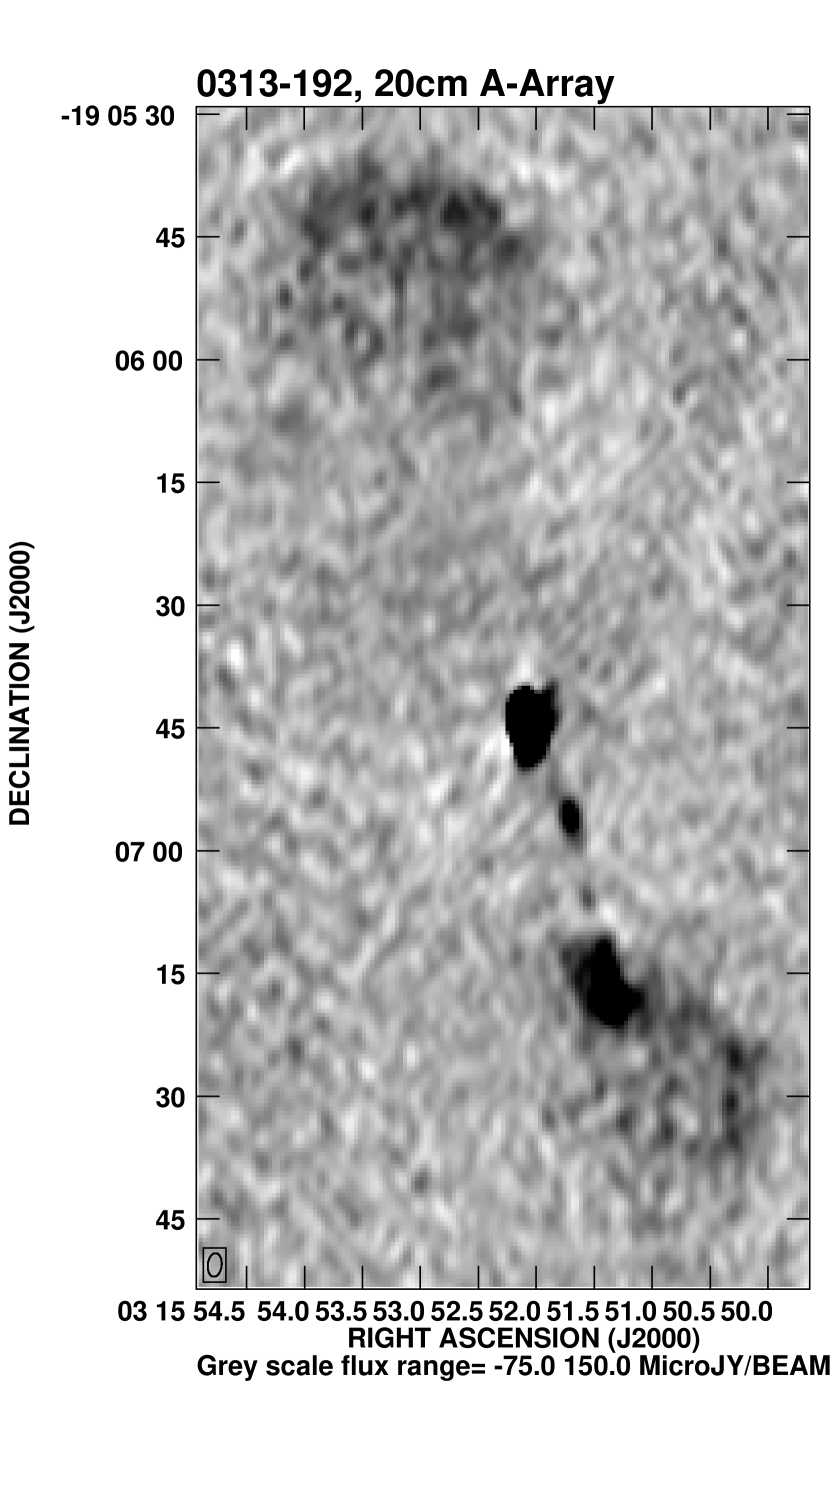
In Figure 4, we show the 20cm A-array image in grey-scale. While the lobe emission is mostly resolved out, the main feature in this image is the jet and hot-spots. Measured from the core to the hot-spot in the southern lobe, the jet extends 36″or 42 kpc in length! The distance from the core to the nearest hot-spot is 12.7″ or 14.8 kpc. We estimate a total integrated flux-density of 3.7 mJy (including the hot-spot at the end of the jet in the southern lobe), or W Hz-1. If one were to connect back to the nuclear jet seen in the 3.6cm image, it appears that the jet bends, or changes its position angle from 143∘ to 154∘ at the middle hot-spot to 167∘ at the hot-spot within the southern lobe. There is another, fainter knot within the jet at 23″ or 27 kpc from the core. We see no evidence for a jet to the north to the limit of our sensitivity. The detection of this large-scale jet/lobe morphology unambiguously confirms our classification of this object as an FR I radio galaxy, and makes 0313-192 unique in this regard because it is found in a spiral/disk host galaxy.
2.2 HI Absorption
We obtained an HI aperture synthesis observation of 0313-192 with the VLA in the D configuration on 24 October 1997. Only 19 antennas were available for the observations. 3C 48 was observed as the primary flux calibrator, and 0237-233 (6.5 Jy) was observed approximately every 45 minutes for the bandpass calibration as well as for short term gain and phase calibration. The 64 spectral channels span a 3.125 MHz bandpass centered at = 20100 km sec-1, with a spectral resolution of 48.8 kHz (11.2 km sec-1channels and a total bandwidth of 717 km sec-1.). We observed 0313-192 for 130 minutes, producing a synthesized beam of at PA=-66∘. The RMS noise of the spectrum is 1.2 mJy beam-1. The data were calibrated and imaged using standard reduction procedures in AIPS.
The HI spectrum is shown in Figure 5 at four separate positions, with (0,0) being the position of the radio core. Three other spectra are included for comparison. The (+810,+180) spectrum (top) is for a 13.4 mJy unresolved continuum source at an offset position of +810″ in RA and +180″ in DEC. This spectrum demonstrates the flatness of the bandpass. The other two offset positions are roughly along the radio jet, with continuum flux densities of 18.6 mJy beam-1 and 10.0 mJy beam-1 for the North and South offsets respectively. The non-detection of optically thick HI absorption at the offset positions sets an upper-limit to the size or extent of the absorber along the direction of the jet (i.e., we are not looking through an extended halo of HI gas).
The peak absorption occurs at km sec-1, at a depth of 34.01.2 mJy beam-1 below the continuum. Thus, nearly the entire 20cm core continuum flux ( 35.1 mJy - see 2.3) is absorbed. The FWHM of the line is only 34 km sec-1 with a measured equivalent width of 32 km sec-1. The apparent optical depth for this narrow absorption feature is then . Since the peak absorption occurs in a single channel, it seems likely that the actual is even larger. We convert the optical depth to an HI column density from the relation
| (1) |
where is the electron spin temperature, is the fraction of the continuum source covered by the absorber, and is the velocity width (we use the FWHM = 34 km sec-1). The narrow width suggests that the gas is cold (based on kinematics). In high density regions, approaches the kinetic temperature (). In the radiation field of an AGN, irradiated clouds can have a much higher , which may suppress HI absorption from an obscuring torus (Gallimore et al., 1999). However, HI studies in general are most sensitive to the coldest regions of clouds which have the highest densities. With typical narrow-line conditions the high density results in a collisionally dominated gas which drives . Thus, appears to hold up under a broad range of conditions (Maloney, Hollenbach, & Tielens, 1996). It is of course possible that the HI absorption originates in a warmer atomic medium in the AGN environment, in which case and might approach several thousand Kelvin before hydrogen is significantly ionized (Gallimore et al., 1999). Thus, K provides a lower-limit to the true HI column. With these values we estimate cm-2. One finds nearly the same value considering the absorption only in a single channel (=11 km sec-1, but with an apparent optical depth of !). As we are limited in both spatial and velocity resolution, the observed narrow feature would suggest that the actual column density is likely much higher (). Note, that this places 0313-192 at the upper extreme of observed column densities in Seyfert galaxy samples. The apparent optical depth is nearly unprecedented.
Optical depths are very rarely seen in general, which may make 0313-192 somewhat unique in yet another respect. While higher resolution is clearly needed, these results suggest that the absorbing gas has to be of high density, and/or we are privileged to have a sight line through the disk which maximizes the amount of absorbing gas. The small line width also suggests we are looking at dynamically cold gas. The line width in particular places fairly strict limits on the location of the gas relative to the nucleus because of the depth of the potential and the radius probed by the absorption. The HI absorption properties of 0313-192 bears some resemblance to the model for MRK 6 from Gallimore et al. (1999) – a disk-like distribution of cold gas seen against a bright radio core. The majority of HI absorption systems associated with AGN hosts show line widths in excess of 50 km sec-1because the absorption occurs fairly close to the nuclear region, and also because the line-of-sight passes through a large range in radius (and corresponding velocity gradient). The much narrower width we see for 0313-192 would suggest we are not looking at gas close to the nucleus, but rather gas originating in the ISM. The HI spectrum of 0313-192 is remarkably similar to that seen for Sgr A∗, km sec-1 (Liszt, Burton, & van der Hulst, 1985; Falcke et al., 1998), despite the difference in galaxy inclination ( for 0313-192). With our present spatial resolution it is difficult to know precisely the origin and location of the absorbing media. The high optical depth and column density argue that we might be looking through a spiral arm feature or a warp, that would increase the amount of line-of-sight absorption over a typical location in the disk viewed from this angle. Alternatively, we could be looking through a dense cloud. Dickey et al. (1983) find a number of line-of-sight positions through the galactic plane at with equivalently high column densities. Thus, we may be looking through the ISM of a fairly normal spiral galaxy not unlike our own. If there are any doubts as to the optical morphology of the host galaxy, these observations would suggest an additional argument in favor of a spiral host.
2.3 CO Observations
An aperture synthesis CO observations of 0313-192 was carried out with the Owens Valley Millimeter Array (OVRO) on 26 May, 1997. There were six 10.4 m diameter telescopes in the array, providing a field of view of about 65″ (FWHM) at 108 GHz. The telescopes are equipped with SIS receivers cooled to 4 K, and the typical single sideband system temperature was about 350 K. Baselines of 15-115 m E-W and 30-80 m N-S were used, and the robust-weighted data after 6 hours of observations resulted in a synthesized beam of (). A digital correlator configured with MHz channels (11.1 km sec-1) covered a total velocity range of 1330 km sec-1. Uranus ( K) was observed for the absolute flux calibration, and nearby quasar 0346279 (0.92 Jy) was observed at 20 minute intervals to track the phase and short term instrument gain. The data were calibrated using the standard OVRO program MMA (Scoville et al., 1993) and were mapped an analyzed using the imaging program DIFMAP (Shepherd, Pearson, & Taylor, 1994) and AIPS. The uncertainty in absolute flux calibration is about 15%.
A plot of the CO spectrum is shown in Figure 6. No absorption is seen at the level of the noise, which is 15 mJy/beam in each of the 8 MHz (22.2 km sec-1; covering two 4 MHz channels) channel maps. This sets a lower limit on the line to continuum ratio of , or a maximum opacity of 1.2 for the CO line. Invoking a weak LTE approximation, an upper limit to the H2 column density can be derived using Eq. 6 in Wiklind & Combes (1997). If the CO line width is the same as HI (34 km sec-1), then a limiting H2 column density of cm-2 is derived for K and CO abundance of . This limit is nearly two orders of magnitudes smaller than the derived HI column density, and the simple inference is that the absorbing gas is nearly entirely atomic in nature; an unexpected result for the central region of a disk galaxy. This discrepancy can be reduced somewhat if the for the HI and the CO abundance are both significantly lower than assumed values, but this would be unusual for the ISM found in the central kpc disk of a late type galaxy. Alternatively, a difference in the source-absorber geometry may offer a plausible explanation, meaning that the atomic and molecular gas would need to have different spatial distributions. Perhaps the proximity to the central AGN along a fortuitous line of sight is giving us a biased sampling of a more extended gas distribution in the disk.
In order to examine the spectrum for a possible broad CO emission feature, we summed the spectrum over 16 channels (64 MHz or 178 km sec-1per channel). No CO emission feature is detected at any significant level, however, and a upper limit of M is derived assuming a line-width of 355 km sec-1 and using standard CO-H2 conversion. This limit is comparable to that of the Milky Way at (Sanders, Solomon, & Scoville, 1984) and is substantially smaller than what is typically found among IR luminous, gas-rich mergers (; see Sanders et al. 1991). These results coupled with the implied column-density and high optical depth are all suggestive of looking through a Milky-Way like ISM nearly edge-on against a bright, unresolved, obscured radio core.
2.4 Core Properties and Nuclear Spectrum
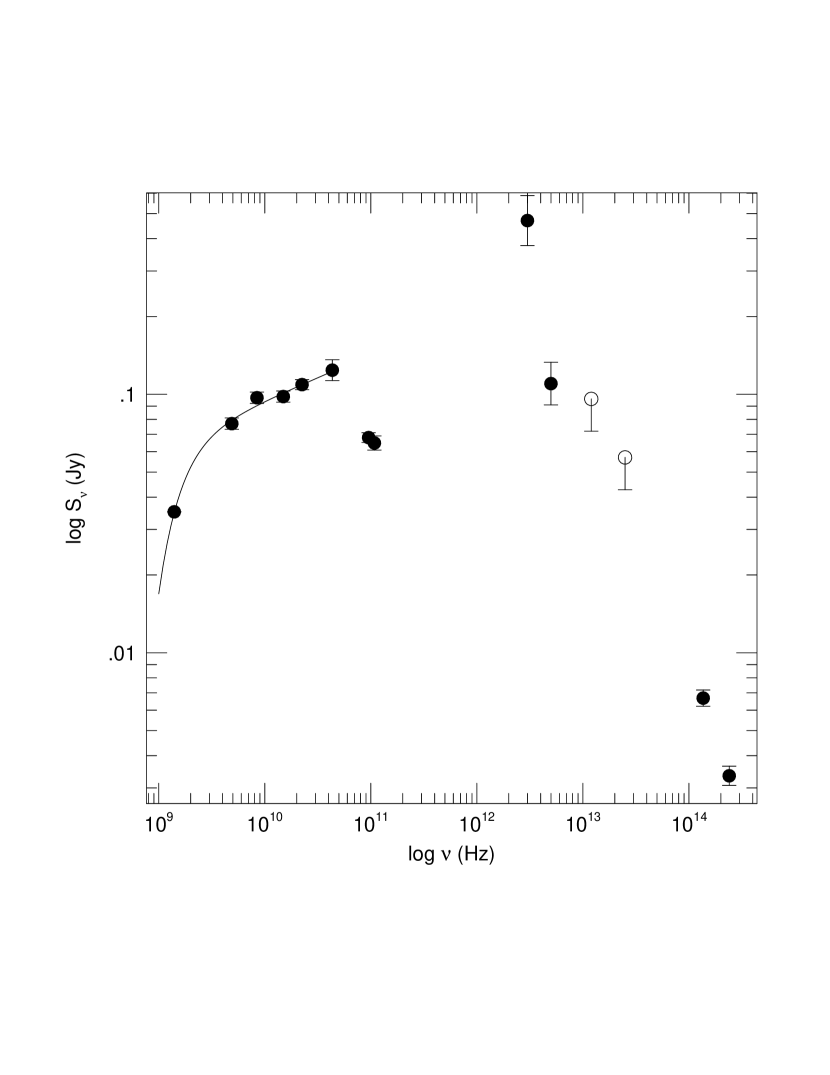
As a result of our 3.6cm observations to detect the inner kpc-scale jet, we also discovered that the core of 0313-192 was significantly brighter at 3.6cm as compared to 20cm (97 as compared to 37 mJy). We obtained Target-of-Opportunity observations with the VLA in early January 1997 in order to determine the core radio spectrum at 6, 2, 1.3, and 0.7 cm (5, 15, and 43 GHz). In Figure 7 we show the nuclear continuum spectrum of 0313-192. The actual flux-densities are given in Table 1. The 6 points to the left are from the VLA. We also include two continuum measurements from OVRO (108 and 95 GHz; 2.8 and 3.1 mm). The points to the right include the IRAS detections at both 100 and 60m, upper-limits at 12 and 25m, and nuclear magnitudes at 1.25 m (J) and 2.2 m (K) (Ledlow, Owen, & Keel, 1998).
Because of the lower resolution of the 20cm observation, the kpc-scale inner jet (Figure 3) is included within the beam, and will bias the estimate of the core brightness. We have estimated the contribution from the jet at 20cm by scaling the flux-density at 3.6cm to 20cm assuming a non-thermal spectrum with (). The peak intensity at 20cm from the map in Figure 4 is 37.3 mJy. The estimated jet contribution is then 2.1 mJy. We therefore adopt a value of 35.1 mJy for the 20cm core flux density. As the spectrum turns over somewhere between 6 and 20cm, the shape of the spectrum is important in this region with regards to possible interpretations of the spectrum.
First, we consider only the radio core spectrum between 1.4 and 43 GHz. The spectrum rises very slowly with frequency between 4.9 (6cm) and 43 GHz (0.7 cm). A linear fit to the spectrum over this range in frequency gives a slope of . An inverted or nearly flat core spectrum is not uncommon in AGN or blazar like hosts with bright radio cores, and suggests that we are looking at a very small central source (like that around a central, supermassive black hole). The turnover between 4.9 and 1.4 GHz is mostly likely due to absorption, either free-free or possibly synchrotron self-absorption. As our spatial resolution is unsufficient to set a size to the core region, we model the turnover as due to a free-free absorbing medium along the line of sight to the compact nucleus. In this case, the observed core continuum spectrum should follow:
| (2) |
where is the flux density of the nuclear source, is the spectral index of the core, and is the frequency dependent optical depth. The optical depth is related to the emission measure and electron temperature via
| (3) |
where EM is the emission-measure of the gas (), is the electron temperature, assumed to be K, and we set . The result of our fit to the radio spectrum between 1.4 and 43.3 GHz is shown in Figure 7. We find , and a normalization of mJy. The turnover in the spectrum between 4.9 and 1.4 GHz can therefore be explained by viewing the compact core through a free-free absorbing medium with with . If we adopt a galaxy inclination of 80-85∘ (Ledlow et al., 1996), and assuming the absorbing cloud is located 100 pc from the mid-plane, we estimate a radius of 500 pc. From equation (3) we then derive , giving for . Once again, these numbers are very similar to what one would expect looking at a compact source through a typical spiral disk at fairly high inclination.
We also include two independent continuum measurements of the core flux-density near 3 mm obtained with the OVRO. The continuum measurement is from the analog correlator with 1 GHz bandwidth. The map has an RMS noise of 2.5 mJy/beam. The continuum source (centered on the nucleus) is unresolved with a measured integrated flux density of mJy at 108 GHz. We had some concerns about the absolute flux calibration at OVRO in April and May 1997 due to some bad weather (in April 1997) and apparent de-correlation on the longer baselines. In order to reconfirm our flux-density measurement, we reobserved 0313-192 at OVRO in the lowest-resolution configuration on 22 April 2000 during excellent weather. At 95 GHz we confirm a measurement of mJy from a total on-source integration of 30 minutes. Mars was used as the primary flux calibrator. This measurement agrees well with the May 1997 measurement, and we thus believe the turnover in the spectrum from 43 to 108 GHz is verified.
What is the nuclear radio-continuum spectrum telling us? The low-frequency turnover appears to be well explained by viewing the central source through a fairly high column-density, free-free absorbing medium. With the high-frequency turnover from 43 to 108 GHz, we may be seeing the transition from optically thick radio emission to optically thin higher frequency emission (an inner size scale to the optically-thin emission) in the most compact region of the inner jet. Spectral turnovers in this region of the spectrum are commonly seen in flat-spectrum radio quasars and blazars (van Bemmel, Barthel, & Yun, 1998; Bloom et al., 1994; Gear et al., 1994; Ade, Rowan-Robinson, & Clegg, 1976). Multi-epoch observations at both 1.4 GHz and 108 GHz appear to rule out any strong variability in the core which might also explain the apparent turnover.
While the FIR points are far-less reliable, we can rule out contamination from other sources within the IRAS beam with some certainty. There is only one other galaxy within the IRAS beam, (see Figure 1) and it is not detected in our radio observations (down to a limit of 72 Jy at 20cm or ). The apparent excess of FIR emission in 0313-192 is similar to the FIR/radio spectra of Seyfert galaxies (Ade, Rowan-Robinson, & Clegg, 1976), where the submm-FIR emission is mostly thermal emission from dust, heated either by stars or the AGN. However, without more complete spectral information any interpretation is very uncertain. A higher resolution FIR observation with SIRTF would enable us to isolate non-thermal and thermal contributions to the FIR flux.
3 The Environment around 0313-192
3.1 Is Abell 428 a Rich Cluster?
As seen in the previous sections, there is clear evidence for large-scale jet emission in this object, and thus 0313-192 is likely the first bona-fide spiral/disk galaxy with jets observed on physical scales much larger than the extent of the host galaxy. One possible reason for the apparent rarity of such objects may be due to the necessity of a confining external medium. As spiral galaxies tend to be found in environments with both lower galaxy and gas densities than ellipticals (the typical host of FR I radio galaxies), one would need to find a spiral galaxy in an environment rich enough to support an intragroup/intracluster gaseous medium (IGM/ICM). While Ponman et al. (1996) find that spiral-rich groups are very often detected in X-rays, it is unclear what is the true nature of the emission; related to an actual diffuse component and external gaseous medium, or rather originating solely from AGN’s and the interstellar medium of individual galaxies. Another possibility is that the diffuse gas in spiral-rich environments is too cool to produce appreciable X-ray emission (Mulchaey, 2000). Spiral-rich groups tend to have lower velocity dispersions, and correspondingly lower implied virial temperatures, consistent with this possibility (Mulchaey et al., 1996). In the case of 0313-192, the presence of the large-scale jets and lobes makes it virtually certain that some kind of medium must be present.
Of particular interest in Abell 428 is the fact that the radio source and host galaxy are found very near (0.05 corrected Abell radii, or 100 kpc) Abell’s catalogued position of the cluster center. A survey of the galaxy population within a 45 arcmin field from the POSS I indicates a very high spiral fraction of 50% based strictly on visual identification of the galaxies. This result contrasts strongly with Abell’s richness counts (), which is very nearly a Richness Class 1 cluster. While Abell 428 has not been the target of a pointed X-ray observation, we are able to set a upper-limit of (Ledlow et al., 2000) within a 500 kpc aperture from the ROSAT All Sky Survey. Based on the fit given in Ledlow et al. (2000), at this richness one would expect an average approximately 5 times higher than the estimated upper-limit.
In order to understand better the environment around 0313-192, we observed this cluster with the MX multifiber spectrograph and Steward Observatory’s 2.3-m telescope on the nights of 12-14 December 1999. A detailed description of the design of the MX spectrometer is given by Hill & Lesser (1986). In brief, the MX spectrograph has 32 fibers available for object targets and another 30 used to obtain a sky spectrum. These observations were made with the new 2-arcsec fiber set installed in 1997. The Field-of-View (FOV) of the instrument is 45 arcmin. The MX fibers are coupled to the Steward Observatory B&C spectrograph with a 1200x800 Loral CCD. We used a 400 line mm-1 grating covering the range 3600-6900 with a dispersion of 2.75. We observed Abell 428 with 5 fiber configurations, targeting 115 different objects within the FOV. Heliocentric velocities were determined using the IRAF Fourier cross-correlation program FXCOR. For templates we used MX spectra of the galaxies; M31, M32, NGC 7331, NGC 3379, and the radial velocity standard stars; HD 90861 (K2 III) and HD 4388 (K3 III). Velocity errors were calculated from the S/N of the cross-correlation, parameterized by the Tonry & Davis (1979) R-value. We used the relationship = 487/(1+R) km sec-1, derived from 251 redundant MX observations of cluster galaxies (Pinkney et al., 2000). Confirmation of the redshift was checked manually from the spectra, and we have rejected objects with as unreliable.
In Table 2 we report 70 (68 new) redshifts (given as ) in the direction of this cluster. The velocity field is shown graphically in Figure 8a,b. Clearly there are two primary peaks in the distribution. Interestingly, there seems to be nearly continuous velocity coverage from 15000-28000 km sec-1. Restricting the objects to velocities in this range, we have applied the KMM algorithm to objectively partition the data into subgroups (Bird, 1993; Davis et al., 1995). Briefly, this algorithm models the velocity distribution as composed of a user-defined number of subgroups, and applies a mixture-modeling technique to determine the goodness of fit for a number of Gaussian distributions as compared to a single distribution. If multiple groups are detected, the objects are assigned (with a probability likelihood) to specific group membership. We find % probability that two Gaussian distributions are a better fit than a single distribution. Using the standard biweight estimators of location and scale: (Beers et al., 1990), two peaks are found at and km sec-1with scales and km sec-1( errors are given on the dispersions). The KMM partitioning finds a mixing proportion of 57% (24) and 43% (18) respectively for groups 1 and 2 after applying a clipping to the velocities around each peak.
The measured velocity dispersions for these groups are nearly identical to the median dispersion ( km sec-1) of a complete sample of nearby poor galaxy clusters (Ledlow et al., 1996), suggesting that 0313-192 lives in a much poorer environment than suggested by Abell’s richness estimate. Using the scaling-law observed for poor groups; (Mahdavi et al., 1999; Mulchaey & Zabludoff, 1998), we would expect an for Group 1 very near to our estimated upper limit. Thus, it may not be surprising that it was not detected. Based on these results Abell 428 is really a projection of multiple groups and not a rich cluster.
3.2 Radio Source Confinement
One of the issues related to finding any extended radio source is confinement. In general, it is required that the pressure in the external environment (the intracluster gas) be comparable to the total pressure (from fields and particles) in the radio lobes in order to confine the source. Otherwise, the radio plasma will simply expand into some type of equilibrium, with a subsequent large decrease in the energy density of the magnetic field and equivalently a large drop in the observed radio luminosity. The lobes could of course be overpressured relative to the external medium, but at least some external, gaseous environment is believed necessary in order to maintain the luminosity of such large, extended sources. There appears to be a trend for radio power to increase with the X-ray luminosity () of the external gas for extended FR I radio galaxies, consistent with this interpretation (Miller et al., 1999).
From the radio map in Figure 1, we have estimated B-fields and total pressures in the radio lobes assuming equipartition in energy between particles and fields. We measure the flux-density over one beam area, and assume that the depth along the line of sight is symmetric to the beam projected in the plane of the sky. We assumed a uniform volume filling factor, transverse magnetic fields, and a synchrotron spectrum with upper and lower cutoff energies of 10 MHz and 100 GHz with a spectral index (). Measured from several locations within the lobes we estimate total (field+particle) equipartition pressures of . These pressures are exactly in the range of thermal gas pressures () estimated from X-rays for poor groups of galaxies (Doe et al., 1995), and a factor of 10 lower than most rich, Abell-class clusters because of the difference in the central gas densities. Over the range , nearly all poor groups have similar intracluster temperatures of keV, and as the relationship flattens substantially over this range in , Most poor groups have fairly similar gaseous environments over a large range in ( 100-400 km sec-1). Thus, 0313-192 is completely consistent with living in a poor-group environment, however a much deeper X-ray observation is now needed to quantify this any further.
3.3 Interpretation of the Velocity Data
Abell 428 appears to be a projection of at least two systems along the line of sight with velocity separation 3302 km sec-1. If this velocity difference were purely Hubble-flow, this corresponds to a physical separation of 41.1 Mpc. The nearly continuous velocity coverage from 15000-28000 km sec-1, however, may suggest that we are seeing some type of supercluster or filament-like structure.
In Figure 9a-d we show contour maps of the adaptively-smoothed galaxy positions. Figure 9a shows the spatial distribution of all galaxies which were targeted by our observations. This distribution is indicative of the actual galaxy distribution within the FOV down to our magnitude limit (), and justifies Abell’s classification of this system as a rich cluster. In Fig 9c,d we show the spatial distributions of groups 1 (containing the radio source) and 2, with the location of 0313-192 marked by a cross. While group 1 is apparently richer than Group 2, it is also more compact. The peak galaxy surface-density in group 1 is nearly a factor of 6.5 times higher than group 2. The radio source ( km sec-1) is offset 99 km sec-1from the velocity peak and 461 kpc in projection to the SW of the peak in the galaxy surface-density distribution for this group (group 1). We see that the distributions are quite different in both orientation and location. In Fig 9b we show the spatial distribution of all galaxies within the 15000-28000 km sec-1range in velocity which are not within of one of the two groups. While the peak is offset slightly to the west of group 1, it appears that the objects with velocities in this range are essentially randomly distributed in the field; i.e.a ratio of 9a and 9b would produce something that is nearly uniform over the areas in common. While we unfortunately do not have complete velocity information for a magnitude-limited sample, these observations suggest that we may be seeing a large complex of galaxy groups and field along our line of sight which is suggestive of a super structure or filament 40 Mpc in size viewed nearly end-on.
We have also examined the velocity data sets for evidence of substructures, possibly related to merging, ongoing dynamical activity, or otherwise unrelaxed conditions. As tests of the entire data set would undoubtedly find substructure because there is more than one distinct group of galaxies both spatially and along our line of sight (viewed in projection), we consider each group separately for the tests. We applied a number of statistical tests of the 1D (velocity), 2D (spatial distribution), and 3D (velocity + spatial) distributions, which are summarized in Pinkey et al. (1996).
We find no evidence of 1D substructure for either galaxy group, consistent with the velocity distributions being essentially Gaussian However, for Group 1 (which contains the radio source), we do find statistically significant () signs of substructure in both 2D and 3D tests. For the 2D tests, both the and tests were significant (the -test at the level). The -test is a symmetry test, in that it is sensitive to significant deviations from mirror symmetry about the cluster center. It is not sensitive to circular asymmetries, so the elongation of Group 1 seen in Figure 9 does not explain the result. We interpret the result as caused by clumpiness in the spatial distribution; there are significant clumps of galaxies both to the NE and SW of 0313-192, while 0313-192 has only very few galaxies within a few hundred kpc. For the 3D tests, the Dressler & Shectman (1988) (DS or -test) was significant at for group 1 only. The DS-test looks for deviations in the local mean velocity and dispersion as compared to the global mean and dispersion. For group 1, quite significant substructure is seen both to the NE and SW (the most significant) of 0313-192, consistent with the 2D-clumping found from the -test. Note that this does not necessarily have to be the case; the 2D and 3D tests find substructure in the same parts of the cluster only because the clumps in 2D space have low velocity dispersions, and are significantly different from the mean of the group. This picture supports the interpretation that the galaxies within Group 1 are not dynamically relaxed. The fact that the substructures are seen on the outskirts of the group, both spatially and in velocity space, would suggest that the group is in the process of collapsing or merging-together. The lack of 1D substructure, the low velocity dispersion, and the high compactness of Group 1 are all consistent with this happening more or less along our line of sight. Interestingly, this result is similar to our view of the larger-scale structure being some type of filament viewed end-on. While it is not clear to what extent these results are important in terms of understanding the unusual radio source in 0313-192, we note that the position angle of the radio source appears to point within of the direction towards the primary (sub)clump of galaxies to the NE and SW, possibly aligning along a merger axis, if this interpretation is correct.
4 Discussion
We have shown that 0313-192 is an unusual, and in many respects an unique object. One then wonders as to why only one such radio source has so far been detected in a spiral galaxy. Is there something unique about the host galaxy and the nuclear environment which has allowed a powerful FR I radio source to form and develop? Is there something unique about the external environment around 0313-192? Is it possible that while rare, there is a population of such objects which have simply been missed in existing surveys? This last point certainly seems plausible. In terms of dedicated searches/surveys of radio galaxies, rich clusters have been much more thoroughly studied than groups or the field, and spiral galaxies are not terribly common in the cores of rich clusters. As we have shown, Abell 428 should not really be catalogued as a rich cluster at all. It is possible that similar objects might be found from the FIRST and NVSS surveys, although clearly this would require optical identifications and morphologies for a very large number of objects. These surveys are also limited, in that while NVSS has the sensitivity to find such objects, the resolution is poor and only a very nearby object would appear significantly extended to warrant further inspection. The FIRST survey has the resolution, however the surface brightness sensitivity is much lower, and the extended emission might likely be missed or resolved out. Thus, a targeted radio survey of poor groups, and in particular, spiral-rich groups might gleam more similar objects.
Our probes of the extra-nuclear environment as seen in HI absorption and a limit on CO and the gas mass both strongly suggest that we are looking through an interstellar medium resembling a typical spiral galaxy like the Milky Way. With regards to the HI-absorption, the optical-depths and column-densities inferred are consistent with this perspective. However, the upper limit to the CO emission is somewhat surprising. The inferred gas mass not only precludes 0313-192 resembling a typical gas-rich merger remnant, but the limit is sufficiently stringent to require either spatial segregation of the two phases in the absorbing medium or an ISM unusually deficient in molecular gas, which would be unexpected for a the inner region of a spiral galaxy. It is possible, though unlikely (?) that our line of sight to the nucleus intercepted a particularly high density cloud or region of the inner gas distribution (meaning that we overestimate the inferred gas mass based on this line of sight), although the extremely narrow line width is difficult to understand in this context. Thus, there are still several unanswered questions, although the general picture of a spiral disk and ISM would appear to be supported by the observations.
In terms of the nuclear properties, 0313-192 shares many similarities with QSO or Blazar-like AGN’s. The radio luminosity of the core and flat continuum spectrum in particular is very similar to the typical QSO. However, there are no other objects in nearby Quasar samples with similar radio morphology. Bahcall et al. (1997) studied 20 nearby QSO’s, 3 with spiral morphology. Two of these (PG 0052+251 and PG 1402+261) are not detected by NVSS or FIRST. The other source, PG 1309+355 (z=0.184), has a flat-spectrum core (40 mJy at 4.9 GHz and 44 mJy at 1.4 GHz) five times stronger than 0313-192. However, there is no evidence for more extended emission or a jet. Boyce et al. (1998); Boyce, Disney, & Bleaken (1999) studied 19 nearby QSO’s, 3 with spiral hosts. Only one of the three (MS 07546+3928, z=0.096) was detected in the radio. MS 07546+3928 appears to be resolved on the NVSS, with a total flux-density of 32.4 mJy at 1.4 GHz (). On the FIRST image, however, the 32.4 mJy NVSS source is resolved into two sources (21.2 and 11.2 mJy), 39 arcsec in separation. The weaker of these two is centered at the position of the QSO. There is no evidence from the FIRST image of any diffuse emission connecting the two sources. Thus, of the 39 nearby QSO’s studied in these surveys, 6 (15%) have clear spiral hosts. Among these, only two (5%) are detected in current radio surveys. This is similar to the expected radio-loud fraction of optically-selected luminous AGN’s.
There are some similarities between 0313-192 and IIIZw2, claimed to be the first superluminal jet found in a spiral/Seyfert galaxy. Brunthaler et al. (2000) model IIIZw2 as an example of a frustrated jet interacting with the dense ISM on the subpc scale. And, like 0313-192, IIIZw2 exhibits an inverted core spectrum at low frequencies and a peak and similarly a high frequency turnover somewhere between 0.7 and 3mm (43-108 GHz) range. The radio core in IIIZw2 is however much brighter and highly variable, brightening by a factor of 20 within only a 2 year time span (Falcke et al., 1999). Falcke et al. (1999) model the outburst spectrum and timescale as being due to shocks and very compact hotspots. Thus, the central AGN in IIIZw2 must be instrinsically much more luminous than in 0313-192 and the extranuclear environments possibly very different in order for the jets to escape to kpc scales in the latter. While there is a suggestion of a lobe-like structure 15″to the SW in IIIZw2 (22 kpc at z=0.089), it is not clear that there is a direct connection to the subpc scale jet and the galaxy itself (Kukula et al., 1998). If they are related, IIIZw2 resides at the upper envelope of radio source sizes for Seyfert galaxies, but is still a factor of 10 smaller than 0313-192.
This comparison would suggest that 0313-192 is host to a QSO-like central engine, but that in itself is not sufficient to produce extended jet and lobe emission typical of FR I radio galaxies. Thus, the extended nature of 0313-192 might still be related to a set of special circumstances. As pc-scale jets are frequently seen, even in Seyfert samples (with significantly lower core fluxes than in 0313), the presence of such a large-scale jet would suggest that both the initial conditions in the jet and the immediate environment around it might be somehow different in 0313-192. 0313-192 is clearly at the upper-end of the radio luminosity function of typical Seyferts, so should be considered an extreme case in that regard. Exactly how rare is 0313-192 is not yet known, and more dedicated search will be necessary in order to find for more examples. Further high-resolution observations are warranted and will be necessary to probe the environment within the inner kpc and to address these and other questions. Understanding this object may therefore shed light on the different natures of nuclear activity and perhaps more fundamentally, will impact our understanding of AGN unification models in general.
5 Conclusions
From the new observations presented in this paper we make the following conclusions regarding the nature of the unusual object 0313-192:
-
1.
0313-192 appears to be the first confirmed disk/spiral galaxy with kpc -scale radio jets and double lobed radio morphology. The jet would appear to be nearly continuous from sub-kpc to the full extent of kpc feeding into the southern lobe.
-
2.
The shape of the nuclear radio spectrum strongly resembles a QSO or Blazar-like object, rising towards higher frequencies (inverted).
-
3.
The nuclear continuum source is nearly completely absorbed by HI along our line of sight. Essentially all of the absorption falls within a single channel at our resolution (11 km sec-1, EW of the line is 32 km sec-1) and at the systemic velocity of the galaxy. The implied optical depth is , which is nearly unprecedented and is more extreme than any other observed Seyfert galaxy. We can rule out an extended halo of HI, so the HI much be concentrated much nearer the nucleus, likely in a disk-like distribution. The inferred column density is .
-
4.
We place a fairly stringent limit to CO emission, which gives an upper-limit to the molecular gas mass nearly two orders of magnitude less than the derived HI column density. So, either the absorbing gas is nearly entirely atomic, or the two phases of the absorbing material are spatially segregated in this part of the disk (along our line of sight and in close proximity to the nucleus). Both interpretations are somewhat difficult to understand for the inner region of a disk galaxy. The limit to the gas mass based on standard conversions is approximately that of the Milky Way. We can therefore rule out with some confidence that 0313-192 is typical of IR Luminous, Gas-Rich merger remnants, and resembles more a typical spiral seen nearly edge-on.
-
5.
We model a low-frequency turnover (4.8-1.4 GHz) in the radio continuum spectrum as seeing the source through a fairly high column-density () Free-Free absorbing medium. A possible turnover at higher frequencies (108 GHz) may indicate that we are seeing the transition between optically thick/thin emission from the most compact region of the inner jet.
-
6.
Abell 428 should be reclassified, as the velocity distribution of galaxies in the field can be characterized by at least 2 groups in velocity space which overlap in their spatial distributions. A nearly continuous range of observed velocities over 13000 km sec-1coupled with the spatial distributions of the clumps suggests that we are looking down a fairly extensive filament-like structure of order 40 Mpc in extent. 0313-192 lives in the richer and more compact of the two groups, although does not appear to reside at the dynamical center of its parent group.
References
- Ade, Rowan-Robinson, & Clegg (1976) Ade, P.A.R., Rowan-Robinson, M., & Clegg, P.E. 1976, A&A, 53, 403
- Bahcall et al. (1997) Bahcall, J. N., Kirhakos, S., Saxe, D.H., & Schneider, D.P. 1997, ApJ, 479, 642
- Baum et al. (1993) Baum, S.A., O’Dea, C.P., Dallacassa, D., de Bruyn, A.G., & Pedlar, A. 1993, ApJ, 419, 553
- Beers et al. (1990) Beers, T.C., Flynn, K., & Gebhardt, K. 1990, AJ, 100, 32
- Bird (1993) Bird, C.M. 1993, Ph.D. thesis, University of Minnesota
- Bloom et al. (1994) Bloom, S.D., Marscher, A.P., Gear, W.K., Terasranta, H., Valtaoja, E., Aller, H.D., & Aller, M.F. 1994, AJ, 108, 398
- Boyce, Disney, & Bleaken (1999) Boyce, P.J., Disney, M.J., & Bleaken, D.G. 1999, MNRAS, 302, L39
- Boyce et al. (1998) Boyce, P. J., Disney, M. J., Blades, J. C., Boksenberg, A., Crane, P., Deharveng, J. M., Macchetto, F. D., Mackay, C. D., & Sparks, W. B. 1998, MNRAS, 298, 121
- Brunthaler et al. (2000) Brunthaler, A., Falcke, H., Bower, G.C., Aller, M.F., Aller, H.D., Teräsranta, H., Lobanov, A.P., Krichbaum, T.P., & Patnaik, A.R. 2000, A&A, 357, L45
- Davis et al. (1995) Davis, D.S., Bird, C.M., Mushotzky, R.F., & Odewahn, S.C. 1995, AJ, 440, 48
- Dickey et al. (1983) Dickey, J.M., Kulkarni, S.R., van Gorkom, J.H., & Heiles, C.E. 1983, ApJS, 53, 591
- Doe et al. (1995) Doe, S.M., Ledlow, M.J., Burns, J.O., & White, R.A. 1995, AJ, 110, 46
- Dressler & Shectman (1988) Dressler, A. & Shectman, S.A. 1988, AJ, 95, 985
- Engargiola et al. (1988) Engargiola, G., Harper, D.A., Elvis, M., & Willner, S.P. 1988, ApJ, 332, L19
- Falcke et al. (1999) Falcke, H., Bower, G.C., Lobanov, A.P., Krichbaum, T.P., Patnaik, A.R., Aller, M.F., Aller, H.D., Teräsranta, H., Wright, M.C.H., & Sandell, G. 1999, ApJ, 514, L17
- Falcke et al. (1998) Falcke, H., Goss, W.M., Matsuo, H., Teuben, P., Zhao, J.-H., & Zylka, R. 1998, ApJ, 499, 731
- Fanaroff & Riley (1974) Fanaroff, B.L. & Riley, M.J. 1974, MNRAS, 167, 31p
- Gallimore et al. (1999) Gallimore, J.F., Baum, S.A., O’Dea, C.P., Pedlar, A., & Brinks, E. 1999, ApJ, 524, 684
- Gear et al. (1994) Gear, W.K., Stevens, J.A., Hughes, D.H., Litchfield, S.J., Robson, E.I., Terasranta, H., Valtaoja, E., Steppe, H., Aller, M.F., & Aller, H.D. 1994, MNRAS, 267, 167
- Heckman et al. (1985) Heckman, T.M., Illingworth, G.D., Miley, G.K., & van Breugel, W.J.M. 1985, ApJ, 299, 41
- Helou, Soifer, & Rowan-Robinson (1985) Helou, G., Soifer, B.T., & Rowan-Robinson, M. 1985, ApJ, 298, 7
- Hill & Lesser (1986) Hill, J.M. & Lesser, M.P. 1986, Proc. SPIE, 627, 303
- Hill & Oegerle (1993) Hill, J.M. & Oegerle, W.R. 1993, AJ, 106, 831
- Kukula et al. (1999) Kukula, M.J., Ghosh, T., Pedlar, A., & Schilizzi, R.T. 1999, ApJ, 518, 117
- Kukula et al. (1998) Kukula, M.J., Dunlop, J.S., Hughes, D.H., & Rawlings, S. 1998, MNRAS, 297, 366
- Kukula et al. (1995) Kukula, M.J., Pedlar, A., Baum, S.A., & O’Dea, C.P. 1995, MNRAS, 276, 1262
- Ledlow et al. (2000) Ledlow, M.J., Voges, W., Owen, F.N., & Burns, J.O. 2000, submitted to AJ
- Ledlow, Owen, & Eilek (2000) Ledlow, M.J., Owen, F.N., & Eilek, J.A. 2000, to appear in New Astron. Rev.
- Ledlow, Owen, & Keel (1998) Ledlow, M.J., Owen, F.N., & Keel, W.C. 1998, ApJ, 495, 227
- Ledlow & Owen (1996) Ledlow, M.J. & Owen, F.N. 1996, AJ, 112, 9
- Ledlow et al. (1996) Ledlow, M.J., Loken, C., Burns, J.O., Hill, J.M., & White, R.A. 1996, AJ, 112, 388
- Liszt, Burton, & van der Hulst (1985) Liszt, H.S., Burton, W.B., & van der Hulst, J.M. 1985, A&A, 142, 245
- Mahdavi et al. (1999) Mahdavi, A., Böhringer, H., Geller, M.J., & Ramella, M. 1999, astro-ph/9912121
- Maloney, Hollenbach, & Tielens (1996) Maloney, P.R., Hollenbach, D.J., & Tielens, A.G.G.M. 1996, ApJ, 466, 561
- Meisenheimer (1999) Meisenheimer, K. 1999, in The Radio Galaxy Messier 87, H.-J. Röser & K. Meisenheimer eds., (Springer, Berlin) p.188
- Miller et al. (1999) Miller, N.A., Owen, F.N., Burns, J.O., Ledlow, M.J., & Voges, W. 1999, AJ, 118, 1988
- Mulchaey & Zabludoff (1998) Mulchaey, J.S. & Zabludoff, A.I. 1998, ApJ, 496, 73
- Mulchaey (2000) Mulchaey, J.S. 2000, to appear in ARA&A(astro-ph/0009379)
- Mulchaey et al. (1996) Mulchaey, J.S., Mushotzky, R.F., Burstein, D., & Davis, D.S. 1996, ApJ, 456, L5
- Owen & Ledlow (1997) Owen, F.N. & Ledlow, M.J. 1997, ApJS, 108, 41
- Owen, Ledlow, & Keel (1995) Owen, F.N., Ledlow, M.J., & Keel, W.C. 1995, AJ, 109, 14
- Owen, Hardee, & Cornwell (1989) Owen, F.N., Hardee, P.E. and Cornwell, T. 1989, ApJ, 340, 698
- Pinkney et al. (2000) Pinkney, J., Burns, J.O., Ledlow, M.J., Gómez, P.L., & Hill, J.M. 2000, accepted for publication in AJ
- Pinkey et al. (1996) Pinkney, J., Roettiger, K., Burns, J.O., & Bird, C.M. 1996, ApJS, 104, 1
- Ponman et al. (1996) Ponman, T.J., Bourner, P.D.J., Ebeling, H., & Böhringer, H. 1996, MNRAS, 283, 690
- Sanders, Solomon, & Scoville (1984) Sanders, D.B., Solomon, P.M., & Scoville, N.Z. 1984, ApJ, 276, 182
- Scoville et al. (1993) Scoville, N.Z., Carlstrom J.E., Chandler, C.J., et al. 1993, PASP, 105, 1482
- Shepherd, Pearson, & Taylor (1994) Shepherd, M.C., Pearson, T.J., & Taylor, G.B. 1994, BAAS, 26, 987
- Tonry & Davis (1979) Tonry, J. & Davis, M. 1979, AJ, 84, 1511
- Ulvestad, Antonucci, & Goodrich (1995) Ulvestad, J.S., Antonucci, R.R.J., & Goodrich, R.W. 1995, AJ, 109, 81
- van Bemmel, Barthel, & Yun (1998) van Bemmel, I. M., Barthel, P.D., & Yun, M.S. 1998, A&A, 334, 799
- Wiklind & Combes (1997) Wiklind, T. & Combes, F. 1997, A&A, 328, 48


| Frequency | Wavelength | Flux-Density |
|---|---|---|
| (GHz) | (mJy) | |
| 1.4aaWe have subtracted jet-emission on the sub-arcsec scale from the 20 cm core-flux density assuming (), and extrapolating from the 8.4 GHz integrated flux-density of the jet to 1.4 GHz. | 20 cm | 35.10.1 |
| 4.9 | 6 cm | 774 |
| 8.5 | 3.6 cm | 975 |
| 14.9 | 2 cm | 985 |
| 22.5 | 1.3 cm | 1095 |
| 43.3 | 0.7 cm | 12412 |
| 95.3 | 3.2 mm | 683 |
| 108.0 | 3.6 mm | 64.84.2 |
| 100 m | 470117 | |
| 60 m | 11023 | |
| 25 m | 96 | |
| 12 m | 57 | |
| 2.2 m | 6.70.5 | |
| 1.2 m | 3.30.3 |
| RA (2000) | DEC (2000) | ||
|---|---|---|---|
| (km sec-1) | (km sec-1) | ||
| 03:15:52.1 | –19:06:45 | 20143aaThis object is the subject of this paper, 0313-192. Redshift was also published in Owen, Ledlow, & Keel (1995). | 66 |
| 03:15:49.8 | –19:06:23 | 15225 | 87 |
| 03:15:49.0 | –19:05:05 | 15266 | 82 |
| 03:16:07.2 | –19:03:35 | 19836 | 80 |
| 03:16:12.5 | –19:04:55 | 19788 | 35 |
| 03:16:16.6 | –19:04:59 | 20318bbThis object is the other radio galaxy identified in A428 (Owen & Ledlow, 1997). Redshift was also published in Owen, Ledlow, & Keel (1995). | 37 |
| 03:16:11.6 | –19:03:06 | 19876 | 31 |
| 03:16:20.8 | –19:00:52 | 20314 | 66 |
| 03:16:23.3 | –19:00:39 | 19502 | 106 |
| 03:16:01.0 | –19:14:35 | 23951 | 98 |
| 03:15:22.2 | –18:59:15 | 9914ccEmission-line velocity. | 25 |
| 03:15:50.7 | –19:07:00 | 23584 | 105 |
| 03:16:00.3 | –19:10:08 | 61631 | 100 |
| 03:16:45.1 | –18:56:12 | 15997 | 92 |
| 03:16:40.6 | –18:57:04 | 15599 | 90 |
| 03:16:30.0 | –19:01:42 | 20015 | 79 |
| 03:16:15.1 | –19:00:48 | 19742 | 49 |
| 03:16:07.1 | –19:02:26 | 30175 | 88 |
| 03:16:12.3 | –19:02:40 | 20752 | 107 |
| 03:16:18.2 | –19:02:44 | 22893 | 99 |
| 03:16:04.2 | –19:04:53 | 19948 | 102 |
| 03:15:54.7 | –19:00:56 | 20888 | 89 |
| 03:15:49.4 | –19:11:18 | 20293 | 77 |
| 03:16:06.8 | –19:14:22 | 23447 | 38 |
| 03:16:15.2 | –19:08:55 | 23487 | 84 |
| 03:16:19.0 | –19:04:05 | 22088 | 108 |
| 03:15:48.5 | –19:02:57 | 24943 | 98 |
| 03:15:38.3 | –19:00:21 | 19624 | 27 |
| 03:16:02.8 | –19:14:35 | 34159 | 84 |
| 03:16:44.2 | –19:14:06 | 23409 | 73 |
| 03:16:06.1 | –19:07:25 | 20048 | 115 |
| 03:16:10.6 | –19:09:39 | 20277 | 110 |
| 03:16:14.4 | –19:01:06 | 19929 | 84 |
| 03:15:49.3 | –18:52:12 | 20074 | 112 |
| 03:15:52.2 | –18:57:05 | 25263 | 51 |
| 03:15:34.9 | –18:57:54 | 23148 | 55 |
| 03:15:39.2 | –18:58:38 | 23290 | 100 |
| 03:16:35.8 | –18:45:31 | 19859 | 100 |
| 03:16:00.8 | –18:54:35 | 23276 | 43 |
| 03:17:10.4 | –18:59:36 | 23258 | 55 |
| 03:17:03.4 | –18:59:46 | 18383 | 34 |
| 03:17:19.0 | –19:00:09 | 25081 | 98 |
| 03:16:50.3 | –18:44:28 | 22816 | 51 |
| 03:16:58.0 | –19:18:32 | 27307 | 80 |
| 03:16:57.4 | –19:19:56 | 24872 | 65 |
| 03:16:56.9 | –19:17:11 | 33331 | 75 |
| 03:16:53.8 | –19:18:32 | 87649 | 92 |
| 03:16:24.0 | –19:16:18 | 8406ccEmission-line velocity. | 20 |
| 03:16:20.6 | –19:16:24 | 23269 | 66 |
| 03:16:15.0 | –19:17:32 | 23392 | 60 |
| 03:16:21.0 | –19:19:15 | 20283 | 79 |
| 03:16:57.9 | –19:12:04 | 59135 | 65 |
| 03:16:51.5 | –19:12:58 | 17342 | 89 |
| 03:17:20.5 | –19:27:09 | 25017 | 54 |
| 03:15:34.2 | –19:15:07 | 25821ccEmission-line velocity. | 50 |
| 03:15:25.1 | –19:19:24 | 19935 | 94 |
| 03:15:04.0 | –19:22:20 | 68600 | 110 |
| 03:15:44.9 | –19:19:58 | 68423 | 58 |
| 03:15:09.6 | –19:11:12 | 52260 | 83 |
| 03:14:46.3 | –19:13:03 | 20042 | 34 |
| 03:14:25.6 | –19:10:49 | 20818 | 97 |
| 03:14:43.3 | –19:08:04 | 19879 | 76 |
| 03:15:04.7 | –19:05:40 | 17600 | 100 |
| 03:14:56.6 | –19:01:03 | 22824 | 77 |
| 03:14:31.6 | –19:00:56 | 23411 | 70 |
| 03:14:38.3 | –18:50:12 | 24372 | 118 |
| 03:14:46.1 | –18:45:24 | 29901 | 70 |
| 03:15:26.5 | –18:44:26 | 23470 | 61 |
| 03:15:52.7 | –19:02:18 | 18069 | 86 |